

Volume 9, Issue 4 (July & August 2018 2018)
BCN 2018, 9(4): 227-240 |
Back to browse issues page


Download citation:
BibTeX | RIS | EndNote | Medlars | ProCite | Reference Manager | RefWorks
Send citation to:


BibTeX | RIS | EndNote | Medlars | ProCite | Reference Manager | RefWorks
Send citation to:
Akbarian B, Erfanian A. Automatic Seizure Detection Based on Nonlinear Dynamical Analysis of EEG Signals and Mutual Information. BCN 2018; 9 (4) :227-240
URL: http://bcn.iums.ac.ir/article-1-923-en.html
URL: http://bcn.iums.ac.ir/article-1-923-en.html


1- Iran Neural Technology Research Centre, Iran University of Science and Technology, Tehran, Iran.
2- Department of Bioelectrical Engineering, School of Electrical Engineering, Iran University of Science and Technology, Tehran, Iran.
2- Department of Bioelectrical Engineering, School of Electrical Engineering, Iran University of Science and Technology, Tehran, Iran.
Keywords: Epilepsy, Mutual information, Nonlinear analysis, Recurrence quantification analysis, Seizure detection
Full-Text [PDF 1111 kb]
| Abstract (HTML)


2.1.3.2. Diagonal line measures
These measures are calculated from the histogram P(ε,l) of diagonal lines with a length of l. The RP of stochastic systems has none or short diagonal lines structure and more single points, while deterministic systems are characterized by longer diagonal lines and less single isolated recurrence points.
The Determinism (DET) or predictability of a system can be measured by the ratio of recurrence points that form diagonal structures (of at least length lmin) to all recurrence points:


Recurrence Period Density Entropy (RPDE) is a measure that can describe the complexity of a signal and determine the periodicity of a signal (Mukherjee et al., 2015). A system with periodic behavior has a RPDE with a value close to 0, whereas a system with chaotic behavior has RPDE a close to 1 (Nair & Kiasaleh, 2014). The RPDE can be computed as follows:


Full-Text:
1. Introduction
Epilepsy is a chronic neurological disorder that can cause recurrent seizures and characterized by sudden, excessive, disordered, hypersynchronous, and localized electrical discharge of a group of neurons in the brain that can temporarily change brain functions, (i.e. transient impairments of sensation, altered state of consciousness, or loss of awareness, and focal involuntary movements or convulsions (Osorio, Zaveri, Frei, & Arthurs, 2016).
Sudden and recurrent seizures can have significant effect on the life of the epileptic patient. Obviously reliable real-time detection of seizures could significantly improve the therapeutic potentials like “closed-loop” therapies. In closed-loop therapies, electrical stimulation, drug infusion, cooling, or biofeedback may be delivered in response to seizure detection (Ramgopal et al., 2014). Patients with epilepsy are usually treated with Antiepileptic Drugs (AEDs) to control their seizures (Wlodarczyk, Palacios, George, & Finnell, 2012); accurate real-time detection of seizures is critical to reduce the side effects by on demand delivering of AEDs during the preictal phase with short-acting drugs.
A conventional technique for diagnosis and analysis of epilepsy is the long-term EEG recording for several days and then visual inspection of EEG recordings by human specialists. To reduce the burden of time-consuming inspection, a robust real-time seizure-detection system could facilitate long-term monitoring and localization of the epileptogenic zone (i.e. the brain zone that can generate seizures), which is helpful in preoperational evaluations. Accordingly, there is a strong demand for developing Automatic Seizure Detection (ASD) systems. A seizure detection system should be able to identify the occurrence of seizures from the ongoing EEG or intracranial EEG by classification of the brain signals. Different approaches have been proposed to deal with the automatic seizure detection. The key components of seizure detection are feature extraction from brain electrical activity and then their classification. So far, different approaches based on time-domain analysis, frequency-domain analysis, and information theory have been used for feature extraction (Thomas, Temko, Marnane, Boylan, & Lightbody, 2013; Yang, Jeannès, Bellanger, & Shu, 2013; Page et al., 2015; Peker, Sen, & Delen, 2016).
Empirical Mode Decomposition (EMD) have been used for extracting features from the Intrinsic Mode Functions (IMFs) of EEG signals for seizure detection (Pachori, 2008; Oweis & Abdulhay, 2011; Pachori & Bajaj, 2011; Bajaj & Pachori, 2012; Alam & Bhuiyan, 2013; Riaz, Hassan, Rehman, Niazi, & Dremstrup, 2016). The mean frequency measure of IMFs has been used as a feature to recognize the difference between seizure (ictal) and seizure-free (interictal) EEG signals (Pachori, 2008). Oweis and Abdulhay (2011) used the weighted frequency of IMFs as the feature set for discriminating healthy EEG from epileptic EEG signals.
The area measurement of the analytic IMFs has been also used as a feature set for discriminating healthy from the epileptic seizure (Pachori & Bajaj, 2011). Bajaj and Pachori (2012) used the amplitude and frequency modulation bandwidths of the analytic IMFs as the feature set for distinguishing seizure and non-seizure EEG signals. The higher order moments, including variance, kurtosis, and skewness, extracted from the IMFs of the EEG signals were used as the features for classification of various cases; including healthy, interictal, and ictal; healthy and seizure; nonseizure and seizure; and interictal and ictal (Alam & Bhuiyan, 2013). Recently, spectral centroid, coefficient of variation, and the spectral skew of the IMFs have been used for feature extraction to detect epileptic seizures (Riaz et al., 2016).
A series of studies have focused on Nonlinear Dynamical Analysis (NDA) of EEG signals to extract features for detection of epilepsy (Srinivasan, Eswaran, & Sriraam, 2007; Chen et al., 2011; Niknazar et al., 2013; Yaylali, Koçak, & Jayakar, 1996; Cerf, Amri, Ouasdad, & Hirsch, 1999; Adeli, Ghosh-Dastidar, & Dadmehr, 2007; Ghosh-Dastidar, Adeli, & Dadmehr, 2007; Iasemidis et al., 2003; Van Drongelen et al., 2003; Easwaramoorthy & Uthayakumar, 2011; Zhou, Liu, Yuan, & Li, 2013; Zabihi et al., 2016; Thomasson, Hoeppner, Webber, & Zbilut, 2001; Li, Ouyang, Yao, & Guan, 2004; Ouyang, Li, Dang, & Richards, 2008; Niknazar, Mousavi, Vahdat, & Sayyah 2013). These features include Approximate Entropy (ApEn) (Srinivasan et al., 2007; Chen et al., 2011; Niknazar et al., 2013), correlation dimension (Yaylali et al., 1996; Cerf et al., 1999; Adeli et al., 2007; Ghosh-Dastidar et al., 2007), Lyapunov exponent (Niknazar et al., 2013; Adeli et al., 2007; Ghosh-Dastidar et al., 2007; Iasemidis et al., 2003), Kolmogorov entropy (Van Drongelen et al., 2003), fractal dimension (Niknazar et al., 2013; Easwaramoorthy & Uthayakumar, 2011), lacunarity (Zhou et al., 2013), and features extracted from Poincaré section (Zabihi et al., 2016) as well as Recurrence Quantification Analysis (RQA) (Niknazar et al., 2013; Thomasson et al., 2001; Li et al., 2004; Ouyang et al., 2008; Niknazar et al., 2013).
In spite of numerous approaches for feature extraction, a major challenge to classify the electrical brain activity for detecting epilepsy is the selection from a large number of available EEG features. Searching important and relevant features is essential to improve the accuracy, efficiency, and generalization of a classification process. There have been a few studies on the feature selection for seizure detection (D’Alessandro et al., 2003; Temko, Nadeu, Marnane, Boylan, & Lightbody, 2011; Wang & Lyu, 2015; Zhang & Parhi, 2016). Genetic algorithm (D’Alessandro et al., 2003), recursive feature elimination (Temko et al., 2011; Wang & Lyu, 2015), and Fisher’s linear discriminant analysis combined with the branch and bound algorithm (Zhang & Parhi, 2016) were employed to select EEG features for epileptic seizure detection.
In this paper, a feature selection algorithm, which is based on Mutual Information (MI) estimates (Kwak & Choi, 2002; Peng, Long, & Ding, 2005) is used for seizure detection. MI is a nonparametric measure of the dependence between random variables and is always non-negative. In terms of MI, the aim of the feature selection is to find features from a large feature set which jointly has the largest dependency on the target class. The original features were extracted from RQA of the EEG signals. The RQA of the EEG signals is used to characterize the nonlinear EEG dynamics and extract appropriate features for automatic seizure detection. We extend the previous RQA-based features and introduce different RQA measures, which are important for measuring the complexity.
The dataset provided by Dr. R. Andrzejak was used in this study (Andrzejak, Lehnertz, Rieke, Mormann, David, & Elger, 2001). The dataset consists of 500 single-
channel EEG segments, each lasts 23.6 s, and is categorized into five subsets (marked as sets A-E) while each subset contains 100 EEG segments. The subsets A and B have been recorded from five healthy candidates with their eyes open and closed, respectively, using the standard 10–20 electrode arrangement. The subsets C and D contain EEG signals recorded during interictal intervals from the epileptogenic region and the hippocampal formation of the opposite hemisphere, respectively. The subset E includes EEG segments corresponding to seizure attacks, recorded using all the electrodes. The subsets A and B have been recorded extracranially, whereas subsets C, D, and E have been recorded intracranially. The EEG signals were recorded in a digital format at the sampling rate of 173.61 Hz and were band-pass filtered between 0.53 and 60 Hz. Figure 1 demonstrates the typical EEG signals from each subset.
2. Methods
2.1. Feature extraction procedure
The original features were extracted from the RQA of the EEG signals. The first step in RQA is the reconstruction of the phase space trajectory and construction of the Recurrence Plot (RP). RP is a technique, which can visualize the recurrence of the system states of a dynamical system in the phase space.
2.1.1. Phase space reconstruction
An important step in the analysis of any dynamical system is the reconstruction of its phase space. The phase space of a dynamical system is a space, which shows all states of a system, whereas each state of the system corresponds to one unique point in the phase space. Phase space is a geometrical representation of system dynamics. A frequently used method for the phase space reconstruction is Taken’s time delay method (Marwan, Romano, Thiel, & Kurths, 2007). According to Taken’s theorem, the dynamics of time series (u1,u2,…,uN) can be embedded in an m-dimensional phase space by the vector as follows:
, where τ and m are the time delay and the embedding dimension, respectively. In order to fully capture the dynamics, an appropriate time delay and the embedding dimension should be chosen. A proper time delay is the first local minimum of the MI function (Fraser & Swinney, 1986). Cao (1997) proposed a method to define the minimum embedding dimension from a scalar time series. The method is started with a low value of the embedding dimension m and then increasing it until the number of false neighbors’ reduces to zero. In this paper, we used MI and Cao’ methods to approximate the time delay and embedding dimension, respectively.
2.1.2. Recurrence plot
Recurrence is a substantial nature of dynamical systems (Marwan et al., 2007). Eckmann et al. (1987) introduced a method to visualize the recurrences of dynamical systems called RP (Marwan et al., 2007). To construct the RP, a symmetrical N×N array called recurrence matrix R is computed as follows:
, where N is the number of intended states , Θ(x) is the Heaviside function (i.e. Θ(x)=0 if x< and Θ(x)=1 otherwise), is the threshold distance, and ‖∙‖ is a norm. Thus recurrence matrix is a matrix consisting of 1s and 0s. To calculate recurrence matrix, a suitable norm has to be selected. In this paper, we used Euclidean norm for calculating the distance between two states. RP of each dynamical system has its own topology. For example, RP related to periodic systems has uncut and long diagonal lines.
The vertical distance between these diagonal lines indicates the period of the fluctuations. The RP of chaotic system also has diagonal lines, which are shorter than periodic systems with certain vertical distances. But, vertical distances in chaotic systems are not as regular as in the periodic systems. The RP of the uncorrelated stochastic signal consists of many single black points.
The vertical distance between these diagonal lines indicates the period of the fluctuations. The RP of chaotic system also has diagonal lines, which are shorter than periodic systems with certain vertical distances. But, vertical distances in chaotic systems are not as regular as in the periodic systems. The RP of the uncorrelated stochastic signal consists of many single black points.
2.1.3. Recurrence quantification analysis
To quantify the structures in RPs, several measures of complexity have been proposed. These measures are known as Recurrence Quantification Analysis (RQA) (Marwan et al., 2007) and are based on the recurrence point density, the diagonal and vertical line structures, recurrence time, and recurrence network.
2.1.3.1. Recurrence point density measure
The measure RR describes the probability that a state recurs to its ε-neighborhood in phase space.
2.1.3.2. Diagonal line measures
These measures are calculated from the histogram P(ε,l) of diagonal lines with a length of l. The RP of stochastic systems has none or short diagonal lines structure and more single points, while deterministic systems are characterized by longer diagonal lines and less single isolated recurrence points.
The Determinism (DET) or predictability of a system can be measured by the ratio of recurrence points that form diagonal structures (of at least length lmin) to all recurrence points:
, where lmin is the least length and P(l) is the frequency distribution of the length l of the diagonal structures in the RP. In this paper, we selected lmin=2. Diagonal line length (L) shows that a segment of the trajectory is partly close during l time step to another segment of the trajectory at a different time. These diagonal lines indicate the divergence of the trajectory segments. The average time that two segments of the trajectory are close to each other can be measured by the mean diagonal line length, and can be considered as the mean prediction time (Marwan et al., 2007):
The main diagonal is not considered for calculation. Maximal diagonal line length (Lmax) is the length of the longest diagonal line in the RP that is parallel to the main diagonal (Marwan et al., 2007). The main diagonal line is not considered for calculation of Lmax. The exponential divergence of the phase space trajectory is measured by Lmax. The shorter diagonal lines indicate faster trajectory divergence.
Entropy of the diagonal line lengths (ENTR) is calculated as follows:
Entropy of the diagonal line lengths (ENTR) is calculated as follows:
, where p(l) is the probability that a diagonal line has exactly the length l. Complexity in the RP can be measured by ENTR. The small value of ENTR indicates strong regularity and less complexity and the large value indicates significant fluctuations.
2.1.3.3. Vertical line measures
The chaos-chaos, order-chaos, and chaos-order transitions can be found by vertical line measures (Marwan, Wessel, Meyerfeldt, Schirdewan, & Kurths, 2002). Hence, these measures are appropriate for investigating the intermittency and short and non-stationary data series. The ratio of the recurrence points forming the vertical structures to the entire set of recurrence points is defined as the Laminarity (LAM) as follows:
, which describes the mean time that the system remains in a state.
Maximal vertical line length (Vmax) is the length of the longest vertical line in the RP:
Maximal vertical line length (Vmax) is the length of the longest vertical line in the RP:
, where Nv is the total number of vertical lines in RP.
2.1.3.4. Recurrence time-based measures
Three RQA measures based on recurrence time statistics have been proposed for detecting the transitional signals in noisy and nonstationary environments (Gao, Cao, Gu, Harris, & Principe, 2003). These measures are called the first type T1 and the second type T2 of recurrence time and Recurrence Period Density Entropy (RPDE).To define the second type of recurrence time, consider a scalar time series {u(i), i=1,2,…} and corresponding reconstructed trajectory in m-dimensional phase space as xt=(ut,ut+τ,…, ut+(m-1)τ). An arbitrary reference point (x0) on the reconstructed trajectory is selected, then a neighborhood of radius r for reference point Br(x0)={x:‖x-x0 ‖≤r} is defined. The set of points consisting of the first trajectory point getting inside the neighborhood from outside are defined as recurrence points of the second type (Figure 2).
The trajectories that remain inside the neighborhood for a while, produce a sequence of points that are called the sojourn points (white circle in Figure 2). The set of the recurrence points of the second type as well as the sojourn points constitute the recurrence points of the first type. If the recurrence points are defined as S={xt1,xt2,…,xti,…}, then the corresponding recurrence time T is
Recurrence Period Density Entropy (RPDE) is a measure that can describe the complexity of a signal and determine the periodicity of a signal (Mukherjee et al., 2015). A system with periodic behavior has a RPDE with a value close to 0, whereas a system with chaotic behavior has RPDE a close to 1 (Nair & Kiasaleh, 2014). The RPDE can be computed as follows:
, where Tmax and P(t) are the largest recurrence value and the recurrence period density function, respectively.
2.1.3.5. Recurrence network analysis based measure
Recurrence Network Analysis (RNA) measure is the so-called network transitivity (Trans) and is based on the adjacency matrix A elements (Webber & Marwan, 2015), defined as:
2.1.3.5. Recurrence network analysis based measure
Recurrence Network Analysis (RNA) measure is the so-called network transitivity (Trans) and is based on the adjacency matrix A elements (Webber & Marwan, 2015), defined as:
, where A=R-I. Trans reflects network complexity and distinguishes between regular and irregular dynamics.
2.2. Feature selection based on mutual information
The relevance between two variables can be measured by MI. A formalism for quantifying MI is Shannon’s information theory. Assume X is a random variable that represents continuous-valued random feature vector, and C is a discrete-valued random variable that represents the class labels, the MI between two variables X and C are calculated as follows:
, where p(c, x) is the joint probability density function of x and c, and p(c) are the marginal probability density functions of x and c, respectively. A large value of the MI between two random variables indicates that two variables are closely related. If two random variables are strictly independent, the MI is 0. In terms of MI, the optimal feature selection requires selecting a feature set f with m features, which jointly have the largest dependency on the target class C (i.e. maximal dependency). That is, we seek:
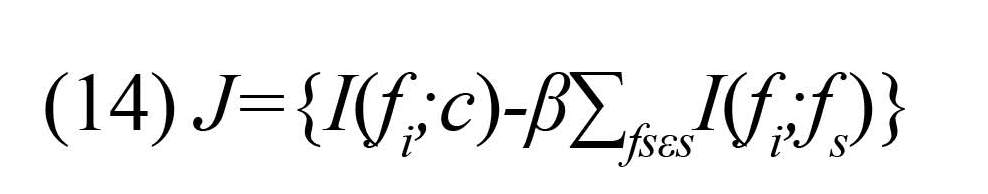
However, it requires an accurate estimation of the underlying Probability Density Functions (pdfs) of the data and the integration on these pdfs. Moreover, due to the tremendous computational requirements of the method, the practical applicability of the above solution to the problems requiring a large number of features is limited. To overcome this problem, a heuristic method proposed by Peng et al. (2005), which is based on minimal-Redundancy-Maximal-Relevance (mRMR) framework. It was proven that mRMR criterion is equivalent to maximal dependency (13) if one feature is added at one time (Peng et al., 2005). This criterion is given by:
According to this criterion, Term I(fi;c) indicates dependency between a new feature Fi and the target class that should be maximized (i.e. maxiI(fi;c) and the term ∑fsεSI(fi;fs ) indicates the dependency of the new feature with the already selected features. This term should be minimized (i.e. mini∑fsεSI(fi;fs ). The parameter ß is the redundancy parameter, which regulates the relative importance of the MI between the new feature and the already selected features with respect to the MI with the output class.
2.3. Classification of EEG features
Each EEG segment was split into 16 blocks of 1.475 s duration. Original features were formed from each block. Thus, 1600 feature vectors were constructed from each EEG subset. Then, the MI-based feature selection process was carried out to select optimal feature vector. For classification of the selected features, a two-layer feed-forward neural network was employed to perform the classification. The scaled conjugate gradient algorithm was used to train the network using the selected feature vectors. The number of neurons in the hidden layer was 20 and the output layer was equal to the number of classes. Repeated random subsampling for evaluation, whereas during each repeat, 60%, 5%, and 35% of the feature vectors are randomly selected for training, validation, and testing, respectively. The evaluation procedure was repeated 20 times and the mean and standard deviation were calculated. Classifications were executed using MATLAB.
For the EEG dataset described in Section 2, five different cases of classification were considered. The cases were selected due to their clinical relevance and wide usage by the researchers (Alam & Bhuiyan, 2013; Riaz et al., 2016). In Case I, the sets A and B were grouped as healthy class, the sets C and D were grouped as interictal class, and the set E was recognized as ictal class. In Case II, the sets A, D, and E were considered as healthy, interictal, and ictal classes, respectively. In Case III, the sets A and E were classified as healthy and interictal, ictal classes, respectively. In Case IV, the sets A, B, C, and D were grouped as nonseizure class and the set E as seizure class. In case V, the first class consisted of the set D as interictal class and the second class included the set E as ictal class.
3. Results
3.1. RP of the EEG signals
Figure 3 shows examples of RP of the EEG recordings corresponding to healthy (A and B), interictal (C and D), and ictal (E) conditions. It is observed that there are vertical and horizontal line structures in the RP of the healthy subject (Figure 3a and 3b). The rectangles formed by the vertical and horizontal lines indicate that the system trapped in a state and does not change or changes very slowly for some time. The vertical structures in the RP of EEG indicate intermittency and laminar. Interesting observation is the white band structures during seizure-free (Figure 3c and 3d). White area or bands corresponds to sudden changes in the dynamic as well as extreme events (Webber & Marwan, 2015). During a seizure, diagonal lines and checkerboard structures are observed in RP (Figure 3e and 3f). These structures indicate the system with periodic or quasi-periodic behavior (Webber & Marwan, 2015). The results demonstrate that the RP can visualize the dynamic changes of the EEG signals during different brain states.
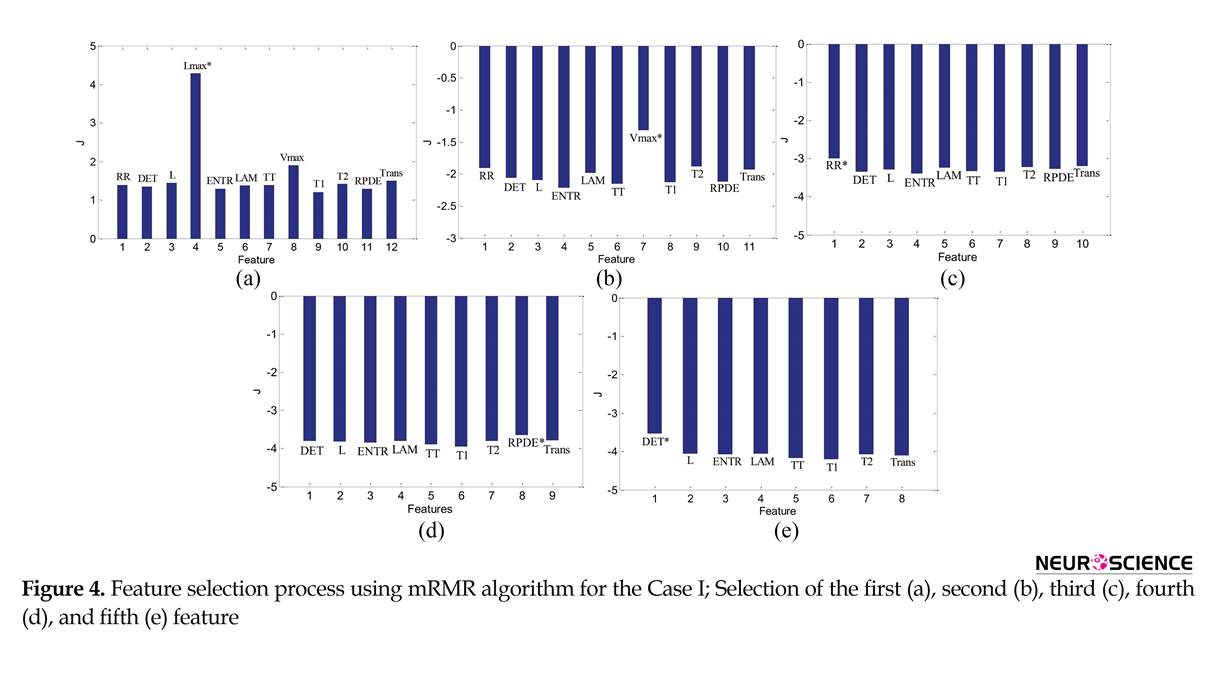
3.2. Mutual information-based feature selection
Figure 4 shows the results of feature selection using mRMR for the Case I. It is observed that Lmax is the first relevant feature that is selected (Figure 4a). According to mRMR criterion, the feature that has maximum MI with the class labels is selected as the first relevant feature. As already mentioned, Lmax is a RQA measure based on the diagonal lines structures and indicates repeating recurrences within a state. The diagonal lines are long for periodic signals and short for chaotic signals (Webber & Marwan, 2015). The second, third, fourth, and fifth selected features are Vmax, RR, RPDE, and DET, respectively (Figure 4b and 4e).
Table 1 summarizes the results of feature selection using mRMR for different cases of classification. It is observed that in all cases, Lmax is the first feature that is selected. Moreover, Vmax is also selected in all cases.
2.3. Classification of EEG features
Each EEG segment was split into 16 blocks of 1.475 s duration. Original features were formed from each block. Thus, 1600 feature vectors were constructed from each EEG subset. Then, the MI-based feature selection process was carried out to select optimal feature vector. For classification of the selected features, a two-layer feed-forward neural network was employed to perform the classification. The scaled conjugate gradient algorithm was used to train the network using the selected feature vectors. The number of neurons in the hidden layer was 20 and the output layer was equal to the number of classes. Repeated random subsampling for evaluation, whereas during each repeat, 60%, 5%, and 35% of the feature vectors are randomly selected for training, validation, and testing, respectively. The evaluation procedure was repeated 20 times and the mean and standard deviation were calculated. Classifications were executed using MATLAB.
For the EEG dataset described in Section 2, five different cases of classification were considered. The cases were selected due to their clinical relevance and wide usage by the researchers (Alam & Bhuiyan, 2013; Riaz et al., 2016). In Case I, the sets A and B were grouped as healthy class, the sets C and D were grouped as interictal class, and the set E was recognized as ictal class. In Case II, the sets A, D, and E were considered as healthy, interictal, and ictal classes, respectively. In Case III, the sets A and E were classified as healthy and interictal, ictal classes, respectively. In Case IV, the sets A, B, C, and D were grouped as nonseizure class and the set E as seizure class. In case V, the first class consisted of the set D as interictal class and the second class included the set E as ictal class.
3. Results
3.1. RP of the EEG signals
Figure 3 shows examples of RP of the EEG recordings corresponding to healthy (A and B), interictal (C and D), and ictal (E) conditions. It is observed that there are vertical and horizontal line structures in the RP of the healthy subject (Figure 3a and 3b). The rectangles formed by the vertical and horizontal lines indicate that the system trapped in a state and does not change or changes very slowly for some time. The vertical structures in the RP of EEG indicate intermittency and laminar. Interesting observation is the white band structures during seizure-free (Figure 3c and 3d). White area or bands corresponds to sudden changes in the dynamic as well as extreme events (Webber & Marwan, 2015). During a seizure, diagonal lines and checkerboard structures are observed in RP (Figure 3e and 3f). These structures indicate the system with periodic or quasi-periodic behavior (Webber & Marwan, 2015). The results demonstrate that the RP can visualize the dynamic changes of the EEG signals during different brain states.
3.2. Mutual information-based feature selection
Figure 4 shows the results of feature selection using mRMR for the Case I. It is observed that Lmax is the first relevant feature that is selected (Figure 4a). According to mRMR criterion, the feature that has maximum MI with the class labels is selected as the first relevant feature. As already mentioned, Lmax is a RQA measure based on the diagonal lines structures and indicates repeating recurrences within a state. The diagonal lines are long for periodic signals and short for chaotic signals (Webber & Marwan, 2015). The second, third, fourth, and fifth selected features are Vmax, RR, RPDE, and DET, respectively (Figure 4b and 4e).
Table 1 summarizes the results of feature selection using mRMR for different cases of classification. It is observed that in all cases, Lmax is the first feature that is selected. Moreover, Vmax is also selected in all cases.
3.3. Classification
The classification accuracy for different RQA-based features is shown in Figure 5. It is observed that Lmax and Trans features provide a high classification accuracy for the Cases III, IV, and V with respect to the cases I and II. This is because the EEG data grouped into two classes in the Cases III, IV, and V while the classification Cases of I and II have three classes. Moreover, diagonal structures within the RP reflect the system with periodic and quasi-periodic behavior and the Trans feature can distinguish regular from irregular dynamics. The L could discriminate accurately Case III which contains only healthy and ictal classes.
The average overall detection accuracy, using selected features by mRMR algorithm and the feature vectors used in (Niknazar et al., 2013) is presented in Table 2. The results show that the average detection accuracy is 100% using only five selected features for all cases. In Niknazar et al. (2013), RQA was applied on the EEG recordings provided by Dr. R. Andrzejak as in the current study. The RQA-based features (i.e. DET, L, Lmax, ENTR, LAM, TT) of the original signal and subbands (i.e. delta, theta, alpha, beta, and gamma) were used for classification. The overall accuracy was 89.50% and 98.67% using the RQA-based features of the original signal (i.e. 6 features) and a combination of the original signal and subbands (i.e. 36 features), respectively.
The classification accuracies obtained in this study and in the previous studies are summarized in Table 3. Only the previous studies that used the data set provided by Dr R. Andrzejak were considered for comparison to provide a fair comparison.
4. Discussion
There is significant interest in developing accurate automatic seizure detection. The classification of EEG into healthy, ictal, and interictal EEGs is the main goal of seizure detection. Two major components of a clas
sification process are the feature extraction and feature selection. Different linear approaches have been proposed for time series analysis of EEG signal and extraction features. However, the linear approaches ignore the underlying nonlinear EEG dynamics. The complex nonlinear EEG dynamics show different transitions between regular, laminar, and chaotic behaviors.
The knowledge of these transitions is necessary for characterizing the underlying dynamics. A very useful nonlinear approach for measuring the complexity of a nonlinear dynamical system is RQA. Up to now, different RQA measures, including RR, DET, L, Lmax, ENTR, LAM, TT, and Trend have been used as the features of the EEG signal for seizure detection. In the current study, different RQA measures, including Vmax, T1, T2,
The knowledge of these transitions is necessary for characterizing the underlying dynamics. A very useful nonlinear approach for measuring the complexity of a nonlinear dynamical system is RQA. Up to now, different RQA measures, including RR, DET, L, Lmax, ENTR, LAM, TT, and Trend have been used as the features of the EEG signal for seizure detection. In the current study, different RQA measures, including Vmax, T1, T2,
RPDE Trans and have been introduced as the features for the EEG classification. These measures are very important for detecting the dynamic transitions and measuring the complexity.
Moreover, a systematic approach based on MI has been proposed to select the most relevant features. The first selected feature in all cases was Lmax. Deterministic processes have longer diagonals and less single, isolated recurrence points, whereas chaotic signals cause the short diagonal lines. The diagonal lines for periodic signals are long and for stochastic signals are absent (Webber & Marwan, 2015).
During the interictal state, the EEG signals have lower amplitude and are less rhythmic and more irregular in morphology. During ictal state, an abrupt change in the amplitude, frequency, and morphology of the EEG signals occurs, and rhythmicity increases and a synchronization of activity happens across widespread areas of the cerebral cortex. Therefore, diagonal lines can provide a suitable measure for prediction of rhythmic and periodic EEG patterns. As it can be seen in Figure 3e and 3f, the RP of the brain signals during ictal state has the checkerboard structures indicating periodic behavior whereas such structures have not been observed during healthy and interictal states.
The second selected feature is Vmax, which indicates the vertical line structure in the RP. RP of the healthy signal (Figure 3a and 3b) contains vertical and horizontal lines that form rectangles. This structure indicates that some states do not change or change slowly for some time (laminar states) or the process is halted at a singularity in which the dynamic is stuck in paused states.
Another selected feature is DET, which is a measure of determinism. In the seizure state, excessive synchronization of large neuronal populations occurs, leading to a hypersynchronous state which implies an increasing determinism of EEG data. Therefore, DET can be a suitable measure for seizure detection. Trans and RPDE are other complexity measures which were selected as the features.
The results of this study show that a robust accurate seizure detection with a short period of time (1.475 s) can be obtained using the proposed method. The method could distinguish healthy, ictal, and interictal states with 100% accuracy.
Ethical Considerations
Compliance with ethical guidelines
There is no ethical principle to be considered doing this research.
Funding
This work was financially supported by the Iran University of Science and Technology, Tehran, Iran (Grant No. 48.M.111194).
Conflict of interest
The authors declared no conflict of interest.
References
- Adeli, H., Ghosh-Dastidar, S., & Dadmehr, N. (2007). A wavelet-chaos methodology for analysis of EEGs and EEG subbands to detect seizure and epilepsy. IEEE Transactions on Biomedical Engineering, 54(2), 205-11. [DOI:10.1109/TBME.2006.886855] [PMID]
- Alam, S. S., & Bhuiyan, M. I. H. (2013). Detection of seizure and epilepsy using higher order statistics in the EMD domain. IEEE Journal of Biomedical and Health Informatics, 17(2), 312-8. [DOI:10.1109/JBHI.2012.2237409] [PMID]
- Andrzejak, R. G., Lehnertz, K., Mormann, F., Rieke, C., David, P., & Elger, C. E. (2001). Indications of nonlinear deterministic and finite-dimensional structures in time series of brain electrical activity: Dependence on recording region and brain state. Physical Review E, 64(6). [DOI:10.1103/physreve.64.061907]
- Bajaj, V., & Pachori, R. B. (2012). Classification of seizure and nonseizure EEG signals using empirical mode decomposition. IEEE Transactions on Information Technology in Biomedicine, 16(6), 1135-42. [DOI:10.1109/TITB.2011.2181403] [PMID]
- Cao, L. (1997). Practical method for determining the minimum embedding dimension of a scalar time series. Physica D: Nonlinear Phenomena, 110(1-2), 43-50. [DOI:10.1016/S0167-2789(97)00118-8]
- Cerf, R., Amri, M. E., Ouasdad, E. H., & Hirsch, E. (1999). Non-linear analysis of epileptic seizures I. Correlation-dimension measurements for absence epilepsy and near-periodic signals. Biological Cybernetics, 80(4), 247-58. [DOI:10.1007/s004220050522] [PMID]
- Chen, T. J., Chiueh, H., Liang, S. F., Chang, S. T., Jeng, C., Hsu, Y. C., et al. (2011). The implementation of a low-power biomedical signal processor for real-time epileptic seizure detection on absence animal models. IEEE Journal on Emerging and Selected Topics in Circuits and Systems, 1(4), 613-21. [DOI:10.1109/JETCAS.2011.2174472]
- D’Alessandro, M., Esteller, R., Vachtsevanos, G., Hinson, A., Echauz, J., & Litt, B. (2003). Epileptic seizure prediction using hybrid feature selection over multiple intracranial EEG electrode contacts: A report of four patients. IEEE Transactions on Biomedical Engineering, 50(5), 603-15. [DOI:10.1109/TBME.2003.810706] [PMID]
- Easwaramoorthy, D., & Uthayakumar, R. (2011). Improved generalized fractal dimensions in the discrimination between healthy and epileptic EEG signals. Journal of Computational Science, 2(1), 31-8. [DOI:10.1016/j.jocs.2011.01.001]
- Eckmann, J. P., Kamphorst, S. O., & Ruelle, D. (1987). Recurrence Plots of Dynamical Systems. Europhysics Letters, 4(9), 973–7. [DOI:10.1209/0295-5075/4/9/004]
- Fraser, A. M., & Swinney, H. L. (1986). Independent coordinates for strange attractors from mutual information. Physical Review A, 33(2), 1134-40. [DOI:10.1103/PhysRevA.33.1134]
- Gao, J. B., Cao, Y., Gu, L., Harris, J. G., & Principe, J. C. (2003). Detection of weak transitions in signal dynamics using recurrence time statistics. Physics Letters A, 317(1), 64-72. [DOI:10.1016/j.physleta.2003.08.018]
- Ghosh-Dastidar, S., Adeli, H., & Dadmehr, N. (2007). Mixed-band wavelet-chaos-neural network methodology for epilepsy and epileptic seizure detection. IEEE Transactions on Biomedical Engineering, 54(9), 1545-51. [DOI:10.1109/TBME.2007.891945] [PMID]
- Ghosh-Dastidar, S., Adeli, H., & Dadmehr, N. (2008). Principal component analysis-enhanced cosine radial basis function neural network for robust epilepsy and seizure detection. IEEE Transactions on Biomedical Engineering, 55(2), 512-8. [DOI:10.1109/TBME.2007.905490] [PMID]
- Güler, N. F., Übeyli, E. D., & Güler, I. (2005). Recurrent neural networks employing Lyapunov exponents for EEG signals classification. Expert Systems with Applications, 29(3), 506-14. [DOI:10.1016/j.eswa.2005.04.011]
- Guo, L., Rivero, D., Dorado, J., Munteanu, C. R., & Pazos, A. (2011). Automatic feature extraction using genetic programming: An application to epileptic EEG classification. Expert Systems with Applications, 38(8), 10425-36. [DOI:10.1016/j.eswa.2011.02.118]
- Guo, L., Rivero, D., Dorado, J., Rabunal, J. R., & Pazos, A. (2010). Automatic epileptic seizure detection in EEGs based on line length feature and artificial neural networks. Journal of Neuroscience Methods, 191(1), 101-9. [DOI:10.1016/j.jneumeth.2010.05.020] [PMID]
- Iasemidis, L. D., Shiau, D. S., Chaovalitwongse, W., Sackellares, J. C., Pardalos, P. M., Principe, J. C., et al. (2003). Adaptive epileptic seizure prediction system. IEEE Transactions on Biomedical Engineering, 50(5), 616-27. [DOI:10.1109/TBME.2003.810689] [PMID]
- Iscan, Z., Dokur, Z., & Demiralp, T. (2011). Classification of electroencephalogram signals with combined time and frequency features. Expert Systems with Applications, 38(8), 10499-505. [DOI:10.1016/j.eswa.2011.02.110]
- Kumar, Y., Dewal, M. L., & Anand, R. S. (2014). Epileptic seizure detection using DWT based fuzzy approximate entropy and support vector machine. Neurocomputing, 133, 271-9. [DOI:10.1016/j.neucom.2013.11.009]
- Kwak, N., & Choi, C. H. (2002). Input feature selection for classification problems. IEEE Transactions on Neural Networks, 13(1), 143-59. [DOI:10.1109/72.977291] [PMID]
- Li, X., Ouyang, G., Yao, X., & Guan, X. (2004). Dynamical characteristics of pre-epileptic seizures in rats with recurrence quantification analysis. Physics Letters A, 333(1), 164-71. [DOI:10.1016/j.physleta.2004.10.028]
- Marwan, N., Romano, M. C., Thiel, M., & Kurths, J. (2007). Recurrence plots for the analysis of complex systems. Physics Reports, 438(5), 237-329. [DOI:10.1016/j.physrep.2006.11.001]
- Marwan, N., Wessel, N., Meyerfeldt, U., Schirdewan, A., & Kurths, J. (2002). Recurrence-plot-based measures of complexity and their application to heart-rate-variability data. Physical Review E, 66(2), 026702. [DOI:10.1103/PhysRevE.66.026702] [PMID]
- Mukherjee, S., Palit, S. K., Banerjee, S., Ariffin, M. R. K., Rondoni, L., & Bhattacharya, D. K. (2015). Can complexity decrease in congestive heart failure?. Physica A: Statistical Mechanics and its Applications, 439, 93-102. [DOI:10.1016/j.physa.2015.07.030]
- Naghsh-Nilchi, A. R., & Aghashahi, M. (2010). Epilepsy seizure detection using eigen-system spectral estimation and Multiple Layer Perceptron neural network. Biomedical Signal Processing and Control, 5(2), 147-57. [DOI:10.1016/j.bspc.2010.01.004]
- Nair, A., & Kiasaleh, K. (2014). Function mapped trajectory estimation for ECG sets. Biomedical Engineering Letters, 4(3), 277-84. [DOI:10.1007/s13534-014-0145-z]
- Niknazar, M., Mousavi, S. R., Motaghi, S., Dehghani, A., Vahdat, B. V., Shamsollahi, M. B., et al. (2013). A unified approach for detection of induced epileptic seizures in rats using ECoG signals. Epilepsy & Behavior, 27(2), 355-64. [DOI:10.1016/j.yebeh.2013.01.028] [PMID]
- Niknazar, M., Mousavi, S. R., Vahdat, B. V., & Sayyah, M. (2013). A new framework based on recurrence quantification analysis for epileptic seizure detection. IEEE Journal of BioMedical and Health Informatics, 17(3), 572-8. [DOI:10.1109/JBHI.2013.2255132] [PMID]
- Orhan, U., Hekim, M., & Ozer, M. (2011). EEG signals classification using the K-means clustering and a multilayer perceptron neural network model. Expert Systems with Applications, 38(10), 13475-81. [DOI:10.1016/j.eswa.2011.04.149]
- Osorio, I., Zaveri, H. P., Frei, M. G., & Arthurs, S. (2016). Epilepsy: The intersection of neurosciences, biology, mathematics, engineering, and physics. Boca Raton, Florida: CRC Press.
- Ouyang, G., Li, X., Dang, C., & Richards, D. A. (2008). Using recurrence plot for determinism analysis of EEG recordings in genetic absence epilepsy rats. Clinical Neurophysiology, 119(8), 1747-55. [DOI:10.1016/j.clinph.2008.04.005] [PMID]
- Oweis, R. J., & Abdulhay, E. W. (2011). Seizure classification in EEG signals utilizing Hilbert-Huang transform. Biomedical Engineering Online, 10(1), 38. [DOI:10.1186/1475-925X-10-38] [PMID] [PMCID]
- Pachori, R. B. (2008). Discrimination between ictal and seizure-free EEG signals using empirical mode decomposition. Research Letters in Signal Processing, 2008, Article ID: 293056. [DOI:10.1155/2008/293056]
- Pachori, R. B., & Bajaj, V. (2011). Analysis of normal and epileptic seizure EEG signals using empirical mode decomposition. Computer Methods and Programs in Biomedicine, 104(3), 373-81. [DOI:10.1016/j.cmpb.2011.03.009] [PMID]
- Page, A., Sagedy, C., Smith, E., Attaran, N., Oates, T., & Mohsenin, T. (2015). A flexible multichannel EEG feature extractor and classifier for seizure detection. IEEE Transactions on Circuits and Systems II: Express Briefs, 62(2), 109-13. [DOI:10.1109/TCSII.2014.2385211]
- Peker, M., Sen, B., & Delen, D. (2016). A novel method for automated diagnosis of epilepsy using complex-valued classifiers. IEEE Journal of Biomedical and Health Informatics, 20(1), 108-18. [DOI:10.1109/JBHI.2014.2387795] [PMID]
- Peng, H., Long, F., & Ding, C. (2005). Feature selection based on mutual information criteria of max-dependency, max-relevance, and min-redundancy. IEEE Transactions on Pattern Analysis and Machine Intelligence, 27(8), 1226-38. [DOI:10.1109/TPAMI.2005.159] [PMID]
- Ramgopal, S., Thome-Souza, S., Jackson, M., Kadish, N. E., Fernández, I. S., Klehm, J., et al. (2014). Seizure detection, seizure prediction, and closed-loop warning systems in epilepsy. Epilepsy & Behavior, 37, 291-307. [DOI:10.1016/j.yebeh.2014.06.023] [PMID]
- Riaz, F., Hassan, A., Rehman, S., Niazi, I. K., & Dremstrup, K. (2016). EMD-based temporal and spectral features for the classification of EEG signals using supervised learning. IEEE Transactions on Neural Systems and Rehabilitation Engineering, 24(1), 28-35. [DOI:10.1109/TNSRE.2015.2441835] [PMID]
- Shafiul Alam, S. M., & Bhuiyan, M. I. H. (2013). Detection of seizure and epilepsy using higher order statistics in the EMD domain. IEEE Journal of Biomedical and Health Informaticas, 17(2), 313-8. [DOI:10.1109/JBHI.2012.2237409.] [PMID]
- Srinivasan, V., Eswaran, C., & Sriraam, N. (2007). Approximate entropy-based epileptic EEG detection using artificial neural networks. IEEE Transactions on Information Technology in Biomedicine, 11(3), 288-95. [DOI:10.1109/TITB.2006.884369] [PMID]
- Subasi, A. (2007). EEG signal classification using wavelet feature extraction and a mixture of expert model. Expert Systems with Applications, 32(4), 1084-93. [DOI:10.1016/j.eswa.2006.02.005]
- Subasi, A., & Gursoy, M. I. (2010). EEG signal classification using PCA, ICA, LDA and support vector machines. Expert Systems with Applications, 37(12), 8659-66. [DOI:10.1016/j.eswa.2010.06.065]
- Temko, A., Nadeu, C., Marnane, W., Boylan, G., & Lightbody, G. (2011). EEG signal description with spectral-envelope-based speech recognition features for detection of neonatal seizures. IEEE Transactions on Information Technology in Biomedicine, 15(6), 839-47. [DOI:10.1109/TITB.2011.2159805] [PMID] [PMCID]
- Thomas, E. M., Temko, A., Marnane, W. P., Boylan, G. B., & Lightbody, G. (2013). Discriminative and generative classification techniques applied to automated neonatal seizure detection. IEEE Journal of Biomedical and Health Informatics, 17(2), 297-304. [DOI:10.1109/JBHI.2012.2237035] [PMID]
- Thomasson, N., Hoeppner, T. J., Webber, C. L., & Zbilut, J. P. (2001). Recurrence quantification in epileptic EEGs. Physics Letters A, 279(1), 94-101. [DOI:10.1016/S0375-9601(00)00815-X]
- Tzallas, A. T., Tsipouras, M. G., & Fotiadis, D. I. (2009). Epileptic seizure detection in EEGs using time–frequency analysis. IEEE Transactions on Information Technology in Biomedicine, 13(5), 703-10. [DOI:10.1109/TITB.2009.2017939] [PMID]
- Übeyli, E. D. (2009). Statistics over features: EEG signals analysis. Computers in Biology and Medicine, 39(8), 733-41. [DOI:10.1016/j.compbiomed.2009.06.001] [PMID]
- Van Drongelen, W., Nayak, S., Frim, D. M., Kohrman, M. H., Towle, V. L., Lee, H. C., et al. (2003). Seizure anticipation in pediatric epilepsy: Use of Kolmogorov entropy. Pediatric Neurology, 29(3), 207-13. [DOI:10.1016/S0887-8994(03)00145-0]
- Wang, D., Miao, D., & Xie, C. (2011). Best basis-based wavelet packet entropy feature extraction and hierarchical EEG classification for epileptic detection. Expert Systems with Applications, 38(11), 14314-20. [DOI:10.1016/j.eswa.2011.05.096]
- Wang, N., & Lyu, M. R. (2015). Extracting and selecting distinctive EEG features for efficient epileptic seizure prediction. IEEE Journal of Biomedical and Health Informatics, 19(5), 1648-59. [DOI:10.1109/JBHI.2014.2358640] [PMID]
- Webber, C. L., & Marwan, N. (2015). Recurrence quantification analysis. Berlin: Springer. [DOI:10.1007/978-3-319-07155-8]
- Wlodarczyk, B. J., Palacios, A. M., George, T. M., & Finnell, R. H. (2012). Antiepileptic drugs and pregnancy outcomes. American Journal of Medical Genetics Part A, 158(8), 2071-90. [DOI:10.1002/ajmg.a.35438] [PMID] [PMCID]
- Yang, C., Jeannès, R. L. B., Bellanger, J. J., & Shu, H. (2013). A new strategy for model order identification and its application to transfer entropy for EEG signals analysis. IEEE Transactions on Biomedical Engineering, 60(5), 1318-27. [DOI:10.1109/TBME.2012.2234125] [PMID]
- Yaylali, I., Koçak, H., & Jayakar, P. (1996). Detection of seizures from small samples using nonlinear dynamic system theory. IEEE Transactions on Biomedical Engineering, 43(7), 743-51. [DOI:10.1109/10.503182] [PMID]
- Zabihi, M., Kiranyaz, S., Bahrami Rad, A., Katsaggelos, A. K., Gabbouj, M., & Ince, T. (2016). Analysis of high-dimensional phase space via Poincaré section for patient-specific seizure detection. IEEE Transactions on Neural Systems and Rehabilitation Engineering, 24(3), 386-98. [DOI:10.1109/TNSRE.2015.2505238] [PMID]
- Zhang, Z., & Parhi, K. K. (2016). Low-complexity seizure prediction from iEEG/sEEG using spectral power and ratios of spectral power. IEEE Transactions on Biomedical Circuits and Systems, 10(3), 693-706. [DOI:10.1109/TBCAS.2015.2477264] [PMID]
- Zhou, W., Liu, Y., Yuan, Q., & Li, X. (2013). Epileptic seizure detection using lacunarity and Bayesian linear discriminant analysis in intracranial EEG. IEEE Transactions on Biomedical Engineering, 60(12), 3375-81. [DOI:10.1109/TBME.2013.2254486] [PMID]
Type of Study: Original |
Subject:
Computational Neuroscience
Received: 2017/03/3 | Accepted: 2017/10/4 | Published: 2018/07/1
Received: 2017/03/3 | Accepted: 2017/10/4 | Published: 2018/07/1
References
1. Adeli, H., Ghosh-Dastidar, S., & Dadmehr, N. (2007). A wavelet-chaos methodology for analysis of EEGs and EEG subbands to detect seizure and epilepsy. IEEE Transactions on Biomedical Engineering, 54(2), 205-11. [DOI:10.1109/TBME.2006.886855] [PMID] [DOI:10.1109/TBME.2006.886855]
2. Alam, S. S., & Bhuiyan, M. I. H. (2013). Detection of seizure and epilepsy using higher order statistics in the EMD domain. IEEE Journal of Biomedical and Health Informatics, 17(2), 312-8. [DOI:10.1109/JBHI.2012.2237409] [PMID] [DOI:10.1109/JBHI.2012.2237409]
3. Andrzejak, R. G., Lehnertz, K., Mormann, F., Rieke, C., David, P., & Elger, C. E. (2001). Indications of nonlinear deterministic and finite-dimensional structures in time series of brain electrical activity: Dependence on recording region and brain state. Physical Review E, 64(6). [DOI:10.1103/physreve.64.061907] [DOI:10.1103/PhysRevE.64.061907]
4. Bajaj, V., & Pachori, R. B. (2012). Classification of seizure and nonseizure EEG signals using empirical mode decomposition. IEEE Transactions on Information Technology in Biomedicine, 16(6), 1135-42. [DOI:10.1109/TITB.2011.2181403] [PMID] [DOI:10.1109/TITB.2011.2181403]
5. Cao, L. (1997). Practical method for determining the minimum embedding dimension of a scalar time series. Physica D: Nonlinear Phenomena, 110(1-2), 43-50. [DOI:10.1016/S0167-2789(97)00118-8] [DOI:10.1016/S0167-2789(97)00118-8]
6. Cerf, R., Amri, M. E., Ouasdad, E. H., & Hirsch, E. (1999). Non-linear analysis of epileptic seizures I. Correlation-dimension measurements for absence epilepsy and near-periodic signals. Biological Cybernetics, 80(4), 247-58. [DOI:10.1007/s004220050522] [PMID] [DOI:10.1007/s004220050522]
7. Chen, T. J., Chiueh, H., Liang, S. F., Chang, S. T., Jeng, C., Hsu, Y. C., et al. (2011). The implementation of a low-power biomedical signal processor for real-time epileptic seizure detection on absence animal models. IEEE Journal on Emerging and Selected Topics in Circuits and Systems, 1(4), 613-21. [DOI:10.1109/JETCAS.2011.2174472] [DOI:10.1109/JETCAS.2011.2174472]
8. D'Alessandro, M., Esteller, R., Vachtsevanos, G., Hinson, A., Echauz, J., & Litt, B. (2003). Epileptic seizure prediction using hybrid feature selection over multiple intracranial EEG electrode contacts: A report of four patients. IEEE Transactions on Biomedical Engineering, 50(5), 603-15. [DOI:10.1109/TBME.2003.810706] [PMID] [DOI:10.1109/TBME.2003.810706]
9. Easwaramoorthy, D., & Uthayakumar, R. (2011). Improved generalized fractal dimensions in the discrimination between healthy and epileptic EEG signals. Journal of Computational Science, 2(1), 31-8. [DOI:10.1016/j.jocs.2011.01.001] [DOI:10.1016/j.jocs.2011.01.001]
10. Eckmann, J. P., Kamphorst, S. O., & Ruelle, D. (1987). Recurrence Plots of Dynamical Systems. Europhysics Letters, 4(9), 973–7. [DOI:10.1209/0295-5075/4/9/004] [DOI:10.1209/0295-5075/4/9/004]
11. Fraser, A. M., & Swinney, H. L. (1986). Independent coordinates for strange attractors from mutual information. Physical Review A, 33(2), 1134-40. [DOI:10.1103/PhysRevA.33.1134] [DOI:10.1103/PhysRevA.33.1134]
12. Gao, J. B., Cao, Y., Gu, L., Harris, J. G., & Principe, J. C. (2003). Detection of weak transitions in signal dynamics using recurrence time statistics. Physics Letters A, 317(1), 64-72. [DOI:10.1016/j.physleta.2003.08.018] [DOI:10.1016/j.physleta.2003.08.018]
13. Ghosh-Dastidar, S., Adeli, H., & Dadmehr, N. (2007). Mixed-band wavelet-chaos-neural network methodology for epilepsy and epileptic seizure detection. IEEE Transactions on Biomedical Engineering, 54(9), 1545-51. [DOI:10.1109/TBME.2007.891945] [PMID] [DOI:10.1109/TBME.2007.891945]
14. Ghosh-Dastidar, S., Adeli, H., & Dadmehr, N. (2008). Principal component analysis-enhanced cosine radial basis function neural network for robust epilepsy and seizure detection. IEEE Transactions on Biomedical Engineering, 55(2), 512-8. [DOI:10.1109/TBME.2007.905490] [PMID] [DOI:10.1109/TBME.2007.905490]
15. Güler, N. F., Übeyli, E. D., & Güler, I. (2005). Recurrent neural networks employing Lyapunov exponents for EEG signals classification. Expert Systems with Applications, 29(3), 506-14. [DOI:10.1016/j.eswa.2005.04.011] [DOI:10.1016/j.eswa.2005.04.011]
16. Guo, L., Rivero, D., Dorado, J., Munteanu, C. R., & Pazos, A. (2011). Automatic feature extraction using genetic programming: An application to epileptic EEG classification. Expert Systems with Applications, 38(8), 10425-36. [DOI:10.1016/j.eswa.2011.02.118] [DOI:10.1016/j.eswa.2011.02.118]
17. Guo, L., Rivero, D., Dorado, J., Rabunal, J. R., & Pazos, A. (2010). Automatic epileptic seizure detection in EEGs based on line length feature and artificial neural networks. Journal of Neuroscience Methods, 191(1), 101-9. [DOI:10.1016/j.jneumeth.2010.05.020] [PMID] [DOI:10.1016/j.jneumeth.2010.05.020]
18. Iasemidis, L. D., Shiau, D. S., Chaovalitwongse, W., Sackellares, J. C., Pardalos, P. M., Principe, J. C., et al. (2003). Adaptive epileptic seizure prediction system. IEEE Transactions on Biomedical Engineering, 50(5), 616-27. [DOI:10.1109/TBME.2003.810689] [PMID] [DOI:10.1109/TBME.2003.810689]
19. Iscan, Z., Dokur, Z., & Demiralp, T. (2011). Classification of electroencephalogram signals with combined time and frequency features. Expert Systems with Applications, 38(8), 10499-505. [DOI:10.1016/j.eswa.2011.02.110] [DOI:10.1016/j.eswa.2011.02.110]
20. Kumar, Y., Dewal, M. L., & Anand, R. S. (2014). Epileptic seizure detection using DWT based fuzzy approximate entropy and support vector machine. Neurocomputing, 133, 271-9. [DOI:10.1016/j.neucom.2013.11.009] [DOI:10.1016/j.neucom.2013.11.009]
21. Kwak, N., & Choi, C. H. (2002). Input feature selection for classification problems. IEEE Transactions on Neural Networks, 13(1), 143-59. [DOI:10.1109/72.977291] [PMID] [DOI:10.1109/72.977291]
22. Li, X., Ouyang, G., Yao, X., & Guan, X. (2004). Dynamical characteristics of pre-epileptic seizures in rats with recurrence quantification analysis. Physics Letters A, 333(1), 164-71. [DOI:10.1016/j.physleta.2004.10.028] [DOI:10.1016/j.physleta.2004.10.028]
23. Marwan, N., Romano, M. C., Thiel, M., & Kurths, J. (2007). Recurrence plots for the analysis of complex systems. Physics Reports, 438(5), 237-329. [DOI:10.1016/j.physrep.2006.11.001] [DOI:10.1016/j.physrep.2006.11.001]
24. Marwan, N., Wessel, N., Meyerfeldt, U., Schirdewan, A., & Kurths, J. (2002). Recurrence-plot-based measures of complexity and their application to heart-rate-variability data. Physical Review E, 66(2), 026702. [DOI:10.1103/PhysRevE.66.026702] [PMID] [DOI:10.1103/PhysRevE.66.026702]
25. Mukherjee, S., Palit, S. K., Banerjee, S., Ariffin, M. R. K., Rondoni, L., & Bhattacharya, D. K. (2015). Can complexity decrease in congestive heart failure?. Physica A: Statistical Mechanics and its Applications, 439, 93-102. [DOI:10.1016/j.physa.2015.07.030] [DOI:10.1016/j.physa.2015.07.030]
26. Naghsh-Nilchi, A. R., & Aghashahi, M. (2010). Epilepsy seizure detection using eigen-system spectral estimation and Multiple Layer Perceptron neural network. Biomedical Signal Processing and Control, 5(2), 147-57. [DOI:10.1016/j.bspc.2010.01.004] [DOI:10.1016/j.bspc.2010.01.004]
27. Nair, A., & Kiasaleh, K. (2014). Function mapped trajectory estimation for ECG sets. Biomedical Engineering Letters, 4(3), 277-84. [DOI:10.1007/s13534-014-0145-z] [DOI:10.1007/s13534-014-0145-z]
28. Niknazar, M., Mousavi, S. R., Motaghi, S., Dehghani, A., Vahdat, B. V., Shamsollahi, M. B., et al. (2013). A unified approach for detection of induced epileptic seizures in rats using ECoG signals. Epilepsy & Behavior, 27(2), 355-64. [DOI:10.1016/j.yebeh.2013.01.028] [PMID] [DOI:10.1016/j.yebeh.2013.01.028]
29. Niknazar, M., Mousavi, S. R., Vahdat, B. V., & Sayyah, M. (2013). A new framework based on recurrence quantification analysis for epileptic seizure detection. IEEE Journal of BioMedical and Health Informatics, 17(3), 572-8. [DOI:10.1109/JBHI.2013.2255132] [PMID] [DOI:10.1109/JBHI.2013.2255132]
30. Orhan, U., Hekim, M., & Ozer, M. (2011). EEG signals classification using the K-means clustering and a multilayer perceptron neural network model. Expert Systems with Applications, 38(10), 13475-81. [DOI:10.1016/j.eswa.2011.04.149] [DOI:10.1016/j.eswa.2011.04.149]
31. Osorio, I., Zaveri, H. P., Frei, M. G., & Arthurs, S. (2016). Epilepsy: The intersection of neurosciences, biology, mathematics, engineering, and physics. Boca Raton, Florida: CRC Press.
32. Ouyang, G., Li, X., Dang, C., & Richards, D. A. (2008). Using recurrence plot for determinism analysis of EEG recordings in genetic absence epilepsy rats. Clinical Neurophysiology, 119(8), 1747-55. [DOI:10.1016/j.clinph.2008.04.005] [PMID] [DOI:10.1016/j.clinph.2008.04.005]
33. Oweis, R. J., & Abdulhay, E. W. (2011). Seizure classification in EEG signals utilizing Hilbert-Huang transform. Biomedical Engineering Online, 10(1), 38. [DOI:10.1186/1475-925X-10-38] [PMID] [PMCID] [DOI:10.1186/1475-925X-10-38]
34. Pachori, R. B. (2008). Discrimination between ictal and seizure-free EEG signals using empirical mode decomposition. Research Letters in Signal Processing, 2008, Article ID: 293056. [DOI:10.1155/2008/293056] [DOI:10.1155/2008/293056]
35. Pachori, R. B., & Bajaj, V. (2011). Analysis of normal and epileptic seizure EEG signals using empirical mode decomposition. Computer Methods and Programs in Biomedicine, 104(3), 373-81. [DOI:10.1016/j.cmpb.2011.03.009] [PMID] [DOI:10.1016/j.cmpb.2011.03.009]
36. Page, A., Sagedy, C., Smith, E., Attaran, N., Oates, T., & Mohsenin, T. (2015). A flexible multichannel EEG feature extractor and classifier for seizure detection. IEEE Transactions on Circuits and Systems II: Express Briefs, 62(2), 109-13. [DOI:10.1109/TCSII.2014.2385211] [DOI:10.1109/TCSII.2014.2385211]
37. Peker, M., Sen, B., & Delen, D. (2016). A novel method for automated diagnosis of epilepsy using complex-valued classifiers. IEEE Journal of Biomedical and Health Informatics, 20(1), 108-18. [DOI:10.1109/JBHI.2014.2387795] [PMID] [DOI:10.1109/JBHI.2014.2387795]
38. Peng, H., Long, F., & Ding, C. (2005). Feature selection based on mutual information criteria of max-dependency, max-relevance, and min-redundancy. IEEE Transactions on Pattern Analysis and Machine Intelligence, 27(8), 1226-38. [DOI:10.1109/TPAMI.2005.159] [PMID] [DOI:10.1109/TPAMI.2005.159]
39. Ramgopal, S., Thome-Souza, S., Jackson, M., Kadish, N. E., Fernández, I. S., Klehm, J., et al. (2014). Seizure detection, seizure prediction, and closed-loop warning systems in epilepsy. Epilepsy & Behavior, 37, 291-307. [DOI:10.1016/j.yebeh.2014.06.023] [PMID] [DOI:10.1016/j.yebeh.2014.06.023]
40. Riaz, F., Hassan, A., Rehman, S., Niazi, I. K., & Dremstrup, K. (2016). EMD-based temporal and spectral features for the classification of EEG signals using supervised learning. IEEE Transactions on Neural Systems and Rehabilitation Engineering, 24(1), 28-35. [DOI:10.1109/TNSRE.2015.2441835] [PMID] [DOI:10.1109/TNSRE.2015.2441835]
41. Shafiul Alam, S. M., & Bhuiyan, M. I. H. (2013). Detection of seizure and epilepsy using higher order statistics in the EMD domain. IEEE Journal of Biomedical and Health Informaticas, 17(2), 313-8. [DOI:10.1109/JBHI.2012.2237409.] [PMID] [DOI:10.1109/JBHI.2012.2237409]
42. Srinivasan, V., Eswaran, C., & Sriraam, N. (2007). Approximate entropy-based epileptic EEG detection using artificial neural networks. IEEE Transactions on Information Technology in Biomedicine, 11(3), 288-95. [DOI:10.1109/TITB.2006.884369] [PMID] [DOI:10.1109/TITB.2006.884369]
43. Subasi, A. (2007). EEG signal classification using wavelet feature extraction and a mixture of expert model. Expert Systems with Applications, 32(4), 1084-93. [DOI:10.1016/j.eswa.2006.02.005] [DOI:10.1016/j.eswa.2006.02.005]
44. Subasi, A., & Gursoy, M. I. (2010). EEG signal classification using PCA, ICA, LDA and support vector machines. Expert Systems with Applications, 37(12), 8659-66. [DOI:10.1016/j.eswa.2010.06.065] [DOI:10.1016/j.eswa.2010.06.065]
45. Temko, A., Nadeu, C., Marnane, W., Boylan, G., & Lightbody, G. (2011). EEG signal description with spectral-envelope-based speech recognition features for detection of neonatal seizures. IEEE Transactions on Information Technology in Biomedicine, 15(6), 839-47. [DOI:10.1109/TITB.2011.2159805] [PMID] [PMCID] [DOI:10.1109/TITB.2011.2159805]
46. Thomas, E. M., Temko, A., Marnane, W. P., Boylan, G. B., & Lightbody, G. (2013). Discriminative and generative classification techniques applied to automated neonatal seizure detection. IEEE Journal of Biomedical and Health Informatics, 17(2), 297-304. [DOI:10.1109/JBHI.2012.2237035] [PMID] [DOI:10.1109/JBHI.2012.2237035]
47. Thomasson, N., Hoeppner, T. J., Webber, C. L., & Zbilut, J. P. (2001). Recurrence quantification in epileptic EEGs. Physics Letters A, 279(1), 94-101. [DOI:10.1016/S0375-9601(00)00815-X] [DOI:10.1016/S0375-9601(00)00815-X]
48. Tzallas, A. T., Tsipouras, M. G., & Fotiadis, D. I. (2009). Epileptic seizure detection in EEGs using time–frequency analysis. IEEE Transactions on Information Technology in Biomedicine, 13(5), 703-10. [DOI:10.1109/TITB.2009.2017939] [PMID] [DOI:10.1109/TITB.2009.2017939]
49. Übeyli, E. D. (2009). Statistics over features: EEG signals analysis. Computers in Biology and Medicine, 39(8), 733-41. [DOI:10.1016/j.compbiomed.2009.06.001] [PMID] [DOI:10.1016/j.compbiomed.2009.06.001]
50. Van Drongelen, W., Nayak, S., Frim, D. M., Kohrman, M. H., Towle, V. L., Lee, H. C., et al. (2003). Seizure anticipation in pediatric epilepsy: Use of Kolmogorov entropy. Pediatric Neurology, 29(3), 207-13. [DOI:10.1016/S0887-8994(03)00145-0] [DOI:10.1016/S0887-8994(03)00145-0]
51. Wang, D., Miao, D., & Xie, C. (2011). Best basis-based wavelet packet entropy feature extraction and hierarchical EEG classification for epileptic detection. Expert Systems with Applications, 38(11), 14314-20. [DOI:10.1016/j.eswa.2011.05.096] [DOI:10.1016/j.eswa.2011.05.096]
52. Wang, N., & Lyu, M. R. (2015). Extracting and selecting distinctive EEG features for efficient epileptic seizure prediction. IEEE Journal of Biomedical and Health Informatics, 19(5), 1648-59. [DOI:10.1109/JBHI.2014.2358640] [PMID] [DOI:10.1109/JBHI.2014.2358640]
53. Webber, C. L., & Marwan, N. (2015). Recurrence quantification analysis. Berlin: Springer. [DOI:10.1007/978-3-319-07155-8] [DOI:10.1007/978-3-319-07155-8]
54. Wlodarczyk, B. J., Palacios, A. M., George, T. M., & Finnell, R. H. (2012). Antiepileptic drugs and pregnancy outcomes. American Journal of Medical Genetics Part A, 158(8), 2071-90. [DOI:10.1002/ajmg.a.35438] [PMID] [PMCID] [DOI:10.1002/ajmg.a.35438]
55. Yang, C., Jeannès, R. L. B., Bellanger, J. J., & Shu, H. (2013). A new strategy for model order identification and its application to transfer entropy for EEG signals analysis. IEEE Transactions on Biomedical Engineering, 60(5), 1318-27. [DOI:10.1109/TBME.2012.2234125] [PMID] [DOI:10.1109/TBME.2012.2234125]
56. Yaylali, I., Koçak, H., & Jayakar, P. (1996). Detection of seizures from small samples using nonlinear dynamic system theory. IEEE Transactions on Biomedical Engineering, 43(7), 743-51. [DOI:10.1109/10.503182] [PMID] [DOI:10.1109/10.503182]
57. Zabihi, M., Kiranyaz, S., Bahrami Rad, A., Katsaggelos, A. K., Gabbouj, M., & Ince, T. (2016). Analysis of high-dimensional phase space via Poincaré section for patient-specific seizure detection. IEEE Transactions on Neural Systems and Rehabilitation Engineering, 24(3), 386-98. [DOI:10.1109/TNSRE.2015.2505238] [PMID] [DOI:10.1109/TNSRE.2015.2505238]
58. Zhang, Z., & Parhi, K. K. (2016). Low-complexity seizure prediction from iEEG/sEEG using spectral power and ratios of spectral power. IEEE Transactions on Biomedical Circuits and Systems, 10(3), 693-706. [DOI:10.1109/TBCAS.2015.2477264] [PMID] [DOI:10.1109/TBCAS.2015.2477264]
59. Zhou, W., Liu, Y., Yuan, Q., & Li, X. (2013). Epileptic seizure detection using lacunarity and Bayesian linear discriminant analysis in intracranial EEG. IEEE Transactions on Biomedical Engineering, 60(12), 3375-81. [DOI:10.1109/TBME.2013.2254486] [PMID] [DOI:10.1109/TBME.2013.2254486]
Send email to the article author
| Rights and permissions | |
 |
This work is licensed under a Creative Commons Attribution-NonCommercial 4.0 International License. |
![]()
Copyright © The Author(s);
This is an open access article distributed under the terms of the Creative Commons Attribution License (CC-By-NC), which permits use, distribution, and reproduction in any medium, provided the original work is properly cited and is not used for commercial purposes.
Contact Information
