

Volume 17, Issue 2 (March & April 2026)
BCN 2026, 17(2): 261-274 |
Back to browse issues page



Download citation:
BibTeX | RIS | EndNote | Medlars | ProCite | Reference Manager | RefWorks
Send citation to:


BibTeX | RIS | EndNote | Medlars | ProCite | Reference Manager | RefWorks
Send citation to:
Keyvanfard F. Impact of Weighting and Thresholding Strategies on Structural Brain Network Analysis in Schizophrenia. BCN 2026; 17 (2) :261-274
URL: http://bcn.iums.ac.ir/article-1-3317-en.html
URL: http://bcn.iums.ac.ir/article-1-3317-en.html


Department of Biomedical Engineering, Faculty of Electrical Engineering, K. N. Toosi University of Technology, Tehran, Iran.
Keywords: Brain network weighting, Diffusion tensor imaging (DTI), Thresholding, Schizophrenia (SZ), Graph metric
Full-Text [PDF 1614 kb]
| Abstract (HTML)
Full-Text:
Introduction
In recent years, there has been increasing interest in constructing structural brain networks—also referred to as structural connectomes (Sporns et al., 2005)—which map the white matter pathways connecting different brain regions. These networks can be noninvasively derived on a macroscopic scale using diffusion magnetic resonance imaging (dMRI) in combination with whole-brain tractography techniques (Sotiropoulos & Zalesky, 2017). This methodological framework has proven instrumental in examining how individual differences in brain network architecture relate to behavioral outcomes and health profiles. Nevertheless, constructing a representative network model that supports both within- and between-group comparisons presents a significant challenge (de Reus & van den Heuvel, 2013).
One core issue arises from the inherent noise and indirect nature of dMRI measurements, which frequently results in structural networks containing numerous false-positive connections (Jbabdi & Johansen-Berg, 2011; Thomas et al., 2014; Yeh et al., 2018; Zalesky & Fornito, 2009). Although substantial progress has been made in mapping major white matter tracts using tractography (Mori et al., 2009), a complete and precise anatomical reference that identifies all existing macroscale connections—encompassing thousands of tracts and millions of streamlines—remains unrealized. In response to this gap and the demand for more systematic denoising strategies (de Reus & van den Heuvel, 2013; Maier-Hein et al., 2017; van Wijk et al., 2010), researchers have developed inferential approaches to isolate and eliminate possibly spurious connections.
Some researchers believe that topological network properties are not significantly altered by the discarding of weak connections (Civier et al., 2019) and therefore, they utilized the unthresholded connectivity matrices. Others have adopted thresholding techniques to reduce the possible impact of low-weight edges on the results. Absolute thresholding, which preserves only connections exceeding a fixed weight (Hagmann et al., 2007), is a commonly used approach. However, this method can lead to unequal edge counts across subjects or groups, especially problematic in clinical comparisons, as it introduces variation in network density—the ratio of actual to possible connections. This density variation is known to influence many graph-theoretical metrics, potentially confounding findings (Van Wijk et al., 2010). Despite these issues, absolute thresholding continues to be widely employed. To mitigate network density effects, an alternative approach—proportional (density-based) thresholding—has been proposed (Achard & Bullmore, 2007; Bassett et al., 2009; van den Heuvel et al., 2008). This method maintains a consistent number of connections across participants by retaining only the top PT% of strongest links, ensuring comparability across groups. In binary analyses, retained connections are set to 1 and all others to 0. This fixed-density strategy, also termed “network cost” or “network (graph) density” control (Ginestet et al., 2011; Jalili, 2016), assumes that observed group differences in network properties reflect true topological disparities rather than density-induced artifacts.
A growing body of methodological research has emphasized that the choice of thresholding strategy can substantially alter the topology of structural connectivity networks and the statistical inferences drawn from them. A recent study (Buchanan et al., 2020) demonstrated that both the thresholding rule and edge-weighting scheme can markedly influence network density, hub structure, and group-level effects. Foundational methodological work (Fornito et al., 2016) and the sensitivity–specificity framework discussed by Zalesky et al. (2016) further highlight that threshold decisions can introduce variability comparable to, or even greater than, the underlying biological effects of interest. More broadly, several methodological analyses have emphasized that threshold choice can meaningfully influence network stability, reproducibility, and the interpretation of group differences.
Another complicating factor in constructing a representative structural network is the uncertainty about which connectivity weighting best explains biological structure. Structural networks derived from dMRI have used various weighting schemes to quantify connection strength, including streamline counts or densities (Hagmann et al., 2008a) and fractional anisotropy (FA) values (Robinson et al., 2010; Verstraete et al., 2011). Additional metrics, such as apparent diffusion coefficient (ADC) have also been utilized to assess different characteristics of white matter microstructure (Agosta et al., 2013; Collin et al., 2014). Considering several concepts in structural network metrics, in addition to different thresholding approaches, motivated the present study’s comparison of absolute and proportional thresholding across multiple weighting schemes.
Schizophrenia (SZ), a chronic and disabling mental disorder, approximately affects 0.45% of the adult population worldwide (Vos et al., 2017). It is characterized by hallucinations, delusions, and disruptions in cognition and behavior, and ranks among the top causes of disability in people aged 15 to 44 (Hany et al., 2024). A leading hypothesis posits that white matter abnormalities contribute to disrupted communication between brain regions—a hallmark of SZ (Konrad & Winterer, 2007; Samartzis et al., 2014; Wang et al., 2020). Such abnormalities can be investigated using diffusion tensor imaging (DTI), which offers insight into microstructural features, such as myelination and axonal density.
The present study explored the influence of two thresholding techniques—absolute and proportional—on network metrics computed from various structural connectivity weightings, including fiber density, streamline count, fiber length, ADC, and FA. We compared graph metrics across individuals diagnosed with SZ and healthy controls, focusing on three commonly used measures: node degree, clustering coefficient, and global efficiency. This investigation aimed to clarify how thresholding choices and weighting strategies affect the detection of network differences in SZ.
Materials and Methods
Dataset
We utilized structural connectivity data from 27 individuals diagnosed with SZ (mean age: 41±9.6 years) and 27 healthy participants as a control group (mean age: 35±6.8 years), matched across all relevant parameters. This dataset was previously published on Zenodo, with full methodological details (Vohryzek et al., 2020). Participants in the SZ group were recruited from the Service of General Psychiatry at Lausanne University Hospital and met the DSM-IV diagnostic criteria for SZ and schizoaffective disorders (American Psychiatric Association, 2000). Healthy controls were recruited via public advertisement and assessed using the diagnostic interview for genetic studies (DIGS) (Preisig et al., 1999).
Cortical parcellation was performed using the Desikan-Killiany atlas (Desikan et al., 2006), along with additional surface segmentation (Cammoun et al., 2012), applied to each subject’s MPRAGE volume. The gray matter was segmented into 128 regions of interest (ROIs), comprising 114 cortical areas and 14 subcortical nuclei.
Network thresholding and measures
Structural connectivity between brain regions was reconstructed using whole-brain deterministic tractography. Networks were generated by identifying connections between all pairs of ROIs. The strength of each connection was quantified using five different network weightings:
1. Density – the number of streamlines between two ROIs, normalized by the mean surface area of the ROIs (Hagmann et al., 2008b);
2. Number of tracts (NoT) – the total count of streamlines connecting two ROIs;
3. Length of fibers (LoF) – the average length of all streamlines between a given pair of ROIs;
4. ADC – the mean diffusivity along the connecting streamlines, indicating the magnitude of diffusion;
5. Global FA (gFA) – a diffusion-based metric that reflects white matter myelination and structural integrity (Porcu et al., 2021).
For each of these five network weightings (density, NoT, LoF, ADC, and gFA), two thresholding methods were applied: absolute thresholding and proportional (density-based) thresholding. In the absolute thresholding approach, only edges with values above a fixed threshold T (e.g. greater than 0.3) were retained, while all other connections were set to zero.
In proportional thresholding, the structural connectivity matrices were thresholded by preserving the top PT% of strongest connections, with the rest set to zero. This method yielded weighted graphs with a global network density corresponding to PT% (Buchanan et al., 2020; de Reus & van den Heuvel, 2013).
We examined a range of threshold levels T from 0.01 to 0.4 in steps of 0.02 for absolute thresholding, and a range of PT in proportional thresholding from 70% to 1% in steps of 5%. It should be mentioned that all five types of SC matrices were normalized to [0,1] to enable the application of similar threshold values.
In addition, three graph-theoretic metrics (Rubinov & Sporns, 2010) were computed to quantify brain network variations in patients: node degree (quantifying the importance of each node), global efficiency, and network clustering coefficient (reflecting the interconnectedness of each node’s neighbors).
The following formal definitions describe the graph topological characteristics used in this study for a network of N nodes.
The node degree, typically denoted as kᵢ, is a fundamental measure of connectivity for a node within a network. It quantifies the total number of direct connections (or edges) a node has to other nodes in the network. For a node i, the degree is defined as (Equation 1):
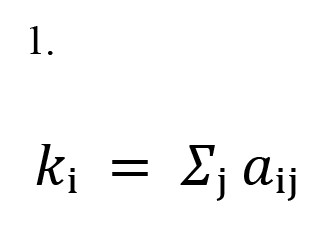
Where aᵢⱼ is an element of the adjacency matrix.
Global efficiency (Eglobal) quantifies the degree of integration in brain networks, reflecting how efficiently information is exchanged across the entire system (Achard & Bullmore, 2007; V. Latora & Marchiori, 2003; Vito Latora & Marchiori, 2001) defined as the inverse of the average shortest path length between all pairs of nodes in the network. Global efficiency is calculated using Equation 2:
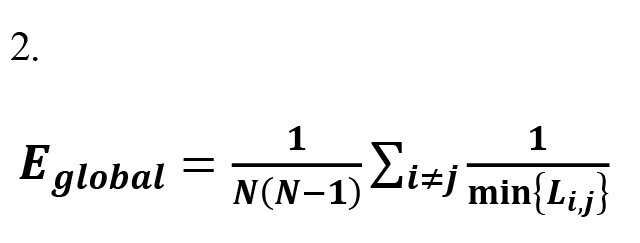
Where N is the total number of nodes in the network and Lij is the shortest path length between node i and node j.
The absolute clustering coefficient of a node (Ci) in a weighted network measures the likelihood that its neighboring nodes are also connected to each other, taking into account the strength of the connections (Onnela et al., 2005). For a weighted graph, it is defined as the geometric mean of the intensities of triangles around a node i (Equation 3):
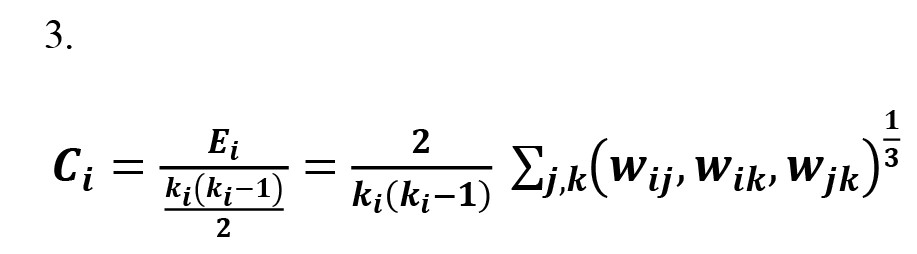
Where kᵢ is the degree of node i and wij is the connection weights between nodes i and j.
Statistical analysis
We began by calculating the average connectivity matrices and summarizing the descriptive statistics for the unthresholded networks across all five structural connectivity weightings. Subsequently, we examined how three graph-theoretical metrics varied as a function of the two thresholding methods and five types of connectivity matrices. To evaluate group differences between individuals with SZ and healthy controls (HCs), independent t-tests were performed across the full range of thresholds, with statistical significance determined at P<0.05.
Given the exploratory nature of this study and the strongly correlated structure of graph-theoretical measures across adjacent thresholds, no formal multiple-comparison correction was applied across threshold levels. Graph metrics at nearby thresholds are not statistically independent, and applying standard corrections (e.g. Bonferroni or FDR) would therefore be overly conservative and potentially obscure meaningful trends. Instead, we reported uncorrected P-values across the full threshold range to provide a transparent depiction of how group differences evolve as a function of thresholding.
Results
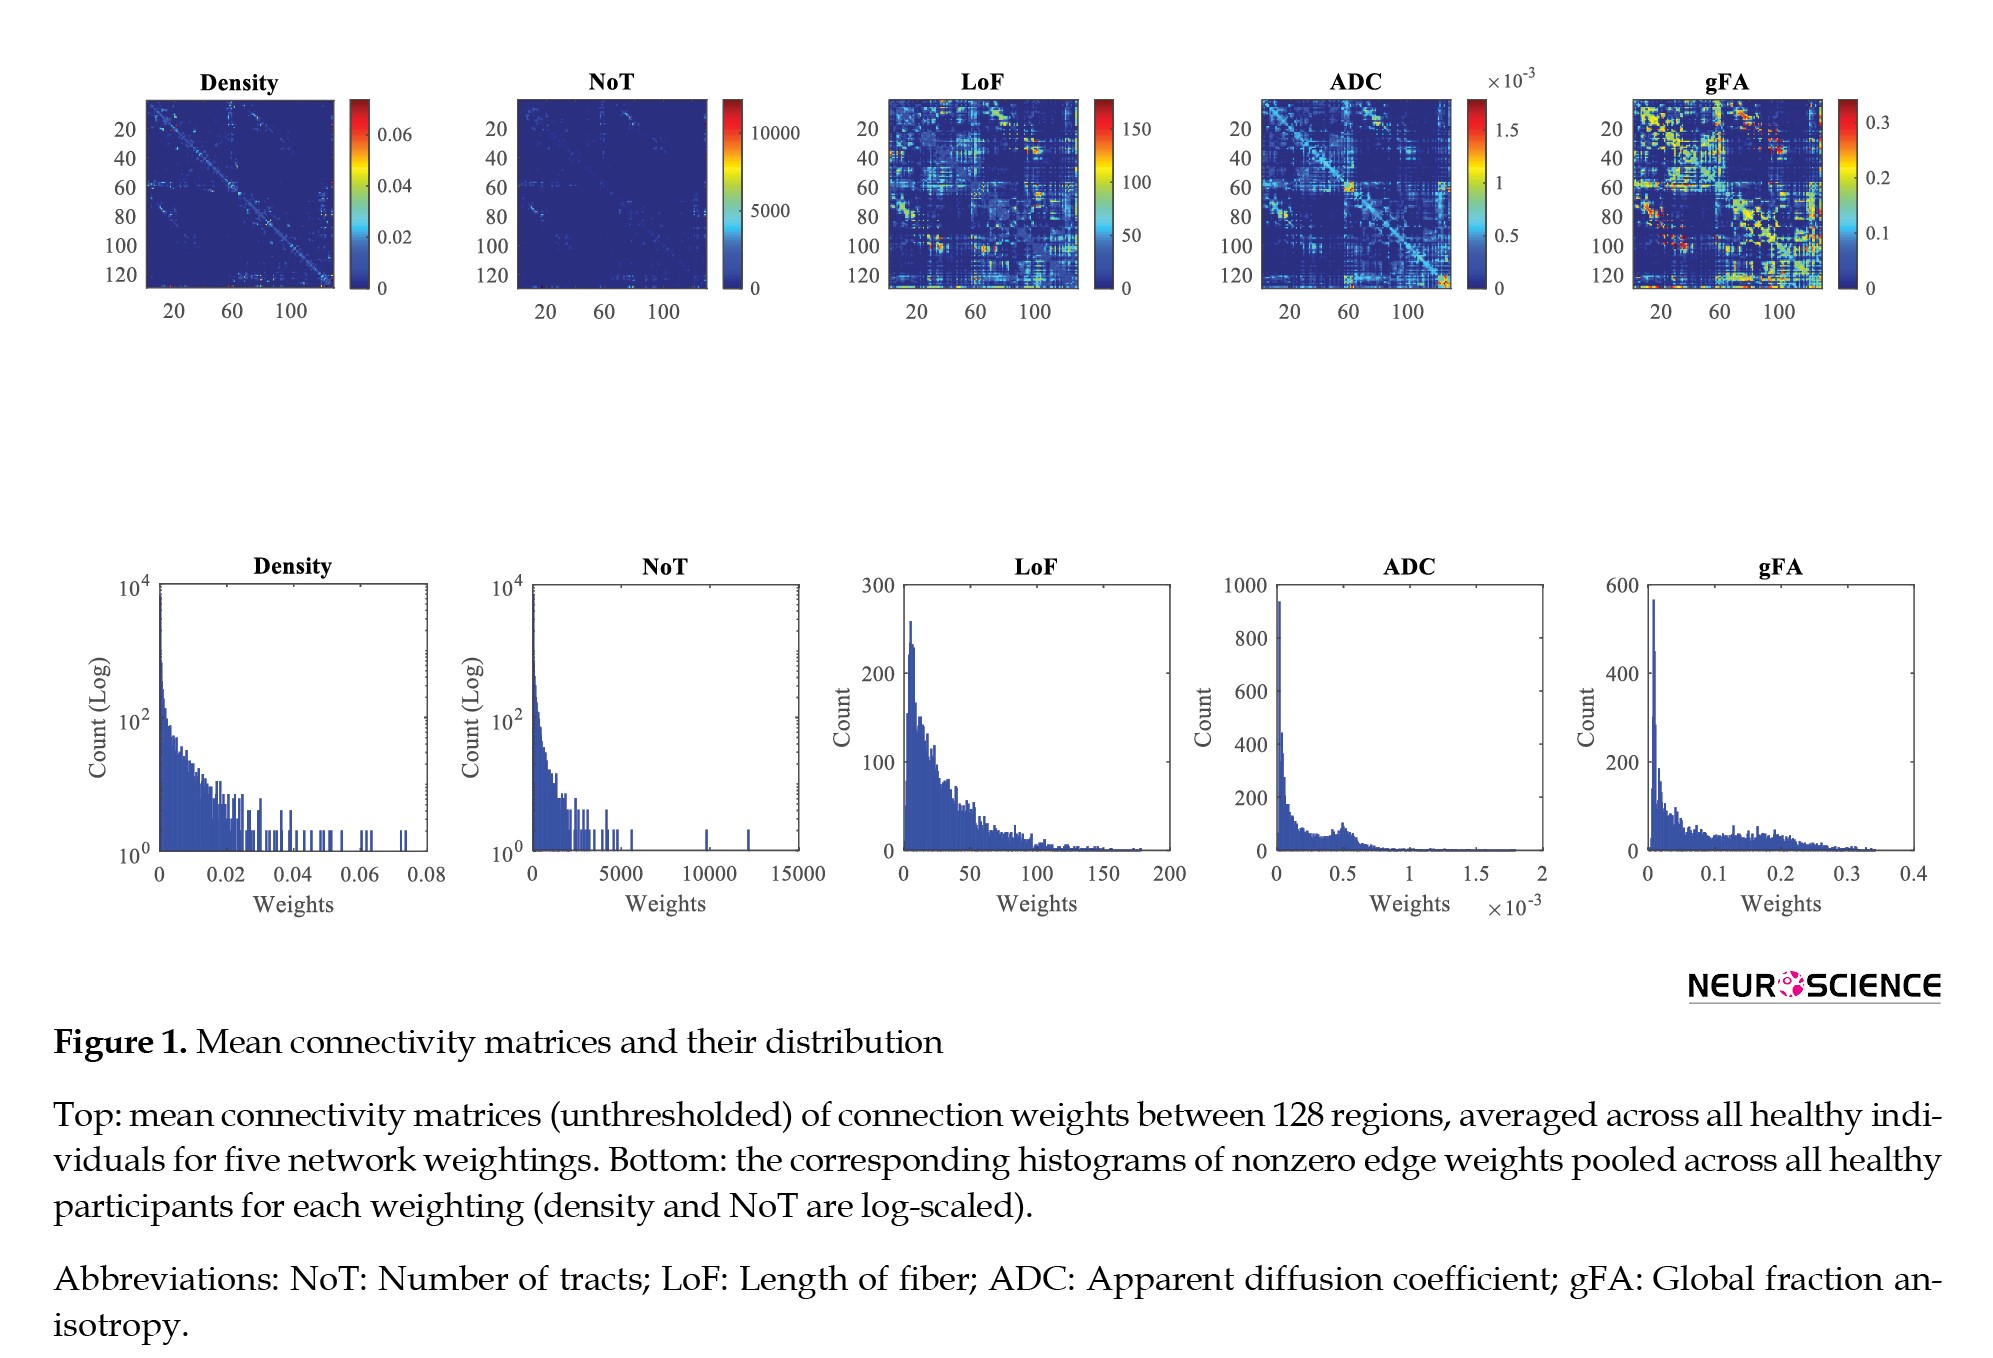
The mean connectivity matrices and corresponding histograms of edge weights computed for each network weighting (Density, NoT, LoF, ADC, and gFA) are shown in Figure 1.
In recent years, there has been increasing interest in constructing structural brain networks—also referred to as structural connectomes (Sporns et al., 2005)—which map the white matter pathways connecting different brain regions. These networks can be noninvasively derived on a macroscopic scale using diffusion magnetic resonance imaging (dMRI) in combination with whole-brain tractography techniques (Sotiropoulos & Zalesky, 2017). This methodological framework has proven instrumental in examining how individual differences in brain network architecture relate to behavioral outcomes and health profiles. Nevertheless, constructing a representative network model that supports both within- and between-group comparisons presents a significant challenge (de Reus & van den Heuvel, 2013).
One core issue arises from the inherent noise and indirect nature of dMRI measurements, which frequently results in structural networks containing numerous false-positive connections (Jbabdi & Johansen-Berg, 2011; Thomas et al., 2014; Yeh et al., 2018; Zalesky & Fornito, 2009). Although substantial progress has been made in mapping major white matter tracts using tractography (Mori et al., 2009), a complete and precise anatomical reference that identifies all existing macroscale connections—encompassing thousands of tracts and millions of streamlines—remains unrealized. In response to this gap and the demand for more systematic denoising strategies (de Reus & van den Heuvel, 2013; Maier-Hein et al., 2017; van Wijk et al., 2010), researchers have developed inferential approaches to isolate and eliminate possibly spurious connections.
Some researchers believe that topological network properties are not significantly altered by the discarding of weak connections (Civier et al., 2019) and therefore, they utilized the unthresholded connectivity matrices. Others have adopted thresholding techniques to reduce the possible impact of low-weight edges on the results. Absolute thresholding, which preserves only connections exceeding a fixed weight (Hagmann et al., 2007), is a commonly used approach. However, this method can lead to unequal edge counts across subjects or groups, especially problematic in clinical comparisons, as it introduces variation in network density—the ratio of actual to possible connections. This density variation is known to influence many graph-theoretical metrics, potentially confounding findings (Van Wijk et al., 2010). Despite these issues, absolute thresholding continues to be widely employed. To mitigate network density effects, an alternative approach—proportional (density-based) thresholding—has been proposed (Achard & Bullmore, 2007; Bassett et al., 2009; van den Heuvel et al., 2008). This method maintains a consistent number of connections across participants by retaining only the top PT% of strongest links, ensuring comparability across groups. In binary analyses, retained connections are set to 1 and all others to 0. This fixed-density strategy, also termed “network cost” or “network (graph) density” control (Ginestet et al., 2011; Jalili, 2016), assumes that observed group differences in network properties reflect true topological disparities rather than density-induced artifacts.
A growing body of methodological research has emphasized that the choice of thresholding strategy can substantially alter the topology of structural connectivity networks and the statistical inferences drawn from them. A recent study (Buchanan et al., 2020) demonstrated that both the thresholding rule and edge-weighting scheme can markedly influence network density, hub structure, and group-level effects. Foundational methodological work (Fornito et al., 2016) and the sensitivity–specificity framework discussed by Zalesky et al. (2016) further highlight that threshold decisions can introduce variability comparable to, or even greater than, the underlying biological effects of interest. More broadly, several methodological analyses have emphasized that threshold choice can meaningfully influence network stability, reproducibility, and the interpretation of group differences.
Another complicating factor in constructing a representative structural network is the uncertainty about which connectivity weighting best explains biological structure. Structural networks derived from dMRI have used various weighting schemes to quantify connection strength, including streamline counts or densities (Hagmann et al., 2008a) and fractional anisotropy (FA) values (Robinson et al., 2010; Verstraete et al., 2011). Additional metrics, such as apparent diffusion coefficient (ADC) have also been utilized to assess different characteristics of white matter microstructure (Agosta et al., 2013; Collin et al., 2014). Considering several concepts in structural network metrics, in addition to different thresholding approaches, motivated the present study’s comparison of absolute and proportional thresholding across multiple weighting schemes.
Schizophrenia (SZ), a chronic and disabling mental disorder, approximately affects 0.45% of the adult population worldwide (Vos et al., 2017). It is characterized by hallucinations, delusions, and disruptions in cognition and behavior, and ranks among the top causes of disability in people aged 15 to 44 (Hany et al., 2024). A leading hypothesis posits that white matter abnormalities contribute to disrupted communication between brain regions—a hallmark of SZ (Konrad & Winterer, 2007; Samartzis et al., 2014; Wang et al., 2020). Such abnormalities can be investigated using diffusion tensor imaging (DTI), which offers insight into microstructural features, such as myelination and axonal density.
The present study explored the influence of two thresholding techniques—absolute and proportional—on network metrics computed from various structural connectivity weightings, including fiber density, streamline count, fiber length, ADC, and FA. We compared graph metrics across individuals diagnosed with SZ and healthy controls, focusing on three commonly used measures: node degree, clustering coefficient, and global efficiency. This investigation aimed to clarify how thresholding choices and weighting strategies affect the detection of network differences in SZ.
Materials and Methods
Dataset
We utilized structural connectivity data from 27 individuals diagnosed with SZ (mean age: 41±9.6 years) and 27 healthy participants as a control group (mean age: 35±6.8 years), matched across all relevant parameters. This dataset was previously published on Zenodo, with full methodological details (Vohryzek et al., 2020). Participants in the SZ group were recruited from the Service of General Psychiatry at Lausanne University Hospital and met the DSM-IV diagnostic criteria for SZ and schizoaffective disorders (American Psychiatric Association, 2000). Healthy controls were recruited via public advertisement and assessed using the diagnostic interview for genetic studies (DIGS) (Preisig et al., 1999).
Cortical parcellation was performed using the Desikan-Killiany atlas (Desikan et al., 2006), along with additional surface segmentation (Cammoun et al., 2012), applied to each subject’s MPRAGE volume. The gray matter was segmented into 128 regions of interest (ROIs), comprising 114 cortical areas and 14 subcortical nuclei.
Network thresholding and measures
Structural connectivity between brain regions was reconstructed using whole-brain deterministic tractography. Networks were generated by identifying connections between all pairs of ROIs. The strength of each connection was quantified using five different network weightings:
1. Density – the number of streamlines between two ROIs, normalized by the mean surface area of the ROIs (Hagmann et al., 2008b);
2. Number of tracts (NoT) – the total count of streamlines connecting two ROIs;
3. Length of fibers (LoF) – the average length of all streamlines between a given pair of ROIs;
4. ADC – the mean diffusivity along the connecting streamlines, indicating the magnitude of diffusion;
5. Global FA (gFA) – a diffusion-based metric that reflects white matter myelination and structural integrity (Porcu et al., 2021).
For each of these five network weightings (density, NoT, LoF, ADC, and gFA), two thresholding methods were applied: absolute thresholding and proportional (density-based) thresholding. In the absolute thresholding approach, only edges with values above a fixed threshold T (e.g. greater than 0.3) were retained, while all other connections were set to zero.
In proportional thresholding, the structural connectivity matrices were thresholded by preserving the top PT% of strongest connections, with the rest set to zero. This method yielded weighted graphs with a global network density corresponding to PT% (Buchanan et al., 2020; de Reus & van den Heuvel, 2013).
We examined a range of threshold levels T from 0.01 to 0.4 in steps of 0.02 for absolute thresholding, and a range of PT in proportional thresholding from 70% to 1% in steps of 5%. It should be mentioned that all five types of SC matrices were normalized to [0,1] to enable the application of similar threshold values.
In addition, three graph-theoretic metrics (Rubinov & Sporns, 2010) were computed to quantify brain network variations in patients: node degree (quantifying the importance of each node), global efficiency, and network clustering coefficient (reflecting the interconnectedness of each node’s neighbors).
The following formal definitions describe the graph topological characteristics used in this study for a network of N nodes.
The node degree, typically denoted as kᵢ, is a fundamental measure of connectivity for a node within a network. It quantifies the total number of direct connections (or edges) a node has to other nodes in the network. For a node i, the degree is defined as (Equation 1):
Where aᵢⱼ is an element of the adjacency matrix.
Global efficiency (Eglobal) quantifies the degree of integration in brain networks, reflecting how efficiently information is exchanged across the entire system (Achard & Bullmore, 2007; V. Latora & Marchiori, 2003; Vito Latora & Marchiori, 2001) defined as the inverse of the average shortest path length between all pairs of nodes in the network. Global efficiency is calculated using Equation 2:
Where N is the total number of nodes in the network and Lij is the shortest path length between node i and node j.
The absolute clustering coefficient of a node (Ci) in a weighted network measures the likelihood that its neighboring nodes are also connected to each other, taking into account the strength of the connections (Onnela et al., 2005). For a weighted graph, it is defined as the geometric mean of the intensities of triangles around a node i (Equation 3):
Where kᵢ is the degree of node i and wij is the connection weights between nodes i and j.
Statistical analysis
We began by calculating the average connectivity matrices and summarizing the descriptive statistics for the unthresholded networks across all five structural connectivity weightings. Subsequently, we examined how three graph-theoretical metrics varied as a function of the two thresholding methods and five types of connectivity matrices. To evaluate group differences between individuals with SZ and healthy controls (HCs), independent t-tests were performed across the full range of thresholds, with statistical significance determined at P<0.05.
Given the exploratory nature of this study and the strongly correlated structure of graph-theoretical measures across adjacent thresholds, no formal multiple-comparison correction was applied across threshold levels. Graph metrics at nearby thresholds are not statistically independent, and applying standard corrections (e.g. Bonferroni or FDR) would therefore be overly conservative and potentially obscure meaningful trends. Instead, we reported uncorrected P-values across the full threshold range to provide a transparent depiction of how group differences evolve as a function of thresholding.
Results
The mean connectivity matrices and corresponding histograms of edge weights computed for each network weighting (Density, NoT, LoF, ADC, and gFA) are shown in Figure 1.
Before any thresholding, the Mean±SD value of network density (the proportion of nonzero-weighted elements in a connectivity matrix) across subjects was 0.238±0.0078). From the histograms of edge weights pooled across all subjects (Figure 1) we observed that the distribution of all network weights approximately followed a power law, involving many low-weighted connections but very few high-weighted connections.
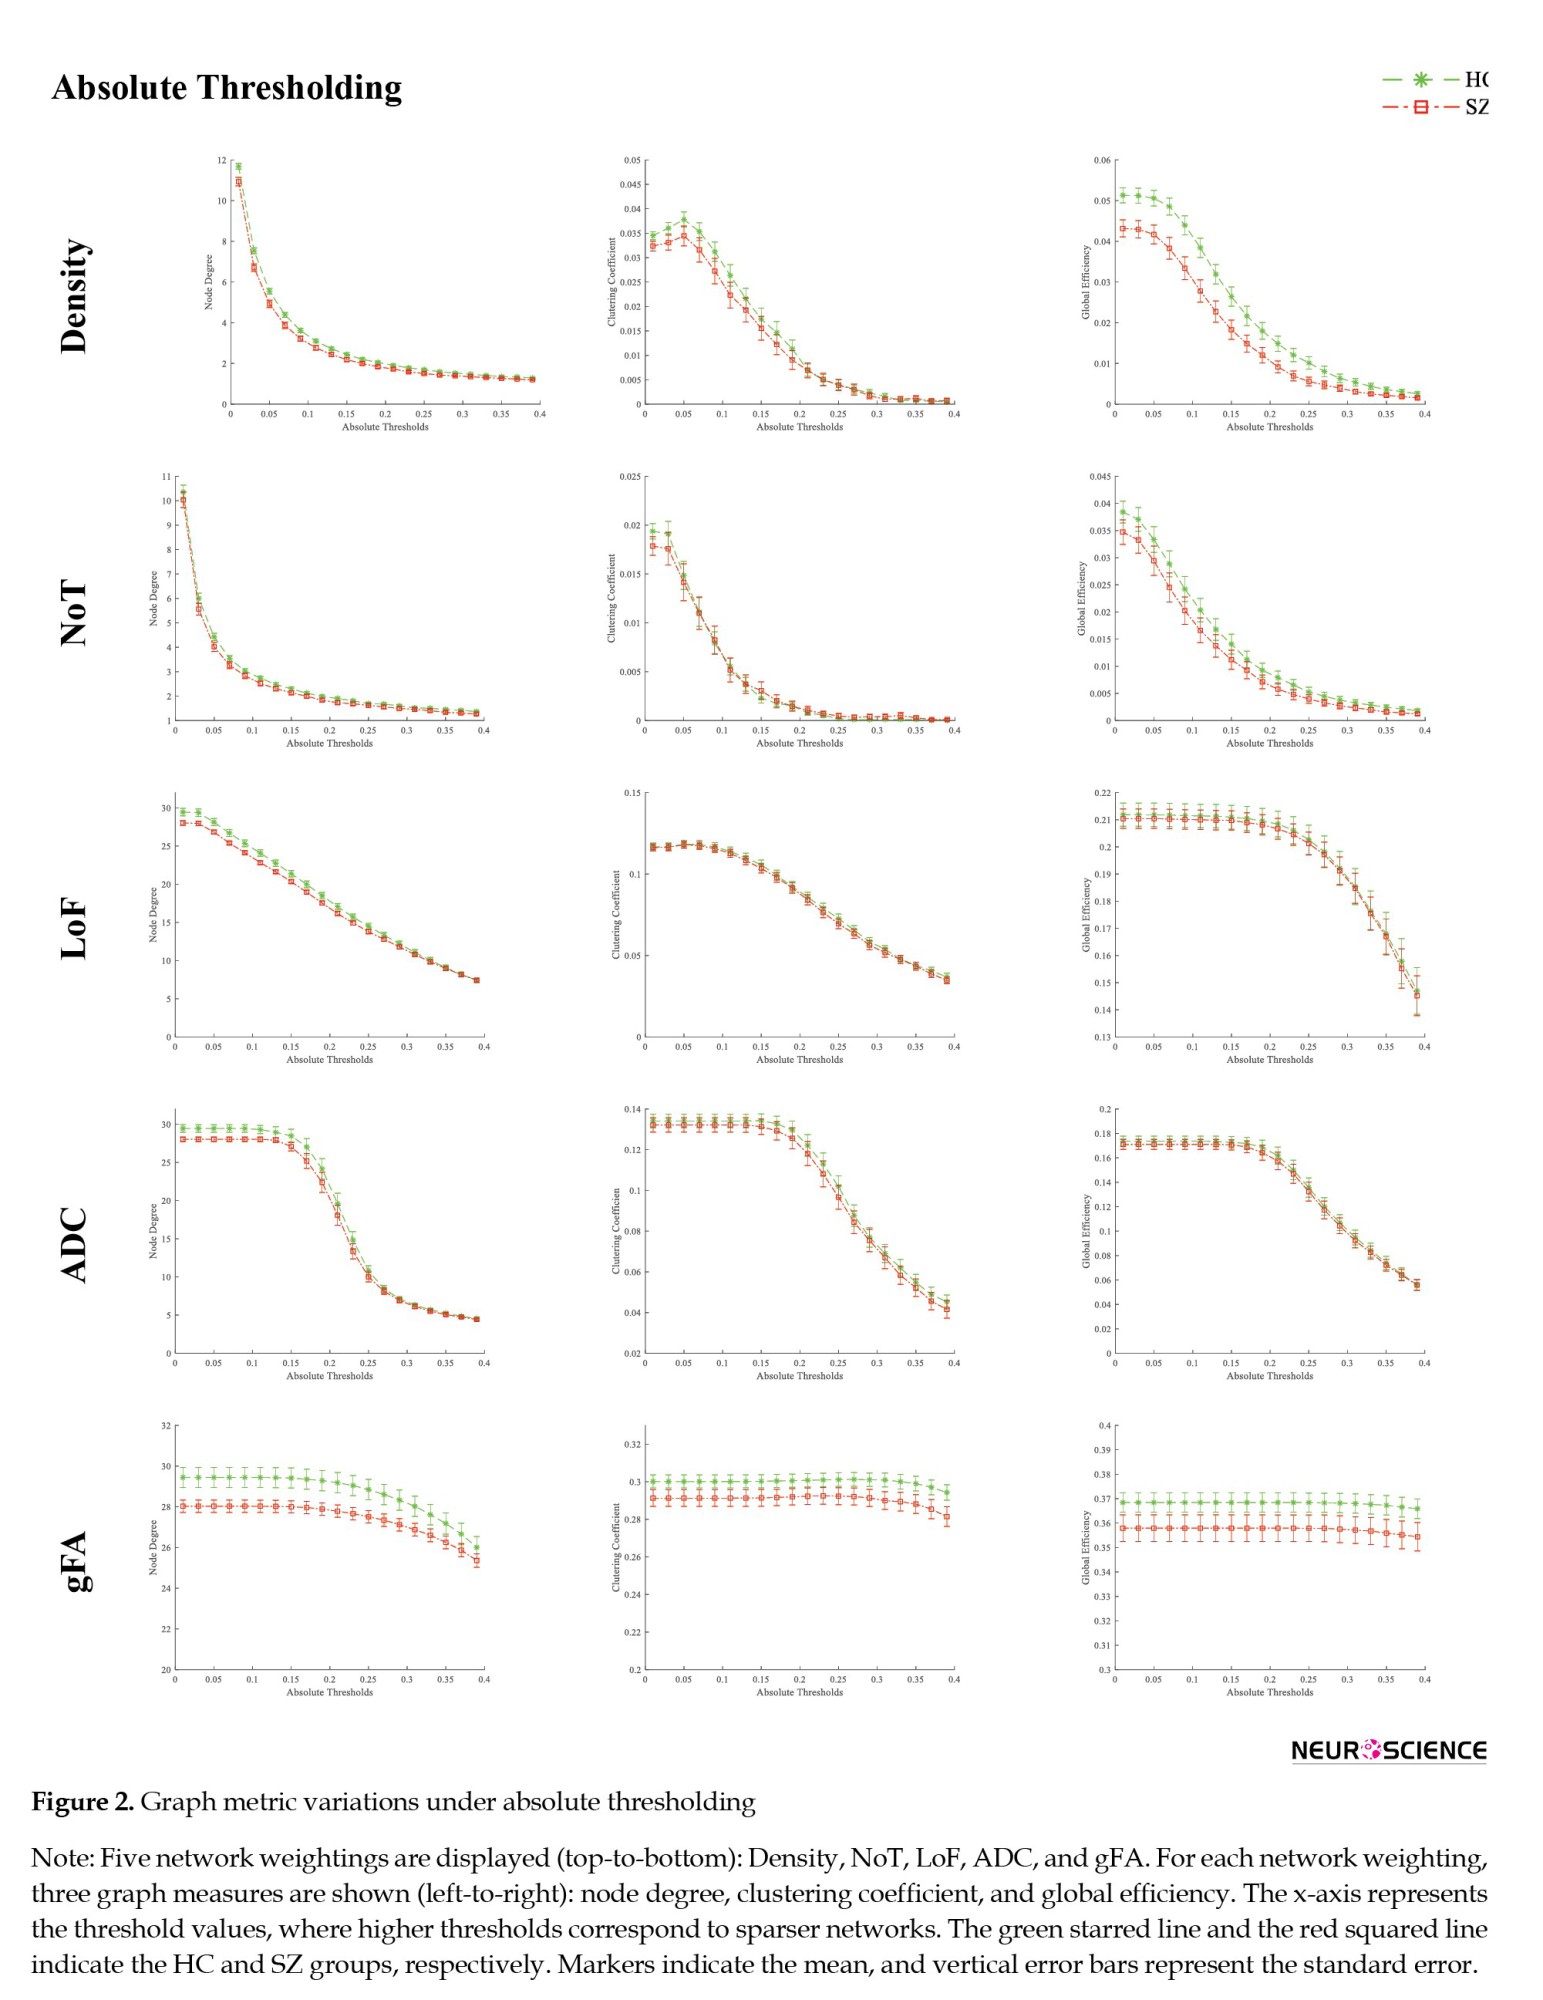
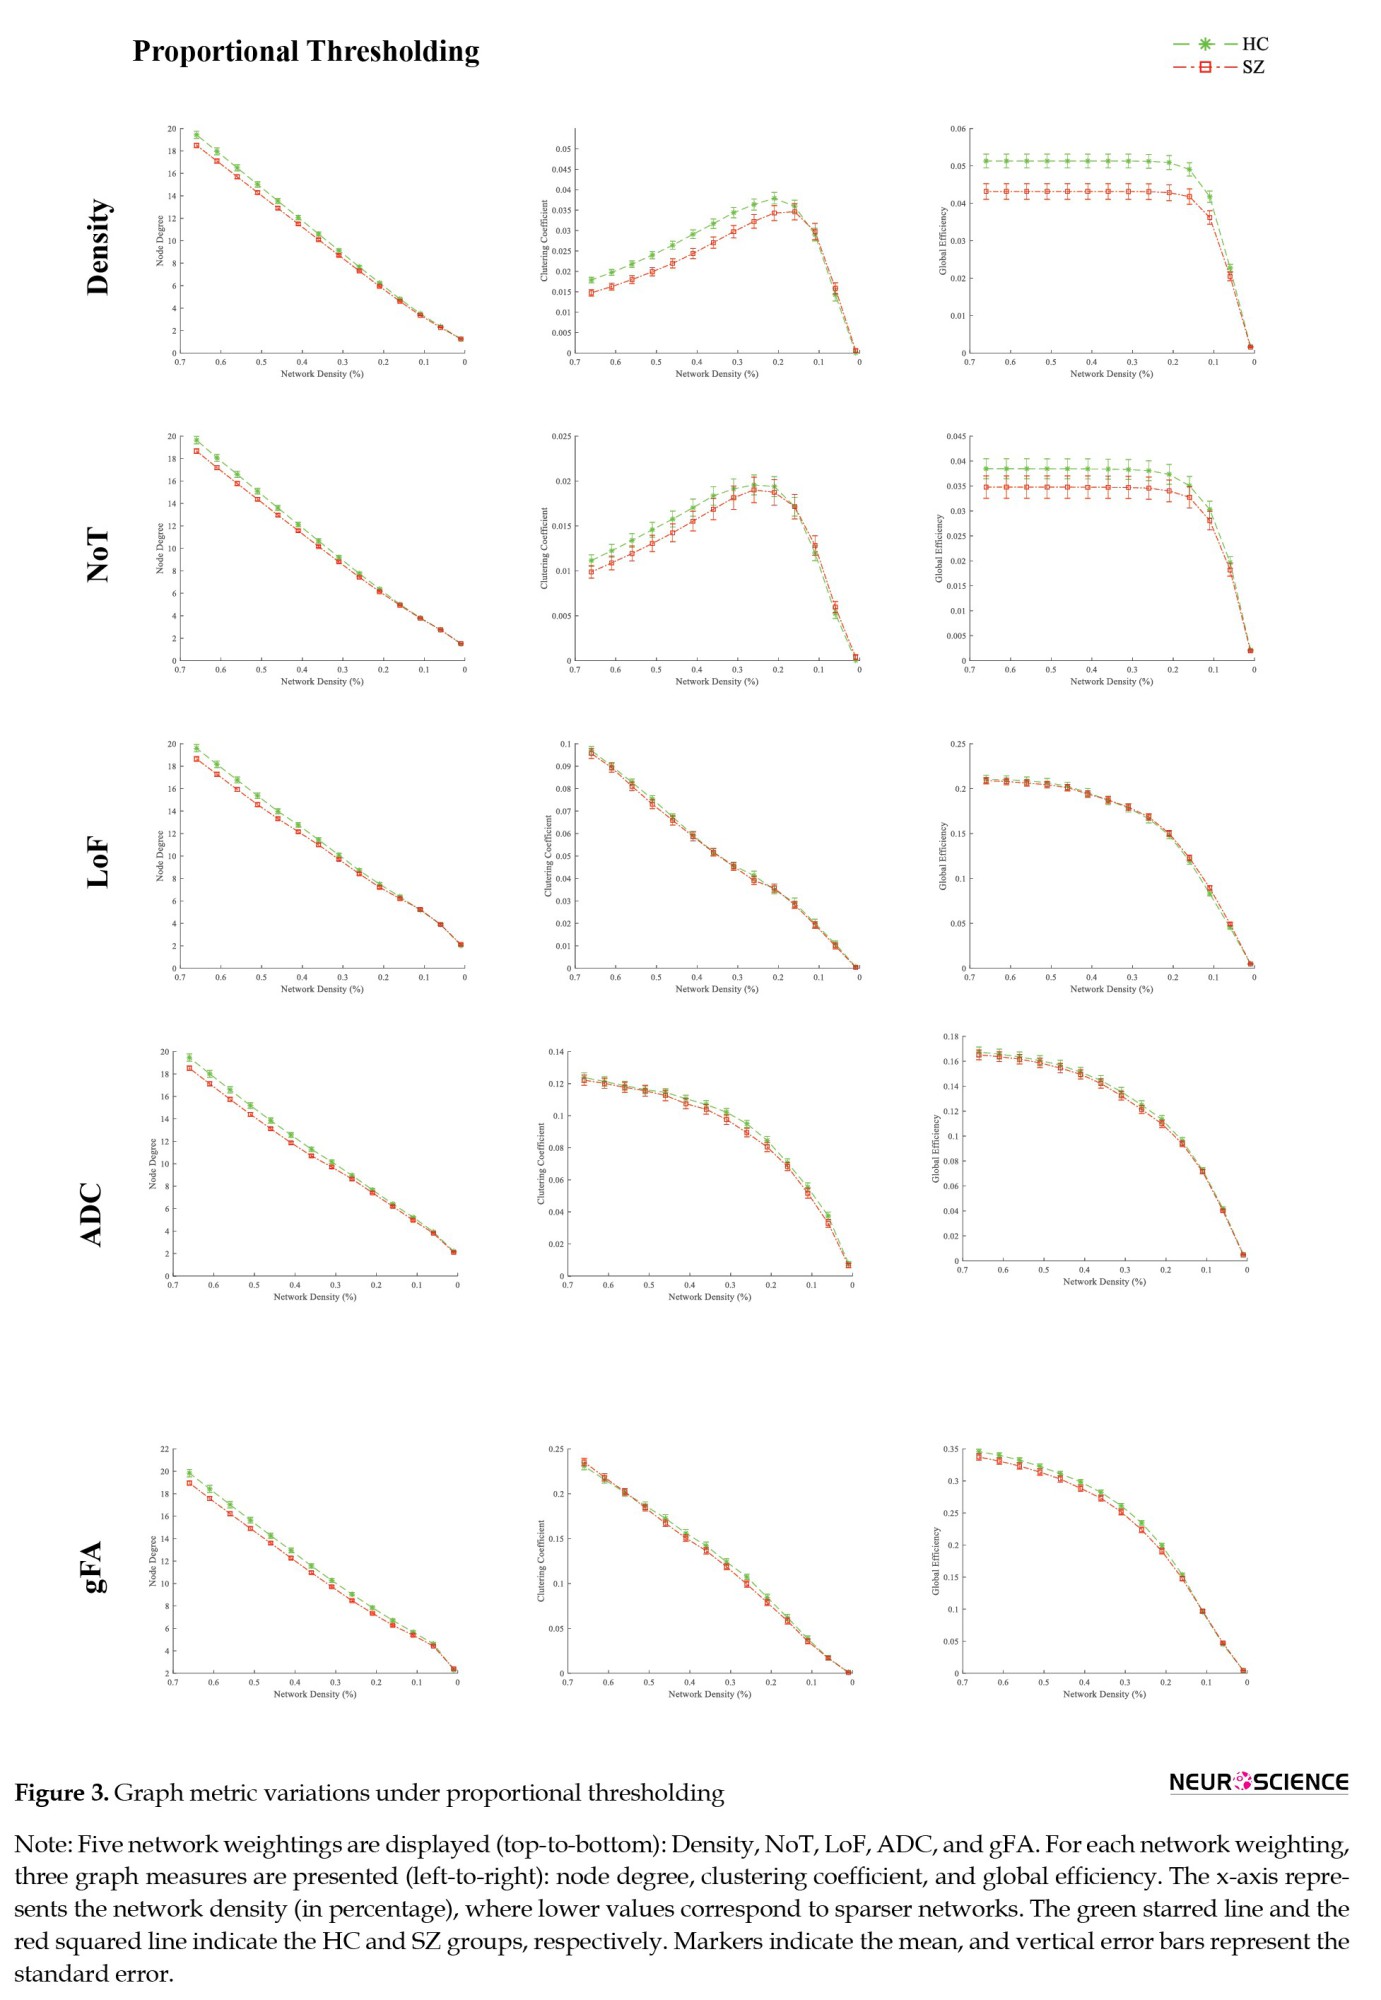
Figures 2 and 3 present the threshold-dependent trajectories of three graph-theoretical measures under absolute and proportional thresholding schemes, respectively.
Figures 2 and 3 present the threshold-dependent trajectories of three graph-theoretical measures under absolute and proportional thresholding schemes, respectively.
In both figures, trajectories are shown for HCs (green lines) and SZ patients (red lines), with error bars indicating the standard error. For both thresholding approaches, it can be observed that the metric values of the patients’ graph are lower than those of HCs. In absolute thresholding, all graph metrics exhibited a decrease with increasing threshold values. However, the rate of reduction varied across different network weighting methods (Figure 2). For instance, density-weighted networks show an exponential-like decay in node degree, whereas LoF-weighted networks demonstrate quasi-linear reductions.
For illustration of proportional thresholding effect, the x-axis is inverted to maintain a consistent interpretation with absolute thresholding (left = denser networks). Notably, the trend of graph metric reduction relative to decreasing density percentage (proportional thresholding) remained largely consistent across different network weighting schemes (Figure 3).
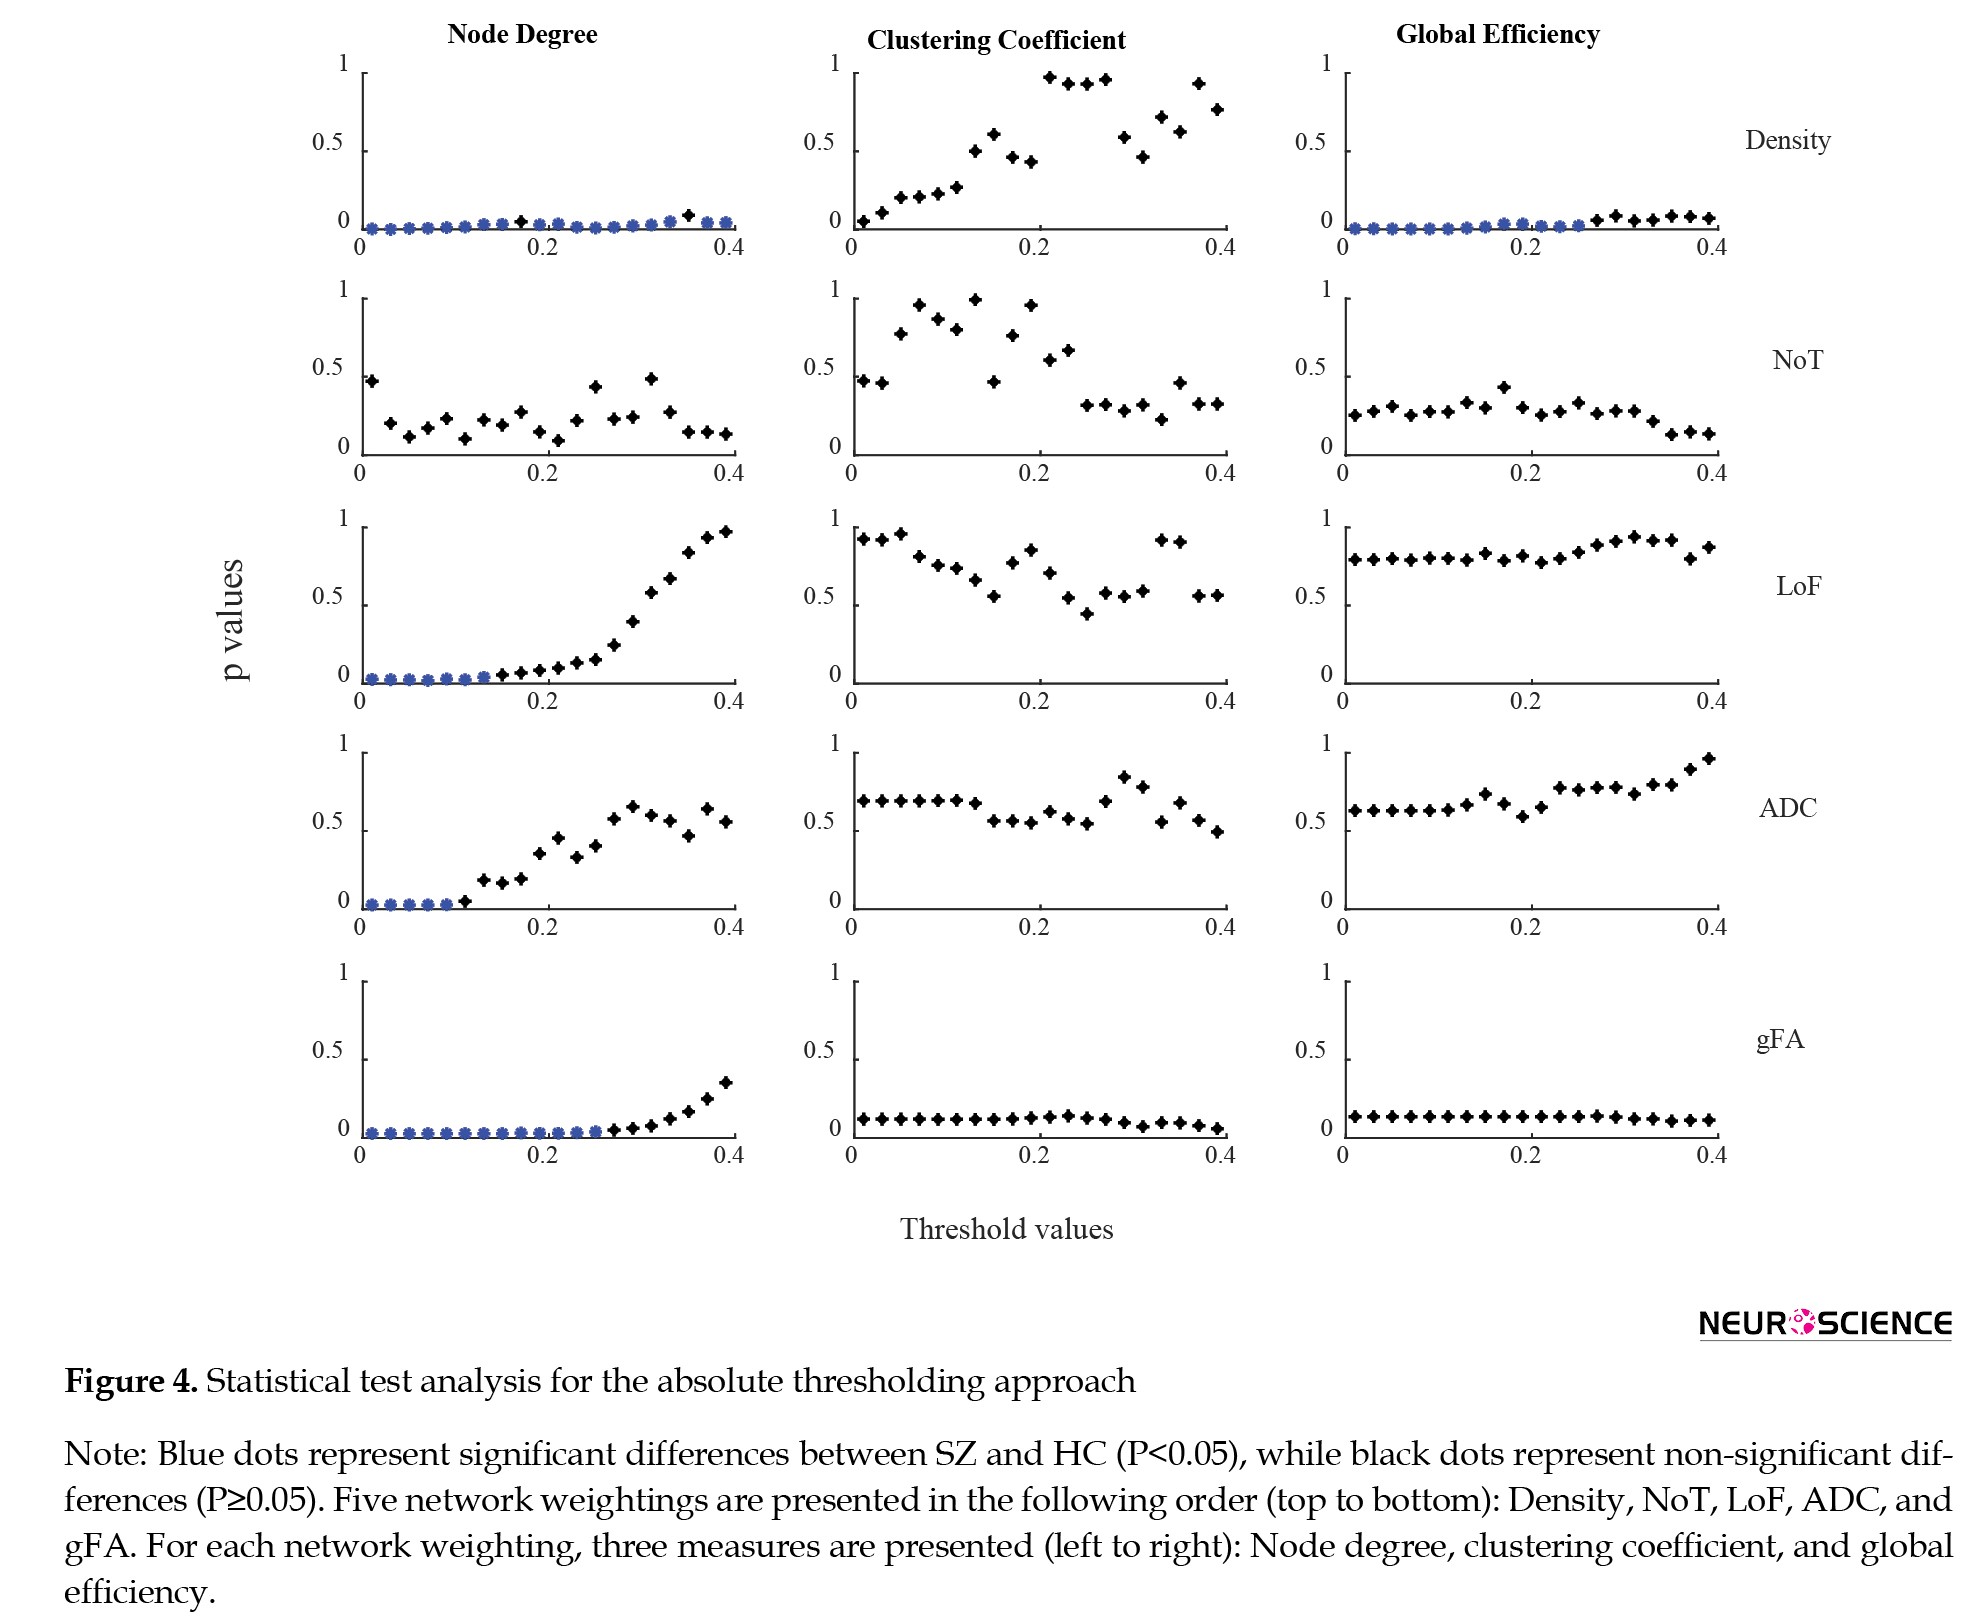
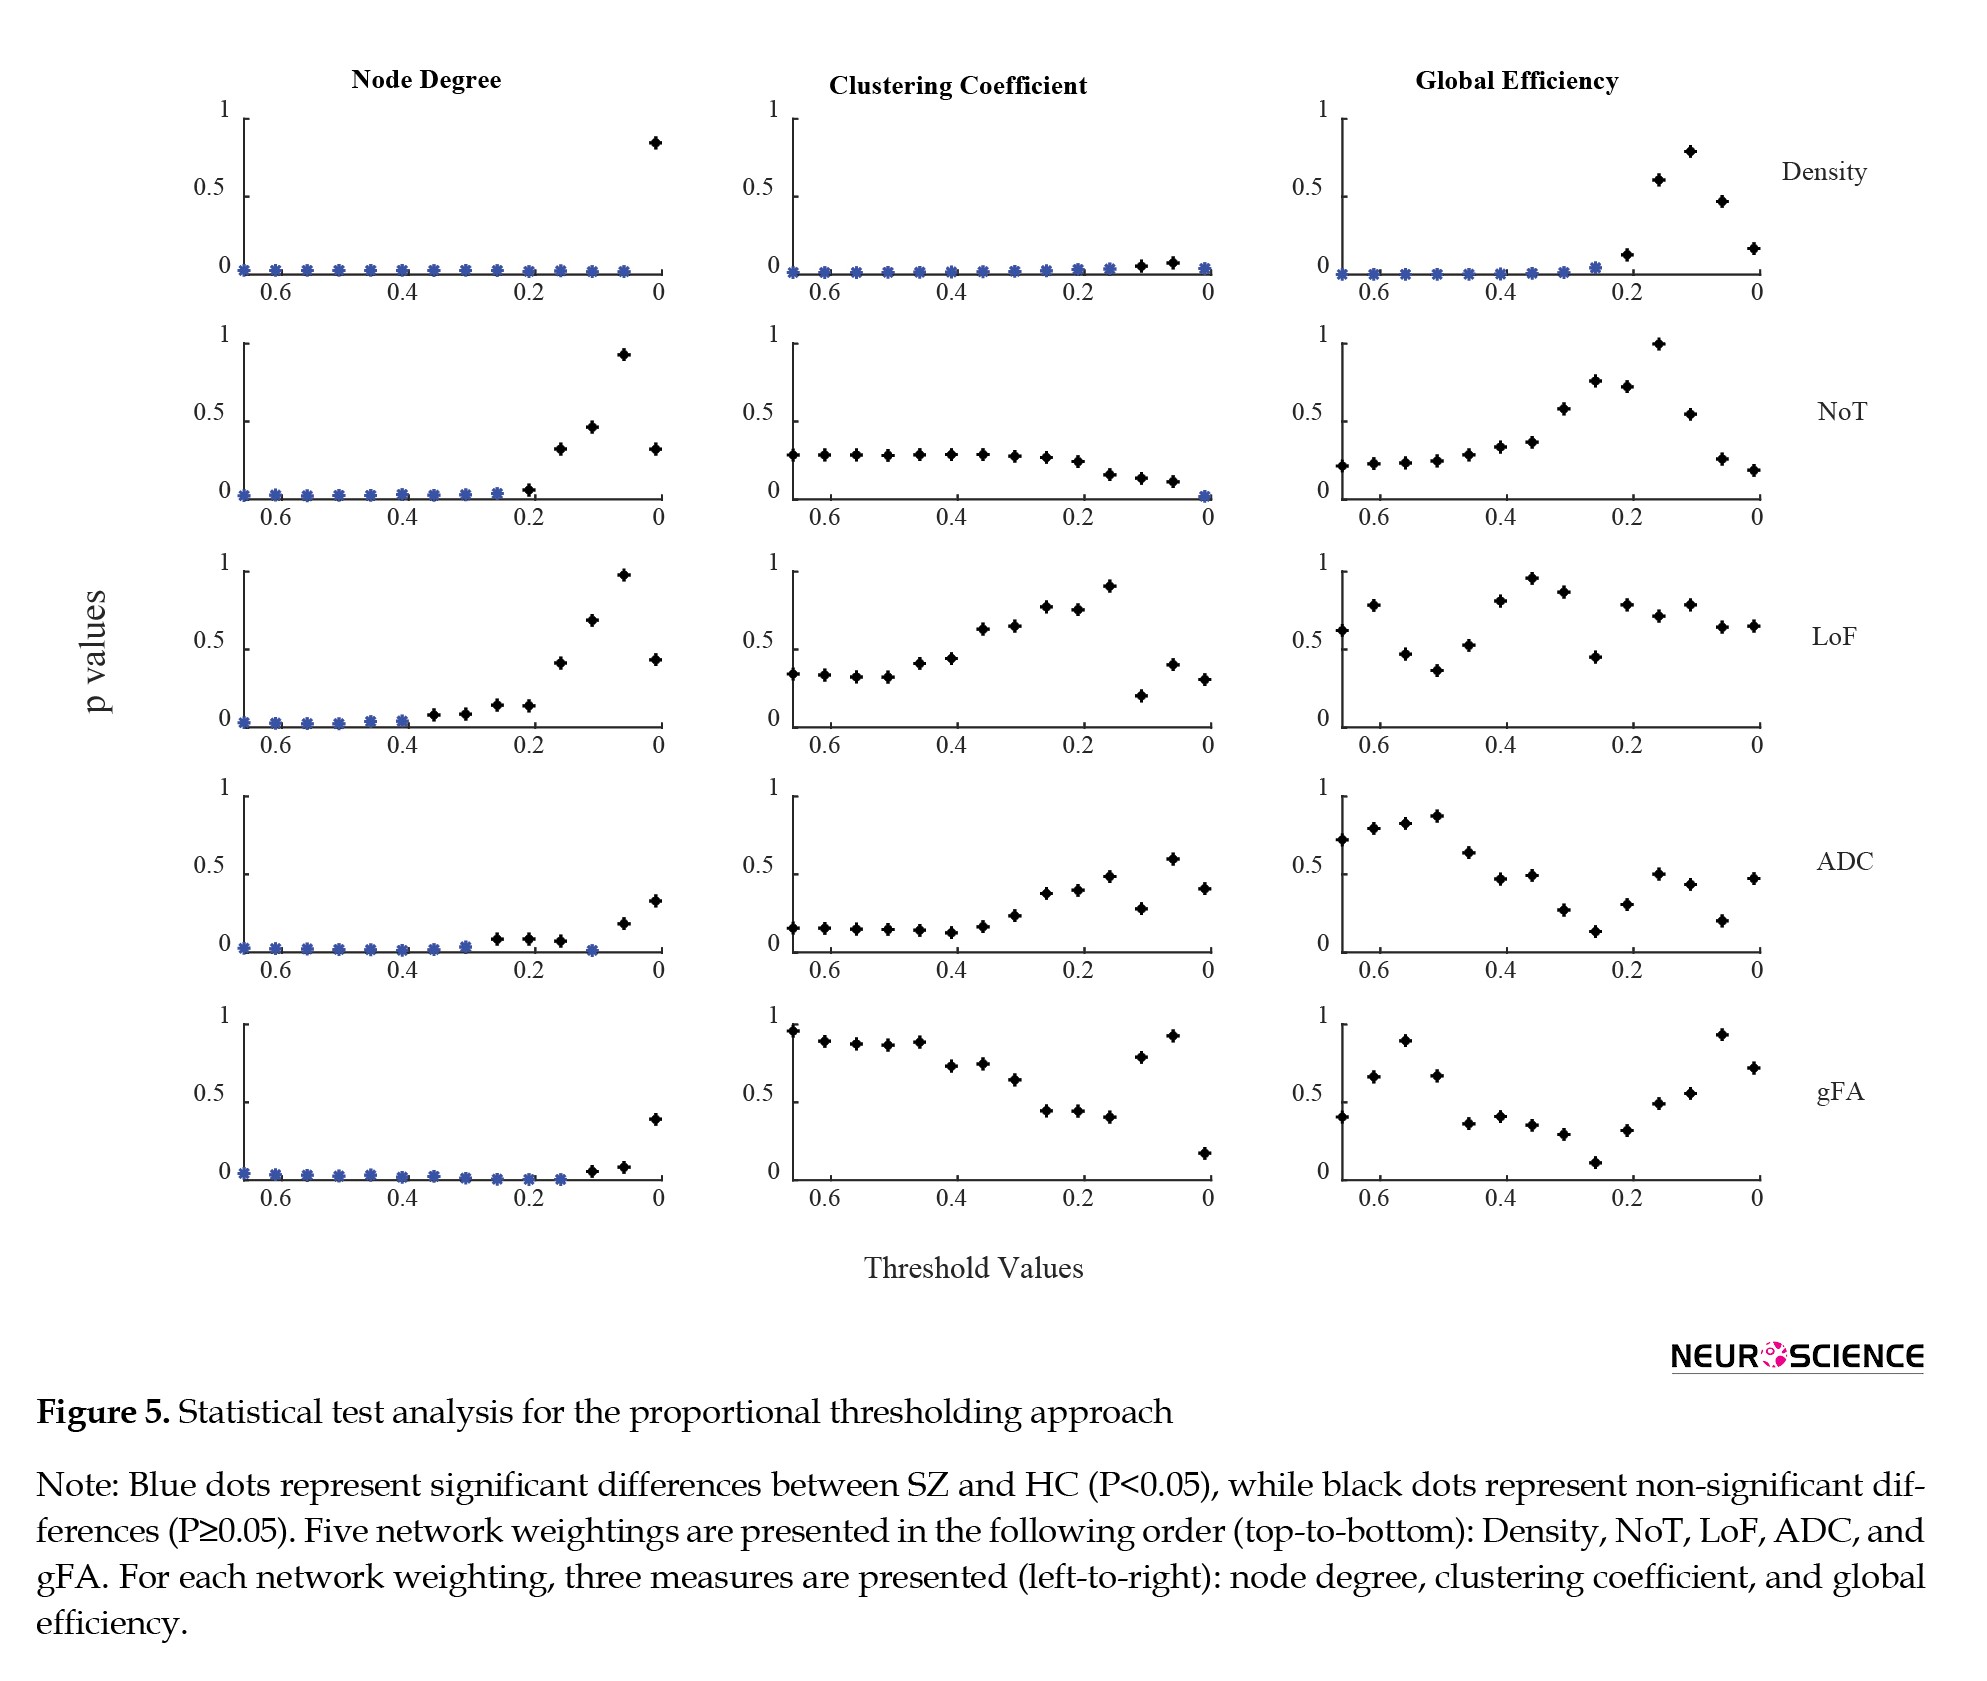
Figures 4 and 5 present the results of statistical comparisons between SZ patients and HCs across threshold values for absolute and proportional thresholding, respectively.
For illustration of proportional thresholding effect, the x-axis is inverted to maintain a consistent interpretation with absolute thresholding (left = denser networks). Notably, the trend of graph metric reduction relative to decreasing density percentage (proportional thresholding) remained largely consistent across different network weighting schemes (Figure 3).
Figures 4 and 5 present the results of statistical comparisons between SZ patients and HCs across threshold values for absolute and proportional thresholding, respectively.
Significant intergroup differences emerged at relatively low threshold values under absolute thresholding (Figure 4), particularly for node degree (P<0.05), with a similar pattern under proportional thresholding (Figure 5), indicating robustness across thresholding approaches. The most pronounced group differences were observed in density-weighted networks, and node degree appeared to be the graph metric most affected in SZ. Although the mean global efficiency for NoT visually appeared different between groups (Figure 3), this difference did not reach statistical significance (Figure 5), likely due to high inter-subject variability and the differing sensitivity of absolute versus proportional thresholding.
Discussion
We investigated how different network thresholding strategies and edge-weighting schemes influence variations in graph metrics derived from structural connectivity matrices. Our findings indicated that in the absence of thresholding, no statistically significant differences emerged between the SZ group and HCs. However, eliminating spurious connections substantially altered the analytical outcomes.
Variations in network topology and graph-derived metrics across different threshold levels are particularly relevant in the context of the well-recognized reproducibility crisis in contemporary science, which complicates the comparability of studies employing diverse analytical pipelines (Adamovich et al., 2022; Buchanan et al., 2020). Our findings emphasize that threshold selection can substantially influence experimental outcomes, as even two closely spaced thresholds may yield divergent results. More critically, the network architecture derived at one threshold may lead to conclusions that differ from those obtained at another. While the rationale behind thresholding—removing weak edges—suggests that stable effects are most likely to be observed at higher thresholds where spurious connections are minimized, our results demonstrate that detectable effects may also arise at considerably lower thresholds. These observations highlight the necessity for a deliberate, evidence-based approach to threshold selection in network analyses.
In addition to demonstrating the general methodological impact of thresholding, our study directly examined how threshold choice influences the detection of SZ-related alterations in structural connectivity. This disease–threshold interaction has rarely been assessed explicitly in prior work, where most SZ connectome studies have relied on a single threshold or weighting scheme. Recent SZ connectome studies and meta-analyses have consistently reported widespread dysconnectivity, including reduced global integration, altered segregation, and disruptions in large-scale structural organization (Brandl et al., 2019; Drakesmith et al., 2015; Gao et al., 2023; Keyvanfard et al., 2023; Zhu et al., 2022). Our findings are broadly aligned with prior literature in demonstrating lower values of graph-theoretical measures—such as node degree, clustering coefficient, and global efficiency—in patients with SZ. Notably, reductions in node degree and density-weighted network measures suggest impaired large-scale brain network integration, which may be clinically relevant given their established links to cognitive and functional deficits in SZ. However, our results also revealed that the detectability and magnitude of these group differences depend strongly on the chosen thresholding strategy. This observation is consistent with methodological work demonstrating that graph metrics are highly sensitive to network density, pruning decisions, and weighting choices (Buchanan et al., 2020; Smucny et al., 2016; van Wijk et al., 2010; Wang et al., 2020; Zalesky et al., 2016). By integrating these two lines of evidence, our study extends existing SZ findings by explicitly showing that thresholding not only shapes network topology in general but also modulates whether—and under which analytical conditions—SZ-related alterations become statistically observable. These findings highlight the importance of considering threshold selection as a key analytical factor when interpreting group differences in structural connectome studies.
Our results (Figure 2 and 3) showed that node degree and global efficiency generally exhibit a smooth, gradual decline as the threshold increases. In contrast, the clustering coefficient displays a more complex and, in some cases, distinctly irregular pattern of change. Its relationship with threshold values is non-monotonic and does not consistently follow a straightforward trend, reflecting the combined influence of factors, such as the underlying network topology, the specific threshold applied, and inherent random variability (Lacy & Robinson, 2020). Previous studies have reported that the clustering coefficient may exhibit a plateau at intermediate threshold levels (Adamovich et al., 2022) or present a peak within a specific range of similarity thresholds before declining (Zahoránszky-Kőhalmi et al., 2016). Based on these observations, we recommend avoiding reliance on the clustering coefficient as a sole metric for result interpretation, and instead considering it alongside other complementary network measures.
According to our results, the thresholding procedure leads to substantial variability in the data. Overall, we found that:
1. Global graph metrics vary as a function of threshold level. Low and high threshold values do not change these metrics in the same way.
2. The chosen threshold may influence the outcome of the analysis (e.g. the presence or absence of the effect of group comparisons). In other words, identifying significant differences between patient and healthy groups is affected by network weighting and thresholding.
3. Finding significant differences is more robust under proportional thresholding.
4. The trend of graph metric variation provides evidence that proportional thresholding produces a similar reduction trend across different network weightings.
5. Construction of the SC matrix based on density weighting led to the observation of more significant differences between SZ and HC groups.
6. Threshold value has a stronger effect on results compared to the threshold approach.
7. Proportional thresholding was associated with lower standard error compared to absolute thresholding, indicating reduced variability in graph metrics.
Our study was mostly limited by the small size of the dataset. A larger dataset may lead to more reliable results. Furthermore, the effect of other thresholding approaches, such as consistency-thresholding (Roberts et al., 2017), can also be investigated. This research can also be extended to investigate the correlation between different network weightings (and thresholding methods) and demographic information, such as age or clinical measures of cognitive function, in a larger dataset.
We acknowledge that no correction for multiple comparisons across threshold levels was applied. Because threshold-dependent graph metrics are highly correlated and reflect variations of the same underlying connectivity structure, applying conventional corrections would severely reduce sensitivity. Future studies with larger samples may benefit from approaches specifically designed for dependence across thresholds (e.g. cluster-based or functional data analysis methods).
Conclusion
In conclusion, this study underscores the pivotal role of threshold selection in determining the outcomes of network-based analyses. Our results revealed that the threshold level has a more pronounced impact on graph-theoretical metrics than the specific thresholding algorithm employed. Given that threshold selection is often arbitrary and lacks strong theoretical justification, it introduces an additional layer of uncertainty into results—particularly in a field that is already characterized by considerable variability. Importantly, we also showed that applying density-based network weighting enhances the sensitivity of graph metrics to alterations in brain network organization, thereby offering a more robust means of detecting connectivity changes in neuropsychiatric disorders, such as SZ. These insights highlight the necessity for rigorous methodological standardization and transparent reporting of thresholding parameters to improve the reproducibility and interpretability of connectome studies.
Ethical Considerations
Compliance with ethical guidelines
All ethical principles were considered in this study. The original data collection, which we have used, involved human participants who were informed of the research purpose and procedures, provided written consent, were assured of confidentiality, and could withdraw at any time, in accordance with the Helsinki Convention. This secondary analysis of publicly available data was approved by the Ethics Committee of Clinical Research of the Faculty of Biology and Medicine, University of Lausanne, Switzerland (Codes: #82/14, #382/11, #26.4.2005). The present article is a retrospective analysis with no direct human or animal sample.
Funding
This research did not receive any grant from funding agencies in the public, commercial, or non-profit sectors.
Conflict of interest
The author declared no conflict of interest.
Acknowledgments
The author gratefully acknowledges the use of the structural and functional Connectome Dataset provided by the Service of General Psychiatry at the Lausanne University Hospital (CHUV).
References
Achard, S., & Bullmore, E. (2007). Efficiency and cost of economical brain functional networks. PLoS Computational Biology, 3(2), e17. [DOI:10.1371/journal.pcbi.0030017] [PMID]
Adamovich, T., Zakharov, I., Tabueva, A., & Malykh, S. (2022). The thresholding problem and variability in the EEG graph network parameters. Scientific Reports, 12(1), 18659. [DOI:10.1038/s41598-022-22079-2] [PMID]
Agosta, F., Galantucci, S., Riva, N., Chiò, A., Messina, S., & Iannaccone, S., et al. (2014). Intrahemispheric and interhemispheric structural network abnormalities in PLS and ALS. Human Brain Mapping, 35(4), 1710–1722. [DOI:10.1002/hbm.22286] [PMID]
American Psychiatric Association. (2000). Diagnostic and statistical manual of mental disorders: Text revision. 4th Edition, Washington DC: American Psychiatric Association. [Link]
Bassett, D. S., Bullmore, E. T., Meyer-Lindenberg, A., Apud, J. A., Weinberger, D. R., & Coppola, R. (2009). Cognitive fitness of cost-efficient brain functional networks. Proceedings of The National Academy of Sciences of the United States of America, 106(28), 11747-11752. [DOI:10.1073/pnas.0903641106] [PMID]
Brandl, F., Avram, M., Weise, B., Shang, J., Simões, B., & Bertram, T., et al. (2019). Specific substantial dysconnectivity in schizophrenia: A transdiagnostic multimodal meta-analysis of resting-state functional and structural magnetic resonance imaging studies. Biological Psychiatry, 85(7), 573-583. [DOI:10.1016/j.biopsych.2018.12.003] [PMID]
Buchanan, C. R., Bastin, M. E., Ritchie, S. J., Liewald, D. C., Madole, J. W., & Tucker-Drob, E. M., et al. (2020). The effect of network thresholding and weighting on structural brain networks in the UK Biobank. NeuroImage, 211, 116443. [DOI:10.1016/j.neuroimage.2019.116443] [PMID]
Cammoun, L., Gigandet, X., Meskaldji, D., Thiran, J. P., Sporns, O., & Do, K. Q., et al. (2012). Mapping the human connectome at multiple scales with diffusion spectrum MRI. Journal of Neuroscience Methods, 203(2), 386-397. [DOI:10.1016/j.jneumeth.2011.09.031] [PMID]
Civier, O., Smith, R. E., Yeh, C. H., Connelly, A., & Calamante, F. (2019). Is removal of weak connections necessary for graph-theoretical analysis of dense weighted structural connectomes from diffusion MRI? NeuroImage, 194, 68-81. [DOI:10.1016/j.neuroimage.2019.02.039] [PMID]
Collin, G., Sporns, O., Mandl, R. C. W., & Van Den Heuvel, M. P. (2014). Structural and functional aspects relating to cost and benefit of rich club organization in the human cerebral cortex. Cerebral Cortex, 24(9), 2258-2267. [DOI:10.1093/cercor/bht064] [PMID]
de Reus, M. A., & van den Heuvel, M. P. (2013). Estimating false positives and negatives in brain networks. NeuroImage, 70, 402-409. [DOI:10.1016/j.neuroimage.2012.12.066] [PMID]
Desikan, R. S., Ségonne, F., Fischl, B., Quinn, B. T., Dickerson, B. C., & Blacker, D., et al. (2006). An automated labeling system for subdividing the human cerebral cortex on MRI scans into gyral based regions of interest. NeuroImage, 31(3), 968-980. [DOI:10.1016/j.neuroimage.2006.01.021] [PMID]
Drakesmith, M., Caeyenberghs, K., Dutt, A., Zammit, S., Evans, C. J., & Reichenberg, A., et al. (2015). Schizophrenia-like topological changes in the structural connectome of individuals with subclinical psychotic experiences. Human Brain Mapping, 36(7), 2629–2643. [DOI:10.1002/HBM.22796] [PMID]
Fornito, A., Zalesky, A., & Bullmore, E. (2016). Fundamentals of brain network analysis. New York: Academic press. [Link]
Gao, Z., Xiao, Y., Zhu, F., Tao, B., Yu, W., & Lui, S. (2023). The whole-brain connectome landscape in patients with schizophrenia: A systematic review and meta-analysis of graph theoretical characteristics. Neuroscience & Biobehavioral Reviews, 148, 105144. [DOI:10.1016/j.neubiorev.2023.105144] [PMID]
Ginestet, C. E., Nichols, T. E., Bullmore, E. T., & Simmons, A. (2011). Brain network analysis: separating cost from topology using cost-integration. Plos One, 6(7), e21570. [DOI:10.1371/journal.pone.0021570] [PMID]
Hagmann, P., Cammoun, L., Gigandet, X., Meuli, R., Honey, C. J., & Van Wedeen, J., et al. (2008a). Mapping the structural core of human cerebral cortex. PLoS Biology, 6(7), e159. [DOI:10.1371/journal.pbio.0060159] [PMID]
Hagmann, P., Cammoun, L., Gigandet, X., Meuli, R., Honey, C. J., & Van Wedeen, J., et al. (2008b). Mapping the structural core of human cerebral cortex. PLoS Biology, 6(7), 1479-1493. [DOI:10.1371/journal.pbio.0060159] [PMID]
Hagmann, P., Kurant, M., Gigandet, X., Thiran, P., Wedeen, V. J., & Meuli, R., et al. (2007). Mapping human whole-brain structural networks with diffusion MRI. Plos One, 2(7), e597. [DOI:10.1371/journal.pone.0000597] [PMID]
Hany M, Rizvi A. Schizophrenia. [Updated 2024 Feb 23]. In: StatPearls [Internet]. Treasure Island (FL): StatPearls Publishing; 2026 Jan-. Available from: [Link]
Jalili, M. (2016). Functional Brain Networks: Does the Choice of Dependency Estimator and Binarization Method Matter? Scientific Reports, 6, 29780. [PMID]
Jbabdi, S., & Johansen-Berg, H. (2011). Tractography: Where do we go from here? Brain Connectivity, 1(3), 169-183. [DOI:10.1089/brain.2011.0033] [PMID]
Keyvanfard, F., Schmid, A. K., & Moghaddam, A. N. (2023). Functional connectivity alterations of within and between networks in schizophrenia: A retrospective study. Basic and Clinical Neuroscience, 14(3), 397-410. [DOI:10.32598/bcn.2022.3928.2] [PMID]
Konrad, A., & Winterer, G. (2008). Disturbed structural connectivity in schizophrenia-primary factor in pathology or epiphenomenon? Schizophrenia Bulletin, 34(1), 72-92. [DOI:10.1093/SCHBUL/SBM034] [PMID]
Lacy, T. C., & Robinson, P. A. (2020). Effects of parcellation and threshold on brain connectivity measures. Plos One, 15(10), e0239717. [DOI:10.1371/journal.pone.0239717] [PMID]
Latora, V., & Marchiori, M. (2003). Economic small-world behavior in weighted networks. The European Physical Journal B - Condensed Matter and Complex Systems, 32(2), 249-263. [DOI:10.1140/EPJB/E2003-00095-5]
Latora, Vito, & Marchiori, M. (2001). Efficient behavior of small-world networks. Physical Review Letters, 87(19), 198701. [DOI:10.1103/physrevlett.87.198701] [PMID]
Maier-Hein, K. H., Neher, P. F., Houde, J. C., Côté, M. A., Garyfallidis, E., & Zhong, J., et al. (2017). The challenge of mapping the human connectome based on diffusion tractography. Nature Communications, 8(1), 1349. [PMID]
Mori, S., Oishi, K., & Faria, A. V. (2009). White matter atlases based on diffusion tensor imaging. Current Opinion in Neurology, 22(4), 362-369. [DOI:10.1097/wco.0b013e32832d954b] [PMID]
Onnela, J.-P., Saramäki, J., Kertész, J., & Kaski, K. (2005). Intensity and coherence of motifs in weighted complex networks. Physical Review. E, Statistical, Nonlinear, and Soft Matter Physics, 71(6 Pt 2), 065103. [DOI:10.1103/PhysRevE.71.065103] [PMID]
Porcu, M., Cocco, L., Puig, J., Mannelli, L., Yang, Q., & Suri, J. S., et al. (2021). Global fractional anisotropy: effect on resting-state neural activity and brain networking in healthy participants. Neuroscience, 472, 103-115. [DOI:10.1016/j.neuroscience.2021.07.021] [PMID]
Preisig, M., Fenton, B. T., Matthey, M. L., Berney, A., & Ferrero, F. (1999). Diagnostic interview for genetic studies (DIGS): Inter-rater and test-retest reliability of the French version. European Archives of Psychiatry and Clinical Neuroscience, 249(4), 174-179. [DOI:10.1007/s004060050084] [PMID]
Roberts, J. A., Perry, A., Roberts, G., Mitchell, P. B., & Breakspear, M. (2017). Consistency-based thresholding of the human connectome. NeuroImage, 145(Pt A), 118–129. [DOI:10.1016/j.neuroimage.2016.09.053] [PMID]
Robinson, E. C., Hammers, A., Ericsson, A., Edwards, A. D., & Rueckert, D. (2010). Identifying population differences in whole-brain structural networks: A machine learning approach. NeuroImage, 50(3), 910-919. [DOI:10.1016/j.neuroimage.2010.01.019] [PMID]
Rubinov, M., & Sporns, O. (2010). Complex network measures of brain connectivity: Uses and interpretations. NeuroImage, 52(3), 1059–1069. [DOI:10.1016/j.neuroimage.2009.10.003] [PMID]
Samartzis, L., Dima, D., Fusar-Poli, P., & Kyriakopoulos, M. (2014). White matter alterations in early stages of schizophrenia: A systematic review of diffusion tensor imaging studies. Journal of Neuroimaging, 24(2), 101-110. [DOI:10.1111/j.1552-6569.2012.00779.x] [PMID]
Smucny, J., Olincy, A., & Tregellas, J. R. (2016). Nicotine restores functional connectivity of the ventral attention network in schizophrenia. Neuropharmacology, 108, 144-151. [DOI:10.1016/j.neuropharm.2016.04.015] [PMID]
Sotiropoulos, S. N., & Zalesky, A. (2019). Building connectomes using diffusion MRI: Why, how and but. Nmr in Biomedicine, 32(4), e3752. [DOI:10.1002/nbm.3752] [PMID]
Sporns, O., Tononi, G., & Kötter, R. (2005). The human connectome: A structural description of the human brain. PLoS Computational Biology, 1(4), e42. [DOI:10.1371/journal.pcbi.0010042] [PMID]
Thomas, C., Ye, F. Q., Irfanoglu, M. O., Modi, P., Saleem, K. S., Leopold, D. A., & Pierpaoli, C. (2014). Anatomical accuracy of brain connections derived from diffusion MRI tractography is inherently limited. Proceedings of the National Academy of Sciences of the United States of America, 111(46), 16574-16579. [DOI:10.1073/pnas.1405672111] [PMID]
van den Heuvel, M. P., Stam, C. J., Boersma, M., & Hulshoff Pol, H. E. (2008). Small-world and scale-free organization of voxel-based resting-state functional connectivity in the human brain. NeuroImage, 43(3), 528-539. [DOI:10.1016/j.neuroimage.2008.08.010] [PMID]
van Wijk, B. C. M., Stam, C. J., & Daffertshofer, A. (2010). Comparing brain networks of different size and connectivity density using graph theory. Plos One, 5(10), e13701. [DOI:10.1371/journal.pone.0013701] [PMID]
Verstraete, E., Veldink, J. H., Mandl, R. C., van den Berg, L. H., & van den Heuvel, M. P. (2011). Impaired structural motor connectome in amyotrophic lateral sclerosis. Plos One, 6(9), e24239. [DOI:10.1371/journal.pone.0024239] [PMID]
Vohryzek, J., Aleman-Gomez, Y., Griffa, A., Raoul, J., Cleusix, M., & Baumann, P. S., et al. (2020). Structural and functional connectomes from 27 schizophrenic patients and 27 matched healthy adults. Zenodo. [DOI:10.5281/ZENODO.3758534]
GBD 2016 Disease and Injury Incidence and Prevalence Collaborators (2017). Global, regional, and national incidence, prevalence, and years lived with disability for 328 diseases and injuries for 195 countries, 1990-2016: A systematic analysis for the Global Burden of Disease Study 2016. The Lancet, 390(10100), 1211-1259. [DOI:10.1016/S0140-6736(17)32154-2] [PMID]
Wang, Y., Wei, Y., Edmiston, E. K., Womer, F. Y., Zhang, X., & Duan, J., et al. (2020). Altered structural connectivity and cytokine levels in schizophrenia and genetic high-risk individuals: Associations with disease states and vulnerability. Schizophrenia Research, 223, 158-165. [DOI:10.1016/J.SCHRES.2020.05.044] [PMID]
Yeh, F. C., Panesar, S., Fernandes, D., Meola, A., Yoshino, M., & Fernandez-Miranda, J. C., et al. (2018). Population-averaged atlas of the macroscale human structural connectome and its network topology. NeuroImage, 178, 57. [DOI:10.1016/j.neuroimage.2018.05.027] [PMID]
Zahoránszky-Kőhalmi, G., Bologa, C. G., & Oprea, T. I. (2016). Impact of similarity threshold on the topology of molecular similarity networks and clustering outcomes. Journal of Cheminformatics, 8, 16. [DOI:10.1186/s13321-016-0127-5] [PMID]
Zalesky, A., & Fornito, A. (2009). A DTI-derived measure of cortico-cortical connectivity. IEEE Transactions on Medical Imaging, 28(7), 1023-1036. [DOI:10.1109/tmi.2008.2012113] [PMID]
Zalesky, A., Fornito, A., Cocchi, L., Gollo, L. L., van den Heuvel, M. P., & Breakspear, M. (2016). Connectome sensitivity or specificity: Which is more important? NeuroImage, 142, 407-420. [DOI:10.1016/j.neuroimage.2016.06.035] [PMID]
Zhu, T., Wang, Z., Zhou, C., Fang, X., Huang, C., & Xie, C., et al. (2022). Meta-analysis of structural and functional brain abnormalities in schizophrenia with persistent negative symptoms using activation likelihood estimation. Frontiers in Psychiatry, 13, 957685. [DOI:10.3389/fpsyt.2022.957685] [PMID]
Discussion
We investigated how different network thresholding strategies and edge-weighting schemes influence variations in graph metrics derived from structural connectivity matrices. Our findings indicated that in the absence of thresholding, no statistically significant differences emerged between the SZ group and HCs. However, eliminating spurious connections substantially altered the analytical outcomes.
Variations in network topology and graph-derived metrics across different threshold levels are particularly relevant in the context of the well-recognized reproducibility crisis in contemporary science, which complicates the comparability of studies employing diverse analytical pipelines (Adamovich et al., 2022; Buchanan et al., 2020). Our findings emphasize that threshold selection can substantially influence experimental outcomes, as even two closely spaced thresholds may yield divergent results. More critically, the network architecture derived at one threshold may lead to conclusions that differ from those obtained at another. While the rationale behind thresholding—removing weak edges—suggests that stable effects are most likely to be observed at higher thresholds where spurious connections are minimized, our results demonstrate that detectable effects may also arise at considerably lower thresholds. These observations highlight the necessity for a deliberate, evidence-based approach to threshold selection in network analyses.
In addition to demonstrating the general methodological impact of thresholding, our study directly examined how threshold choice influences the detection of SZ-related alterations in structural connectivity. This disease–threshold interaction has rarely been assessed explicitly in prior work, where most SZ connectome studies have relied on a single threshold or weighting scheme. Recent SZ connectome studies and meta-analyses have consistently reported widespread dysconnectivity, including reduced global integration, altered segregation, and disruptions in large-scale structural organization (Brandl et al., 2019; Drakesmith et al., 2015; Gao et al., 2023; Keyvanfard et al., 2023; Zhu et al., 2022). Our findings are broadly aligned with prior literature in demonstrating lower values of graph-theoretical measures—such as node degree, clustering coefficient, and global efficiency—in patients with SZ. Notably, reductions in node degree and density-weighted network measures suggest impaired large-scale brain network integration, which may be clinically relevant given their established links to cognitive and functional deficits in SZ. However, our results also revealed that the detectability and magnitude of these group differences depend strongly on the chosen thresholding strategy. This observation is consistent with methodological work demonstrating that graph metrics are highly sensitive to network density, pruning decisions, and weighting choices (Buchanan et al., 2020; Smucny et al., 2016; van Wijk et al., 2010; Wang et al., 2020; Zalesky et al., 2016). By integrating these two lines of evidence, our study extends existing SZ findings by explicitly showing that thresholding not only shapes network topology in general but also modulates whether—and under which analytical conditions—SZ-related alterations become statistically observable. These findings highlight the importance of considering threshold selection as a key analytical factor when interpreting group differences in structural connectome studies.
Our results (Figure 2 and 3) showed that node degree and global efficiency generally exhibit a smooth, gradual decline as the threshold increases. In contrast, the clustering coefficient displays a more complex and, in some cases, distinctly irregular pattern of change. Its relationship with threshold values is non-monotonic and does not consistently follow a straightforward trend, reflecting the combined influence of factors, such as the underlying network topology, the specific threshold applied, and inherent random variability (Lacy & Robinson, 2020). Previous studies have reported that the clustering coefficient may exhibit a plateau at intermediate threshold levels (Adamovich et al., 2022) or present a peak within a specific range of similarity thresholds before declining (Zahoránszky-Kőhalmi et al., 2016). Based on these observations, we recommend avoiding reliance on the clustering coefficient as a sole metric for result interpretation, and instead considering it alongside other complementary network measures.
According to our results, the thresholding procedure leads to substantial variability in the data. Overall, we found that:
1. Global graph metrics vary as a function of threshold level. Low and high threshold values do not change these metrics in the same way.
2. The chosen threshold may influence the outcome of the analysis (e.g. the presence or absence of the effect of group comparisons). In other words, identifying significant differences between patient and healthy groups is affected by network weighting and thresholding.
3. Finding significant differences is more robust under proportional thresholding.
4. The trend of graph metric variation provides evidence that proportional thresholding produces a similar reduction trend across different network weightings.
5. Construction of the SC matrix based on density weighting led to the observation of more significant differences between SZ and HC groups.
6. Threshold value has a stronger effect on results compared to the threshold approach.
7. Proportional thresholding was associated with lower standard error compared to absolute thresholding, indicating reduced variability in graph metrics.
Our study was mostly limited by the small size of the dataset. A larger dataset may lead to more reliable results. Furthermore, the effect of other thresholding approaches, such as consistency-thresholding (Roberts et al., 2017), can also be investigated. This research can also be extended to investigate the correlation between different network weightings (and thresholding methods) and demographic information, such as age or clinical measures of cognitive function, in a larger dataset.
We acknowledge that no correction for multiple comparisons across threshold levels was applied. Because threshold-dependent graph metrics are highly correlated and reflect variations of the same underlying connectivity structure, applying conventional corrections would severely reduce sensitivity. Future studies with larger samples may benefit from approaches specifically designed for dependence across thresholds (e.g. cluster-based or functional data analysis methods).
Conclusion
In conclusion, this study underscores the pivotal role of threshold selection in determining the outcomes of network-based analyses. Our results revealed that the threshold level has a more pronounced impact on graph-theoretical metrics than the specific thresholding algorithm employed. Given that threshold selection is often arbitrary and lacks strong theoretical justification, it introduces an additional layer of uncertainty into results—particularly in a field that is already characterized by considerable variability. Importantly, we also showed that applying density-based network weighting enhances the sensitivity of graph metrics to alterations in brain network organization, thereby offering a more robust means of detecting connectivity changes in neuropsychiatric disorders, such as SZ. These insights highlight the necessity for rigorous methodological standardization and transparent reporting of thresholding parameters to improve the reproducibility and interpretability of connectome studies.
Ethical Considerations
Compliance with ethical guidelines
All ethical principles were considered in this study. The original data collection, which we have used, involved human participants who were informed of the research purpose and procedures, provided written consent, were assured of confidentiality, and could withdraw at any time, in accordance with the Helsinki Convention. This secondary analysis of publicly available data was approved by the Ethics Committee of Clinical Research of the Faculty of Biology and Medicine, University of Lausanne, Switzerland (Codes: #82/14, #382/11, #26.4.2005). The present article is a retrospective analysis with no direct human or animal sample.
Funding
This research did not receive any grant from funding agencies in the public, commercial, or non-profit sectors.
Conflict of interest
The author declared no conflict of interest.
Acknowledgments
The author gratefully acknowledges the use of the structural and functional Connectome Dataset provided by the Service of General Psychiatry at the Lausanne University Hospital (CHUV).
References
Achard, S., & Bullmore, E. (2007). Efficiency and cost of economical brain functional networks. PLoS Computational Biology, 3(2), e17. [DOI:10.1371/journal.pcbi.0030017] [PMID]
Adamovich, T., Zakharov, I., Tabueva, A., & Malykh, S. (2022). The thresholding problem and variability in the EEG graph network parameters. Scientific Reports, 12(1), 18659. [DOI:10.1038/s41598-022-22079-2] [PMID]
Agosta, F., Galantucci, S., Riva, N., Chiò, A., Messina, S., & Iannaccone, S., et al. (2014). Intrahemispheric and interhemispheric structural network abnormalities in PLS and ALS. Human Brain Mapping, 35(4), 1710–1722. [DOI:10.1002/hbm.22286] [PMID]
American Psychiatric Association. (2000). Diagnostic and statistical manual of mental disorders: Text revision. 4th Edition, Washington DC: American Psychiatric Association. [Link]
Bassett, D. S., Bullmore, E. T., Meyer-Lindenberg, A., Apud, J. A., Weinberger, D. R., & Coppola, R. (2009). Cognitive fitness of cost-efficient brain functional networks. Proceedings of The National Academy of Sciences of the United States of America, 106(28), 11747-11752. [DOI:10.1073/pnas.0903641106] [PMID]
Brandl, F., Avram, M., Weise, B., Shang, J., Simões, B., & Bertram, T., et al. (2019). Specific substantial dysconnectivity in schizophrenia: A transdiagnostic multimodal meta-analysis of resting-state functional and structural magnetic resonance imaging studies. Biological Psychiatry, 85(7), 573-583. [DOI:10.1016/j.biopsych.2018.12.003] [PMID]
Buchanan, C. R., Bastin, M. E., Ritchie, S. J., Liewald, D. C., Madole, J. W., & Tucker-Drob, E. M., et al. (2020). The effect of network thresholding and weighting on structural brain networks in the UK Biobank. NeuroImage, 211, 116443. [DOI:10.1016/j.neuroimage.2019.116443] [PMID]
Cammoun, L., Gigandet, X., Meskaldji, D., Thiran, J. P., Sporns, O., & Do, K. Q., et al. (2012). Mapping the human connectome at multiple scales with diffusion spectrum MRI. Journal of Neuroscience Methods, 203(2), 386-397. [DOI:10.1016/j.jneumeth.2011.09.031] [PMID]
Civier, O., Smith, R. E., Yeh, C. H., Connelly, A., & Calamante, F. (2019). Is removal of weak connections necessary for graph-theoretical analysis of dense weighted structural connectomes from diffusion MRI? NeuroImage, 194, 68-81. [DOI:10.1016/j.neuroimage.2019.02.039] [PMID]
Collin, G., Sporns, O., Mandl, R. C. W., & Van Den Heuvel, M. P. (2014). Structural and functional aspects relating to cost and benefit of rich club organization in the human cerebral cortex. Cerebral Cortex, 24(9), 2258-2267. [DOI:10.1093/cercor/bht064] [PMID]
de Reus, M. A., & van den Heuvel, M. P. (2013). Estimating false positives and negatives in brain networks. NeuroImage, 70, 402-409. [DOI:10.1016/j.neuroimage.2012.12.066] [PMID]
Desikan, R. S., Ségonne, F., Fischl, B., Quinn, B. T., Dickerson, B. C., & Blacker, D., et al. (2006). An automated labeling system for subdividing the human cerebral cortex on MRI scans into gyral based regions of interest. NeuroImage, 31(3), 968-980. [DOI:10.1016/j.neuroimage.2006.01.021] [PMID]
Drakesmith, M., Caeyenberghs, K., Dutt, A., Zammit, S., Evans, C. J., & Reichenberg, A., et al. (2015). Schizophrenia-like topological changes in the structural connectome of individuals with subclinical psychotic experiences. Human Brain Mapping, 36(7), 2629–2643. [DOI:10.1002/HBM.22796] [PMID]
Fornito, A., Zalesky, A., & Bullmore, E. (2016). Fundamentals of brain network analysis. New York: Academic press. [Link]
Gao, Z., Xiao, Y., Zhu, F., Tao, B., Yu, W., & Lui, S. (2023). The whole-brain connectome landscape in patients with schizophrenia: A systematic review and meta-analysis of graph theoretical characteristics. Neuroscience & Biobehavioral Reviews, 148, 105144. [DOI:10.1016/j.neubiorev.2023.105144] [PMID]
Ginestet, C. E., Nichols, T. E., Bullmore, E. T., & Simmons, A. (2011). Brain network analysis: separating cost from topology using cost-integration. Plos One, 6(7), e21570. [DOI:10.1371/journal.pone.0021570] [PMID]
Hagmann, P., Cammoun, L., Gigandet, X., Meuli, R., Honey, C. J., & Van Wedeen, J., et al. (2008a). Mapping the structural core of human cerebral cortex. PLoS Biology, 6(7), e159. [DOI:10.1371/journal.pbio.0060159] [PMID]
Hagmann, P., Cammoun, L., Gigandet, X., Meuli, R., Honey, C. J., & Van Wedeen, J., et al. (2008b). Mapping the structural core of human cerebral cortex. PLoS Biology, 6(7), 1479-1493. [DOI:10.1371/journal.pbio.0060159] [PMID]
Hagmann, P., Kurant, M., Gigandet, X., Thiran, P., Wedeen, V. J., & Meuli, R., et al. (2007). Mapping human whole-brain structural networks with diffusion MRI. Plos One, 2(7), e597. [DOI:10.1371/journal.pone.0000597] [PMID]
Hany M, Rizvi A. Schizophrenia. [Updated 2024 Feb 23]. In: StatPearls [Internet]. Treasure Island (FL): StatPearls Publishing; 2026 Jan-. Available from: [Link]
Jalili, M. (2016). Functional Brain Networks: Does the Choice of Dependency Estimator and Binarization Method Matter? Scientific Reports, 6, 29780. [PMID]
Jbabdi, S., & Johansen-Berg, H. (2011). Tractography: Where do we go from here? Brain Connectivity, 1(3), 169-183. [DOI:10.1089/brain.2011.0033] [PMID]
Keyvanfard, F., Schmid, A. K., & Moghaddam, A. N. (2023). Functional connectivity alterations of within and between networks in schizophrenia: A retrospective study. Basic and Clinical Neuroscience, 14(3), 397-410. [DOI:10.32598/bcn.2022.3928.2] [PMID]
Konrad, A., & Winterer, G. (2008). Disturbed structural connectivity in schizophrenia-primary factor in pathology or epiphenomenon? Schizophrenia Bulletin, 34(1), 72-92. [DOI:10.1093/SCHBUL/SBM034] [PMID]
Lacy, T. C., & Robinson, P. A. (2020). Effects of parcellation and threshold on brain connectivity measures. Plos One, 15(10), e0239717. [DOI:10.1371/journal.pone.0239717] [PMID]
Latora, V., & Marchiori, M. (2003). Economic small-world behavior in weighted networks. The European Physical Journal B - Condensed Matter and Complex Systems, 32(2), 249-263. [DOI:10.1140/EPJB/E2003-00095-5]
Latora, Vito, & Marchiori, M. (2001). Efficient behavior of small-world networks. Physical Review Letters, 87(19), 198701. [DOI:10.1103/physrevlett.87.198701] [PMID]
Maier-Hein, K. H., Neher, P. F., Houde, J. C., Côté, M. A., Garyfallidis, E., & Zhong, J., et al. (2017). The challenge of mapping the human connectome based on diffusion tractography. Nature Communications, 8(1), 1349. [PMID]
Mori, S., Oishi, K., & Faria, A. V. (2009). White matter atlases based on diffusion tensor imaging. Current Opinion in Neurology, 22(4), 362-369. [DOI:10.1097/wco.0b013e32832d954b] [PMID]
Onnela, J.-P., Saramäki, J., Kertész, J., & Kaski, K. (2005). Intensity and coherence of motifs in weighted complex networks. Physical Review. E, Statistical, Nonlinear, and Soft Matter Physics, 71(6 Pt 2), 065103. [DOI:10.1103/PhysRevE.71.065103] [PMID]
Porcu, M., Cocco, L., Puig, J., Mannelli, L., Yang, Q., & Suri, J. S., et al. (2021). Global fractional anisotropy: effect on resting-state neural activity and brain networking in healthy participants. Neuroscience, 472, 103-115. [DOI:10.1016/j.neuroscience.2021.07.021] [PMID]
Preisig, M., Fenton, B. T., Matthey, M. L., Berney, A., & Ferrero, F. (1999). Diagnostic interview for genetic studies (DIGS): Inter-rater and test-retest reliability of the French version. European Archives of Psychiatry and Clinical Neuroscience, 249(4), 174-179. [DOI:10.1007/s004060050084] [PMID]
Roberts, J. A., Perry, A., Roberts, G., Mitchell, P. B., & Breakspear, M. (2017). Consistency-based thresholding of the human connectome. NeuroImage, 145(Pt A), 118–129. [DOI:10.1016/j.neuroimage.2016.09.053] [PMID]
Robinson, E. C., Hammers, A., Ericsson, A., Edwards, A. D., & Rueckert, D. (2010). Identifying population differences in whole-brain structural networks: A machine learning approach. NeuroImage, 50(3), 910-919. [DOI:10.1016/j.neuroimage.2010.01.019] [PMID]
Rubinov, M., & Sporns, O. (2010). Complex network measures of brain connectivity: Uses and interpretations. NeuroImage, 52(3), 1059–1069. [DOI:10.1016/j.neuroimage.2009.10.003] [PMID]
Samartzis, L., Dima, D., Fusar-Poli, P., & Kyriakopoulos, M. (2014). White matter alterations in early stages of schizophrenia: A systematic review of diffusion tensor imaging studies. Journal of Neuroimaging, 24(2), 101-110. [DOI:10.1111/j.1552-6569.2012.00779.x] [PMID]
Smucny, J., Olincy, A., & Tregellas, J. R. (2016). Nicotine restores functional connectivity of the ventral attention network in schizophrenia. Neuropharmacology, 108, 144-151. [DOI:10.1016/j.neuropharm.2016.04.015] [PMID]
Sotiropoulos, S. N., & Zalesky, A. (2019). Building connectomes using diffusion MRI: Why, how and but. Nmr in Biomedicine, 32(4), e3752. [DOI:10.1002/nbm.3752] [PMID]
Sporns, O., Tononi, G., & Kötter, R. (2005). The human connectome: A structural description of the human brain. PLoS Computational Biology, 1(4), e42. [DOI:10.1371/journal.pcbi.0010042] [PMID]
Thomas, C., Ye, F. Q., Irfanoglu, M. O., Modi, P., Saleem, K. S., Leopold, D. A., & Pierpaoli, C. (2014). Anatomical accuracy of brain connections derived from diffusion MRI tractography is inherently limited. Proceedings of the National Academy of Sciences of the United States of America, 111(46), 16574-16579. [DOI:10.1073/pnas.1405672111] [PMID]
van den Heuvel, M. P., Stam, C. J., Boersma, M., & Hulshoff Pol, H. E. (2008). Small-world and scale-free organization of voxel-based resting-state functional connectivity in the human brain. NeuroImage, 43(3), 528-539. [DOI:10.1016/j.neuroimage.2008.08.010] [PMID]
van Wijk, B. C. M., Stam, C. J., & Daffertshofer, A. (2010). Comparing brain networks of different size and connectivity density using graph theory. Plos One, 5(10), e13701. [DOI:10.1371/journal.pone.0013701] [PMID]
Verstraete, E., Veldink, J. H., Mandl, R. C., van den Berg, L. H., & van den Heuvel, M. P. (2011). Impaired structural motor connectome in amyotrophic lateral sclerosis. Plos One, 6(9), e24239. [DOI:10.1371/journal.pone.0024239] [PMID]
Vohryzek, J., Aleman-Gomez, Y., Griffa, A., Raoul, J., Cleusix, M., & Baumann, P. S., et al. (2020). Structural and functional connectomes from 27 schizophrenic patients and 27 matched healthy adults. Zenodo. [DOI:10.5281/ZENODO.3758534]
GBD 2016 Disease and Injury Incidence and Prevalence Collaborators (2017). Global, regional, and national incidence, prevalence, and years lived with disability for 328 diseases and injuries for 195 countries, 1990-2016: A systematic analysis for the Global Burden of Disease Study 2016. The Lancet, 390(10100), 1211-1259. [DOI:10.1016/S0140-6736(17)32154-2] [PMID]
Wang, Y., Wei, Y., Edmiston, E. K., Womer, F. Y., Zhang, X., & Duan, J., et al. (2020). Altered structural connectivity and cytokine levels in schizophrenia and genetic high-risk individuals: Associations with disease states and vulnerability. Schizophrenia Research, 223, 158-165. [DOI:10.1016/J.SCHRES.2020.05.044] [PMID]
Yeh, F. C., Panesar, S., Fernandes, D., Meola, A., Yoshino, M., & Fernandez-Miranda, J. C., et al. (2018). Population-averaged atlas of the macroscale human structural connectome and its network topology. NeuroImage, 178, 57. [DOI:10.1016/j.neuroimage.2018.05.027] [PMID]
Zahoránszky-Kőhalmi, G., Bologa, C. G., & Oprea, T. I. (2016). Impact of similarity threshold on the topology of molecular similarity networks and clustering outcomes. Journal of Cheminformatics, 8, 16. [DOI:10.1186/s13321-016-0127-5] [PMID]
Zalesky, A., & Fornito, A. (2009). A DTI-derived measure of cortico-cortical connectivity. IEEE Transactions on Medical Imaging, 28(7), 1023-1036. [DOI:10.1109/tmi.2008.2012113] [PMID]
Zalesky, A., Fornito, A., Cocchi, L., Gollo, L. L., van den Heuvel, M. P., & Breakspear, M. (2016). Connectome sensitivity or specificity: Which is more important? NeuroImage, 142, 407-420. [DOI:10.1016/j.neuroimage.2016.06.035] [PMID]
Zhu, T., Wang, Z., Zhou, C., Fang, X., Huang, C., & Xie, C., et al. (2022). Meta-analysis of structural and functional brain abnormalities in schizophrenia with persistent negative symptoms using activation likelihood estimation. Frontiers in Psychiatry, 13, 957685. [DOI:10.3389/fpsyt.2022.957685] [PMID]
Type of Study: Original |
Subject:
Computational Neuroscience
Received: 2025/08/13 | Accepted: 2025/12/29 | Published: 2026/03/1
Received: 2025/08/13 | Accepted: 2025/12/29 | Published: 2026/03/1
Send email to the article author
| Rights and permissions | |
 |
This work is licensed under a Creative Commons Attribution-NonCommercial 4.0 International License. |

Copyright © The Author(s);
This is an open access article distributed under the terms of the Creative Commons Attribution License (CC-By-NC), which permits use, distribution, and reproduction in any medium, provided the original work is properly cited and is not used for commercial purposes.
Contact Information