

Volume 16 - Special Issue on Cognitive Sciences
BCN 2025, 16 - Special Issue on Cognitive Sciences: 333-352 |
Back to browse issues page


Download citation:
BibTeX | RIS | EndNote | Medlars | ProCite | Reference Manager | RefWorks
Send citation to:


BibTeX | RIS | EndNote | Medlars | ProCite | Reference Manager | RefWorks
Send citation to:
Sayadnasiri M, Moridian M, Naji B. The Predictive Role of Quantitative Electroencephalography in Evaluation of Responsiveness of Obsessive-compulsive Disorder Patients to Fluvoxamine. BCN 2025; 16 (S1) :333-352
URL: http://bcn.iums.ac.ir/article-1-2532-en.html
URL: http://bcn.iums.ac.ir/article-1-2532-en.html


1- Department of Psychiatry, School of Behavioral Sciences, University of Social Welfare and Rehabilitation Sciences, Tehran, Iran.
2- Institute for Cognitive Science Studies, Pardis, Tehran, Iran.
2- Institute for Cognitive Science Studies, Pardis, Tehran, Iran.
Full-Text [PDF 690 kb]
| Abstract (HTML)
Full-Text:
1. Introduction
Obsessive-compulsive disorder (OCD) is characterized by obsessive intrusive thoughts provoking fearful concerns and leading to rituals that seem to be protective. Although the content of obsessive symptoms may vary based on the cultural, ethnical, and religious contexts, the whole frames have obvious similarities (Rajabi, 2007). Lifelong prevalence of OCD has been estimated to be up to 2%-3% in domestic studies (Salehi et al., 2003). A more recent study has presented the estimation of lifetime and annual prevalence equal to 2.3% and 1.2%, respectively (Ruscio et al., 2010). Some investigators have calculated that around 10% of outpatients in psychiatric clinics are affected by OCD. Accordingly, OCD is the fourth most prevalent psychiatric disorder, after specific phobias, drug-induced disorders, and depressive disorders (Kaplan Sadock, 2003).
Unfortunately, the data about the costs of OCD have not been updated recently. In 1995, DuPont et al. (1995) estimated the direct and indirect costs imposed by OCD via the human capital approach. The calculated total costs were $8.4 billion, equal to 5.7% of the estimated costs related to all mental disorders. The indirect costs that indicate the range of productivity that OCD patients lost were estimated at $6.2 billion. Recent studies stress the considerable amount of hidden costs imposed on payers caused by ineffective treatment or misdiagnosis of OCD and due to care transition (Businesswire, 2021).
For a comprehensive evaluation of the burden imposed by OCD, we must remember the psychological pressure and financial costs imposed on their caregivers. It has been proven that although OCD is less disabling than depressive disorders, their caregivers are more burdened and in need of higher levels of accommodation than the people who care for depressed patients (Vikas et al., 2011). Up to 75% of patients present the early symptoms before 25 and even in childhood, leading to substantial disability-adjusted life years and imposed costs on families and health systems (Sadock & Sadock, 2009).
According to highly variable features of this disorder, different therapeutic methods have been introduced so far, including psychological interventions (such as response prevention and mindfulness) and pharmacotherapy, or their combination (Sadock et al., 2009).
Based on the role of the serotonergic system in the pathogenesis of OCD, selective serotonin reuptake inhibitors are among the most widely used drugs. Fluvoxamine is a member of this group that many clinicians choose as the first choice in the treatment of OCD10, and its efficacy has been approved by The United States Food and Drug Administration (U.S. Food and Drug Administration, 2008).
Although the remission of symptoms soon after the initiation of the trial is a promising signal for responsiveness, the outcomes of pharmaceutical interventions are routinely evaluated after 6 to 12 weeks. The minimum time for assessing responsiveness to the first prescribed selective serotonin reuptake inhibitors (SSRI) is 4 weeks, which would be extended to 6 weeks to evaluate the remission of symptoms. Unfortunately, it is not surprising for a patient to not respond desirably to the first choice of medication (Trivedi et al., 2006). In some cases, achieving the best drug regimen, such as monotherapy or combination, may last up to one year (Rush et al., 2009; Rush, 2007; Keitner et al., 1992). In addition to the longer suffering that they experience, about 26% of the patients who did not experience the ameliorative effects of the first chosen drug will refuse their treatment after two weeks (Warden et al., 2007), and this ratio increases up to 42% on the 30th day (Olfson et al., 2006). According to the socioeconomic consequences of failed antidepressant therapy for OCD, any means that helps in predicting responsiveness would be of high clinical and financial importance (Maron & Nutt, 2015).
Digitalization of electroencephalography has made it possible to work on the correlation between characteristics of waves and other parameters quantitatively. By Fourier Transform, any raw electroencephalographic data obtained from each point could be divided into categorized waves with specific frequency ranges, and each one has its amplitude. Investigations to find any correlation between these detailed data and responsiveness to a particular treatment or prognosis of a condition is the topic of an increasing number of studies on different psychiatric and neurologic disorders, such as depression, drug dependency, psychosis, traumatic brain injuries, and disorders of consciousness (Spronk et al., 2011; Widge et al., 2019; Venneman et al., 2006; van Tricht et al., 2014; Tolonen et al., 2018; Stefan et al., 2018).
Considering what was discussed, we decided to investigate the potential predictive value of quantitative electroencephalographic (QEEG) features in the responsiveness of OCD patients to fluvoxamine. There is no doubt that such a possible correlation would be of high practical importance to designing anticipatory models and individualized treatment plans, leading to diminished suffering of patients and burden on families and health systems.
2. Materials and Methods
This prospective study investigates the predictive power of QEEG features in the responsiveness of OCD patients to fluvoxamine. We included 40 cases from Nezam Mafi University Clinic, University of Social Welfare and Rehabilitation Sciences, Tehran City, Iran. The number of samples was calculated with 95% confidence and 80% statistical power, based on Equation 1. All cases were visited by a board-certified psychiatrist and received the diagnosis of OCD according to DSM-V for the first time. All of them were medication-free until the time of participation in our study. They were informed about the study methods and purposes and their right to quit at any time, and they signed the consent form.
Equation 1:

We applied the Yale-Brown obsessive-compulsive scale (Y-BOCS), Persian edition, to assess the severity of symptoms and responsiveness to treatment at the beginning of the study and 6 weeks after the initiation of therapy. This instrument, which a clinician scores, includes 10 scales and is scored by the Likert system (from 0 to 4 aligned with the severity), ranging between 0 to 40 overall score. According to this scale, scores of 0 to 7, 8 to 15, 16 to 23, 24 to 31, and more than 31 indicate subclinical, mild, moderate, severe, and very severe cases, respectively. Validity and reliability of this scale and its Persian version have been proved desirable (Esfahani et al., 2012; Rabiee et al., 2010). We did not consider any minimum score of Y-BOCS for inclusion in the study because we made our diagnosis clinically, and the differences between pre and post-treatment scores would be the data of comparison.
QEEG was obtained when patients had not used any medication with psychotropic effects for at least 72 hours through the algorithms provided by the American Clinical Neurophysiology Society and Pharmaco-EEG Guidelines. The records were conducted by Nihon Kohden EEG, Neurofax 1200 J/K, under the direct observation of a neurologist. The electrodes were placed based on a 10/20 montage system on O2, O1, T5, T6, P3, P4, P2, T4, T3, C3, C4, C2, F8, F7, F4, F3, F2, FP2, FP1 points in addition to reference and ground electrodes on auricles. The impedances of each electrode were checked and rechecked by an expert technician not to be more than 10 kΩ. The sensitivity was tuned on 7 μV/mm, and low and high-frequency filters (1 and 70 Hz) were activated. Notch filters (60 Hz) were also used if indicated. The recordings were performed between 9 AM and 1 PM to diminish the effects of daily rhythms and feeding on the waves in a semi-sitting position and awake in a silent, slightly lighted room, kept from hindering environmental stimuli. The obtained data were analyzed by NeuroGuide software 2.3.8, which uses the fast Fourier transform (FFT) to assess waves. The primary resting EEG with a closed eye for 5 to 15 minutes was used to evaluate the electrode placements and potential artifacts, and abnormal cases, including epileptical paroxysm and abnormal alpha waves, were considered the exclusion criteria. Then, the main records containing 5 minutes with opened eyes and 5 minutes with closed eyes were taken for the basic analyses. The relative powers of each frequency range (alpha, beta, high beta, theta, and delta) were calculated for all 19 electrodes. The frequencies were analyzed by the software of NeuroGuide™ (Applied Neuroscience, Inc, 2023).
After recording the electroencephalographs, the patients began to take fluvoxamine, 150 to 300 mg per day, per os. Six weeks after treatment, provided that at least two weeks have passed since reaching the maximum dosage (based on clinical symptoms or therapeutic window), the patients were reinvestigated by Y-BOCS. In the analytic phase, the pre-intervention electroencephalographic waves were compared between responders and non-responders. Responders were defined as reducing the severity of symptoms by 50 percent or more. Also, age, gender, and educational level were considered as potential confounding factors.
The patients were assessed for adverse effects during the medication period at the end of the first, second, fourth, and sixth weeks.
Definition of terms
Responder refers to the patients who experienced at least a 50% reduction in symptoms based on the Y-BOCS scores.
EEG frequency bands are the electroencephalic waves categorized based on their frequencies: 1-3 Hz, 4-7 Hz, 8-12 Hz, and 13-25 Hz as alpha, theta, alpha, and beta bands, respectively.
Z score is the difference between the scores of the examinee and the normal population, described as standard deviation. In other words, the Z score indicates how much the patient’s score deviates from the normal population.
Multivariate analysis considers some electrodes next to each other as the indicator of the electroencephalographic activity of that particular locus. These areas include: Left lateral by F7, T3, and T5; left medial by FP1, F3, C3, P3, and O1; left anterior by FP1, F7, and F3; left central by T3 and C3; left posterior by T5, P3 and O1; midline by Fz, Cz, and Pz; right lateral by F8, T4, and T6; right medial by FP2, F4, C4, P4 and O2; right anterior by FP2, F8 and F4; right central by T4 and C4; and right posterior by T6, P4 and O2. In multivariate analysis, the Z score indicates deviation from the means among the normal population.
The inclusion criteria were aged between 18 and 65, diagnosis of obsessive-compulsive disorder based on DSM-V, and volunteer attendance in the study.
The exclusion criteria were severe somatic disorders (such as organ failures and endocrinological disorders), neurological disorders (such as a history of traumatic brain injury, epilepsy, cerebrovascular attacks, multiple sclerosis, and other degenerative disorders that may mimic obsessive symptoms), simultaneous suffering of major depressive disorder or psychotic features of any reason, usage of other psychotropic medications such as anticonvulsants, regular consumption of alcoholic drinks (more than 2-3 and 3-4 units/day in women and men, respectively), regular smoking, more than 5 cigarettes per day or an equal amount of other tobacco products, regular consumption of psychostimulants or opioids at least 3 times a week, heavy drinking of caffeine drinks, more than 4 cups per day, and having an α- rhythm higher or lower than normal limits.
Statistical analyses
We first used univariate analyses to investigate the probable correlations, including the Pearson correlation and chi-square tests. Finally, multivariate logistic regression was performed to assess potential confounding factors. P<0.05 were considered as significant. The SPSS software, version 22 was used to conduct these calculations.
3. Results
Our study included 28 samples, 14 males and 14 females, with a mean age of 34.9±17.5 years. The mean duration of symptoms was 46.6±11.6, ranging from 3 to 31 years. Six patients (21%) had a high school diploma, and 18(64.3%) had university degrees. The dosage of fluvoxamine prescribed for patients is mentioned in Table 1.

According to the definition of responsiveness to the treatment described above, Table 2 shows the rate of responsiveness based on different variables. The P about different variables indicated that none of these confounding factors had led to significant differences.

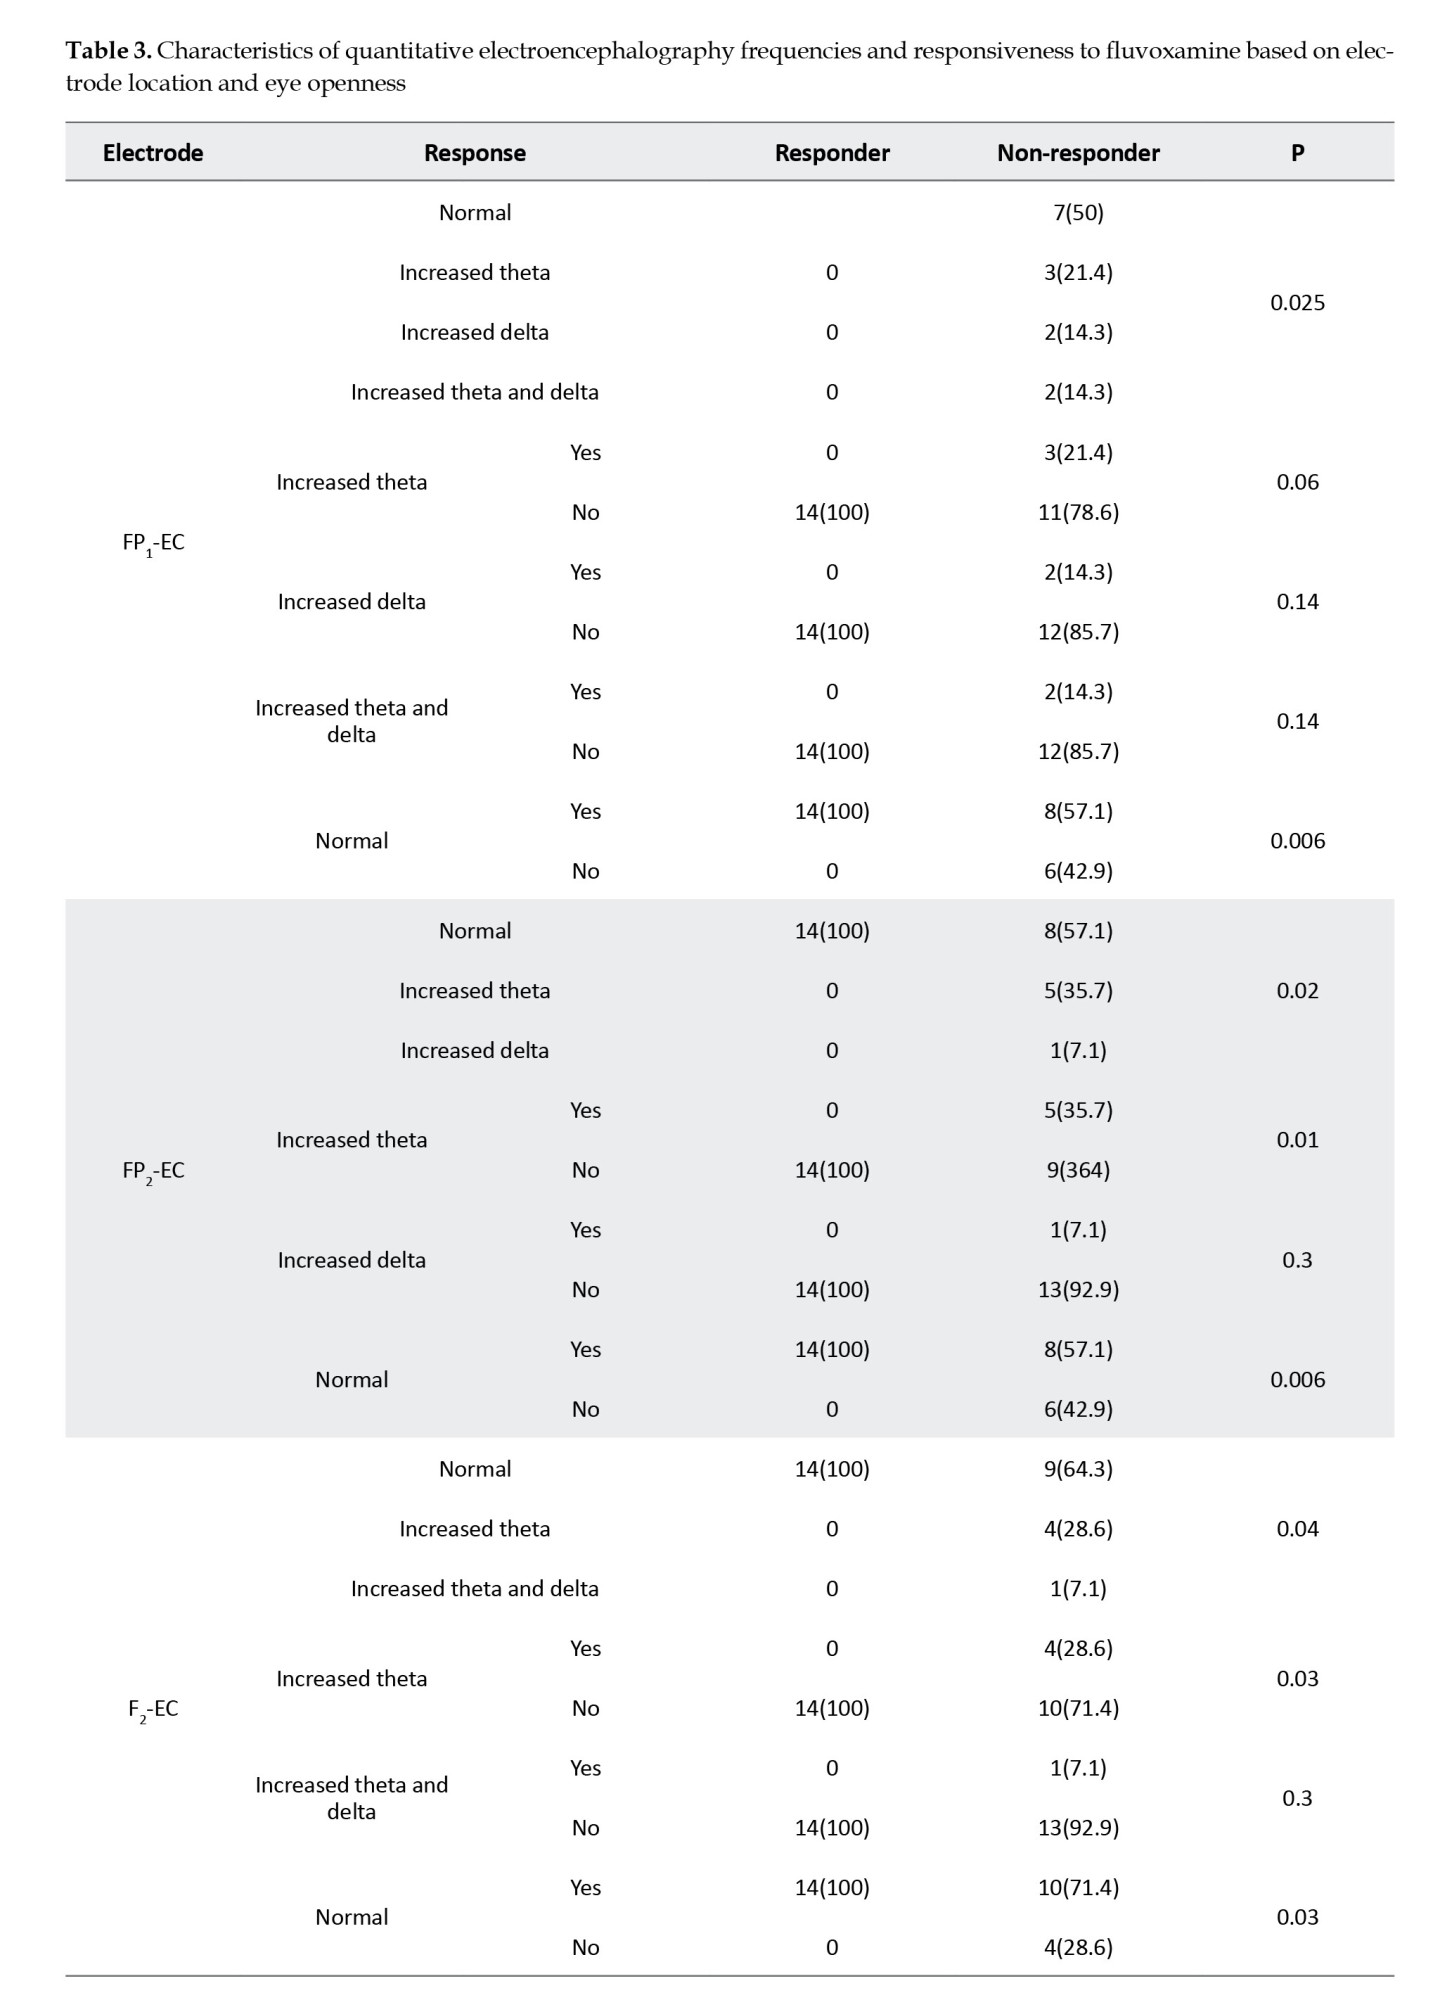
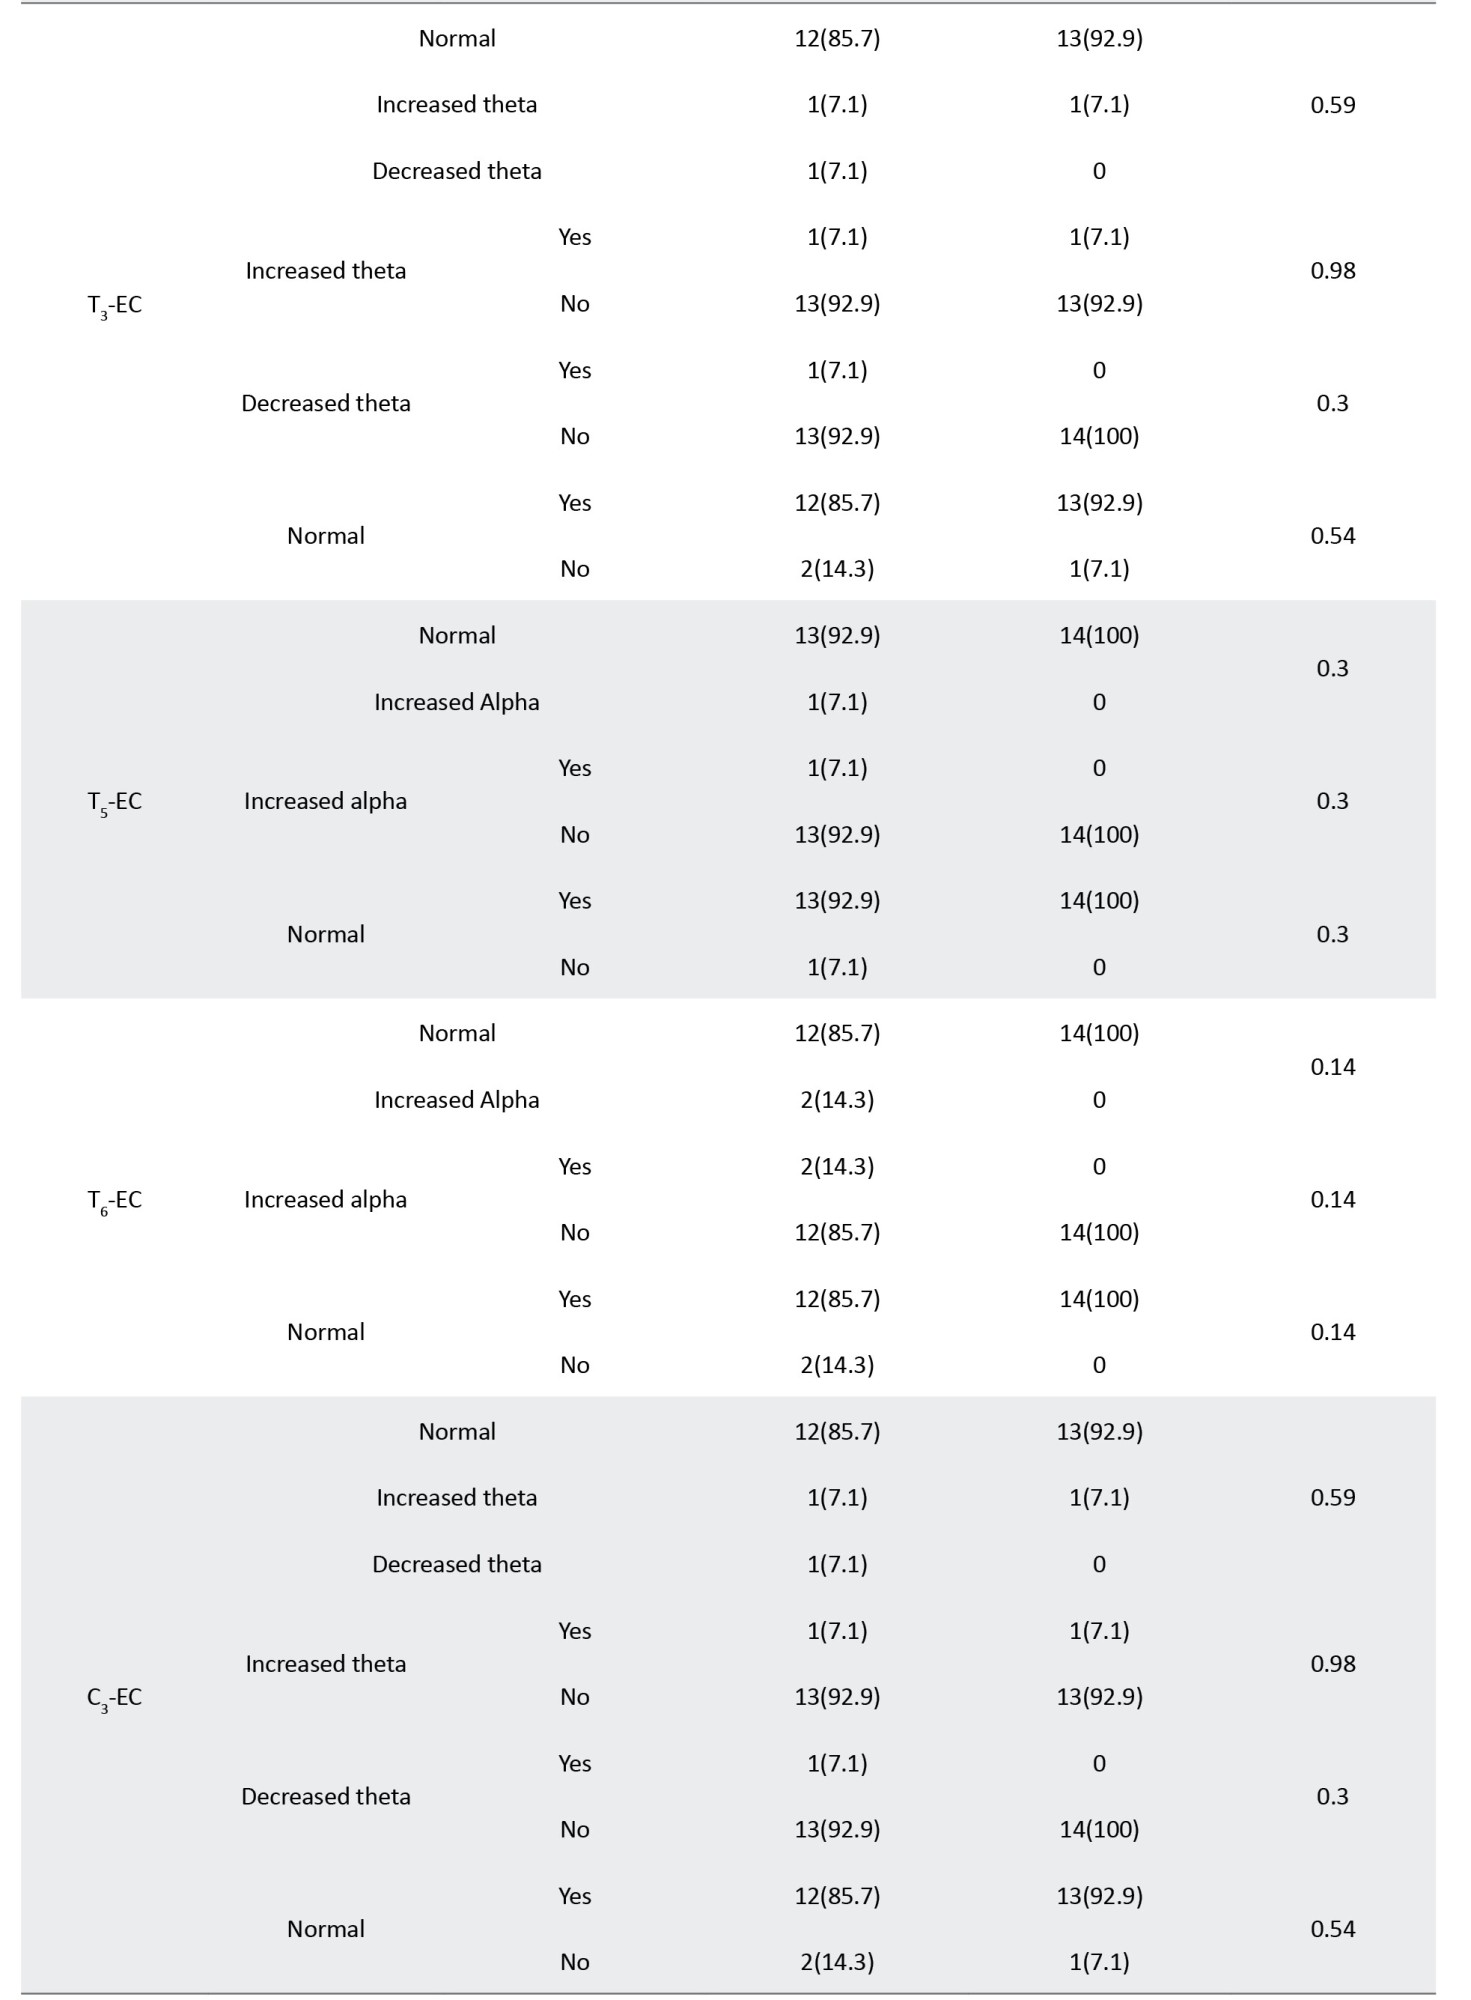
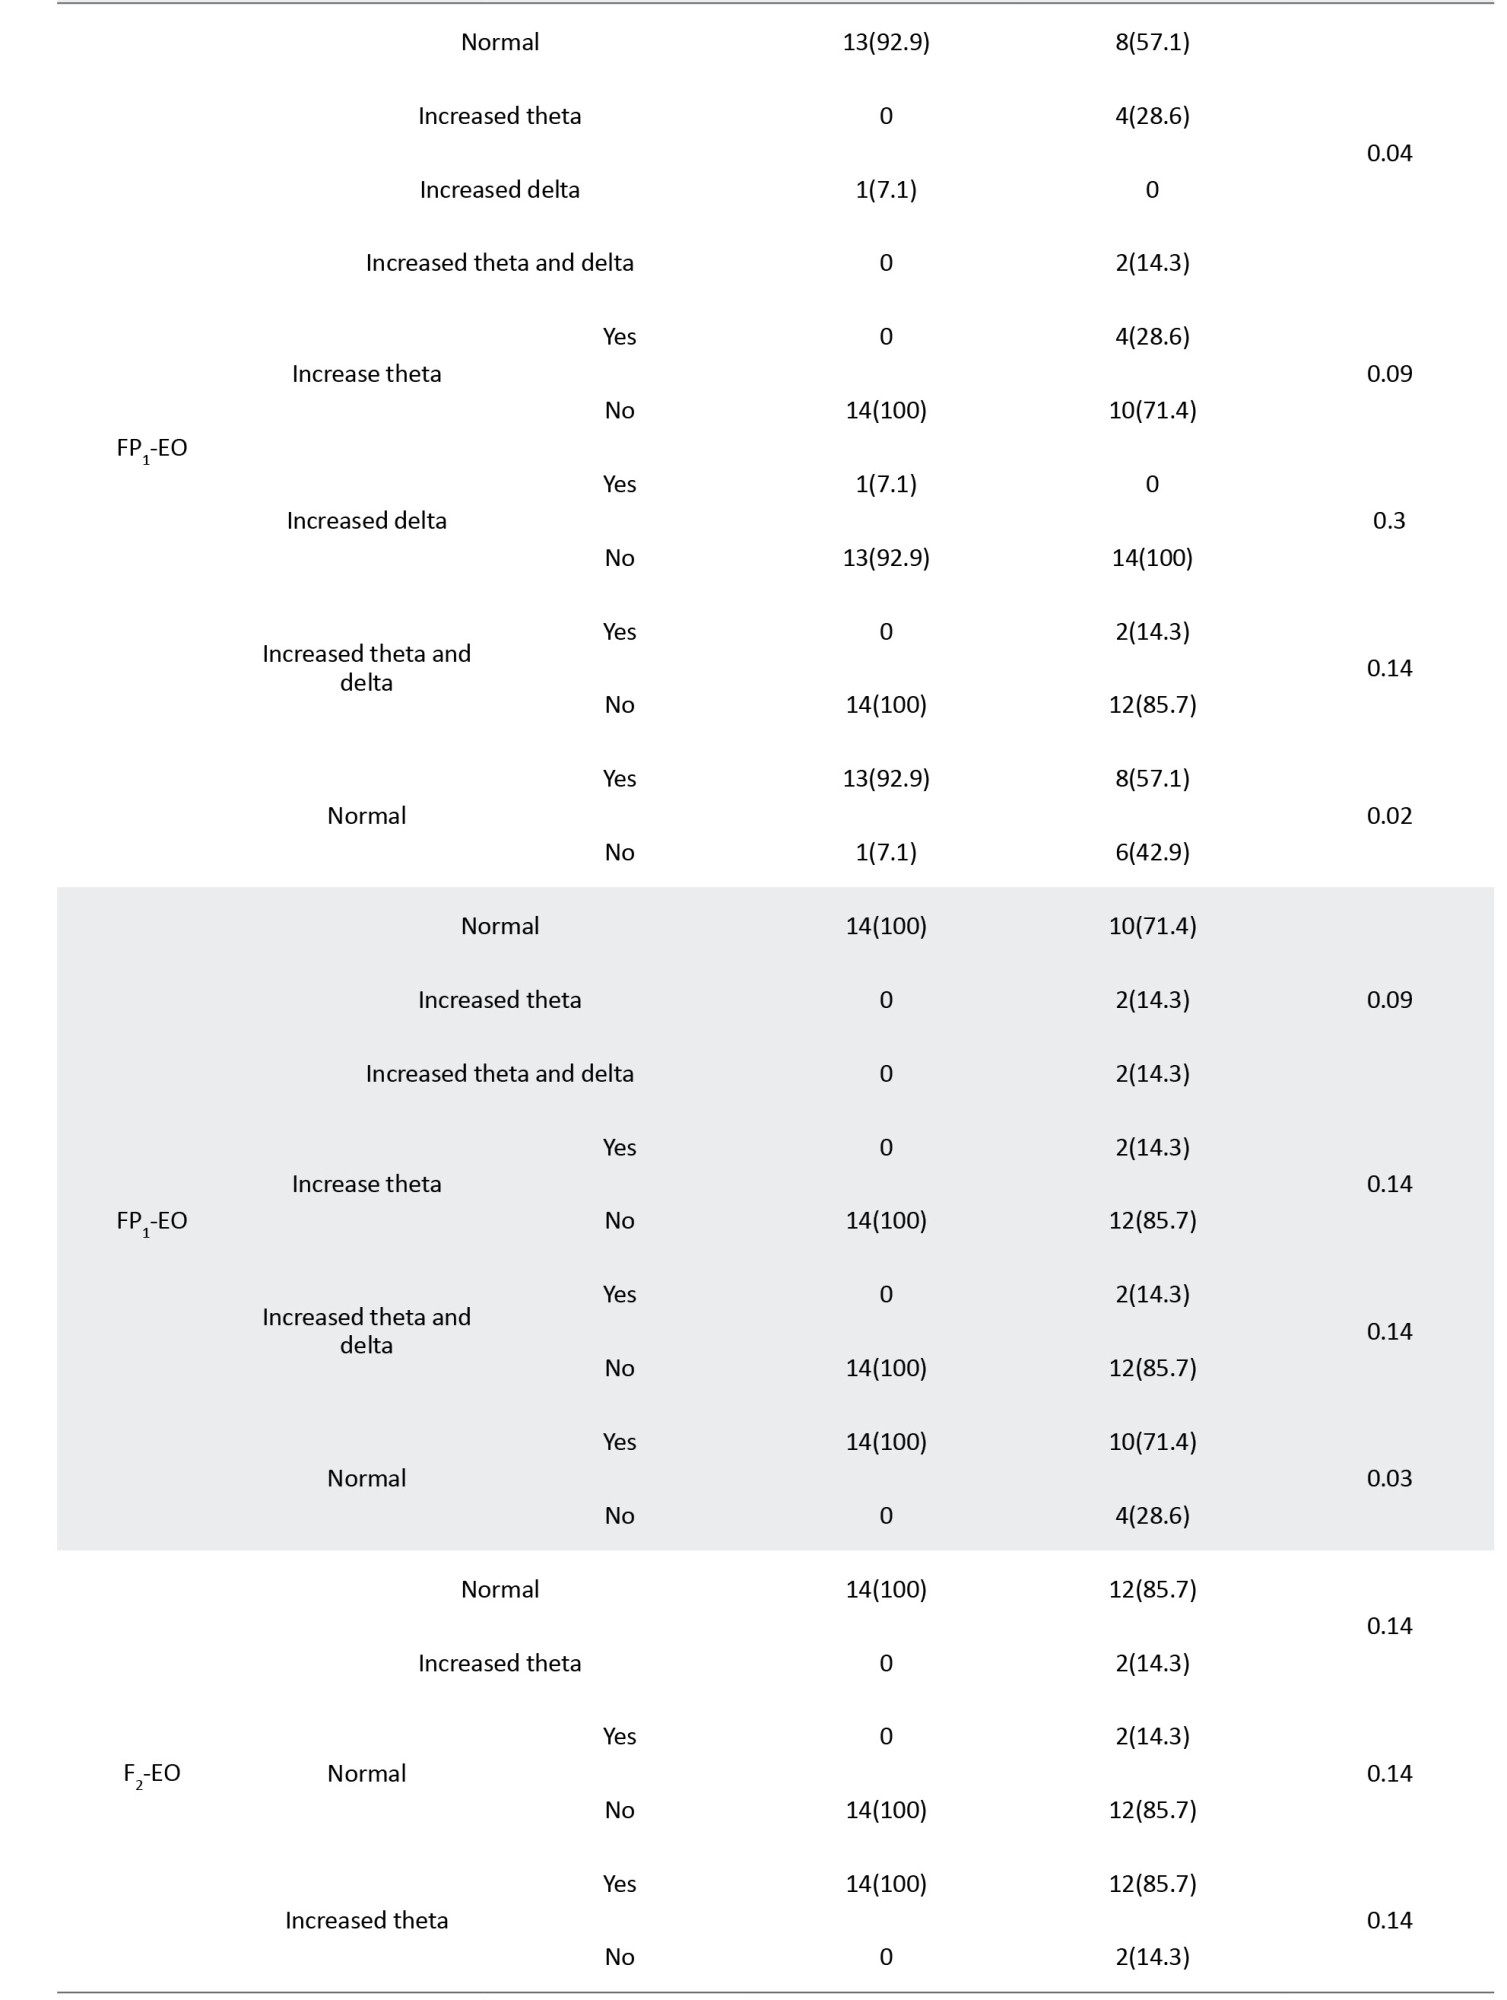
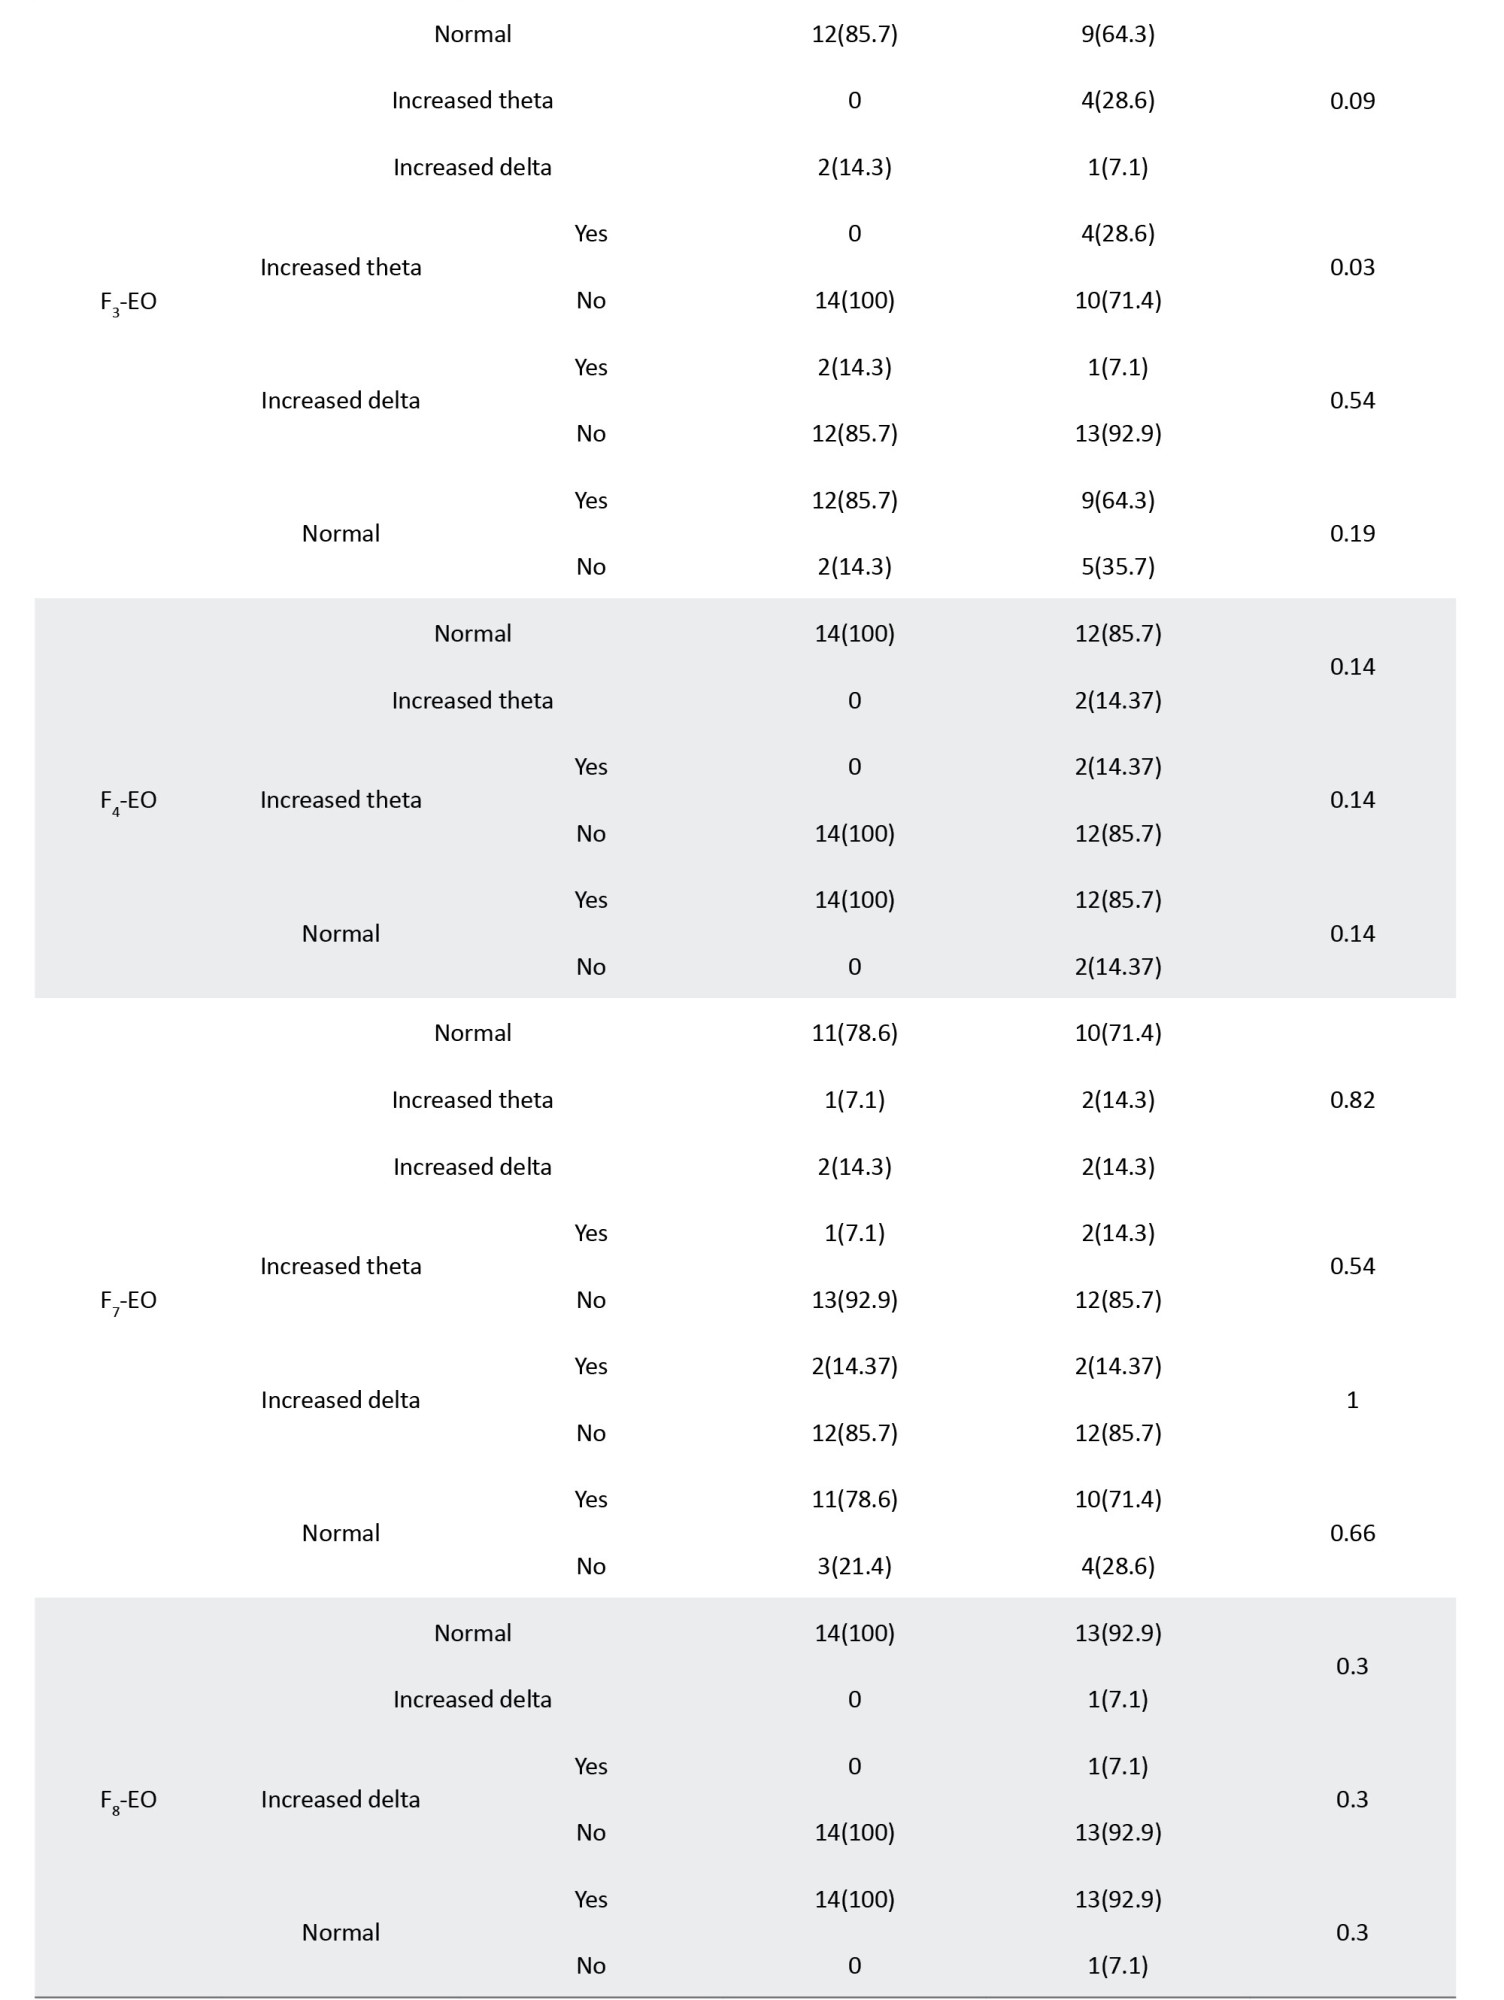
Table 3 presents the correlations between different bands of electroencephalographic waves and responsiveness to the fluvoxamine regimen.


The significant correlations between waves and loci, including FP1, FP2, F2, F3, O1, and O2, are summarized in Table 4, sorted by the P increasingly.
During the study, none of the cases experienced any serious adverse effects leading to interruption of pharmacotherapy.

4. Discussion
The results of our study showed that in closed eyes condition pre-intervention, the normal relative power of waves in FP1, FP2, FZ, and F3 and increased relative power of waves recorded from O1 are correlated with responsiveness to fluvoxamine. In contrast, increased theta waves in electrodes FP2, FZ, and F3 and no change in alpha waves from electrode O1 correlate with unresponsiveness. In the electroencephalographic records obtained with opened eyes, the increased relative power of alpha waves in electrodes O1 and O2 and the normal relative power of waves in FP1 and FP2 were correlated with desirable responsiveness. In contrast, increased alpha waves in electrodes O1 and O2 were related to unresponsiveness to fluvoxamine. Accordingly, the electroencephalographic waves recorded from the medial-frontal area (especially the left side) and occipital regions (especially the left) can be utilized as biomarkers to predict the responsiveness of OCD patients to treatment with fluvoxamine.
Previous studies have shown that not only the antidepressant agents alter the EEG waves, but also pre-interventional waves may have predictive power about responsiveness to these medications and other therapeutic alternatives. Chronologically sorted, one of the earliest outstanding studies working on the correlation between brain waves and OCD subtypes was conducted by Prichep. Among 27 patients with the diagnosis of OCD following 12 weeks of treatment with fluvoxamine, fluoxetine, or clomipramine, 16 patients expressed desirable outcomes. The responsiveness was correlated with the higher relative power of the alpha wave, while non-responders showed higher theta waves, especially in temporal and frontal areas. Our results are compatible with the findings of this study, although more accurate localization and detection of an asymmetry of waves are two points of priority in our research (Prichep et al., 1993).
The next study was conducted by Cook in 1999. In this study, 24 adult patients affected by major depressive disorder were categorized into concordant and discordant groups based on the assessment of QEEG cordance, a measure of cerebral energy utilization. Although both groups were clinically and historically similar before the intervention, the concordant group experienced a faster symptom reduction. The authors concluded that QEEG cordance could distinguish between depressed adults in terms of responsiveness to fluoxetine (Cook et al., 1999).Cook et al. reported their further studies on prefrontal activity measured by QEEG cordance and its early changes as a predictor factor to distinguish between responders and non-responders to antidepressant agents such as fluoxetine and venlafaxine and in SSRIs non-responders going to initiate a new treatment by prescription of their psychiatrists. Compatible with the abovementioned studies, prefrontal cordance has also been correlated with responsiveness to treatment (Cook & Leuchter, 2001; Cook et al., 2002; Cook et al., 2005).
Tot reported the results of their study on 22 unmedicated OCD patients and showed that they have higher frequencies of slow wave bands and a lower frequency of alpha wave at the frontotemporal region in comparison with a control group. They also found a significant correlation between increased slow waves. They found a decreased beta activity at the left frontal area during hyperventilation in responders to SSRI agents. They concluded that frontal lobe function was better in this group than in non-responders (Tot et al., 2002).
Another similar study was conducted by Hansen (2003), which shows that non-responsiveness to treatment with SSRI agents is related to excessive power of theta wave in the frontal area while the responders show higher relative power of alpha wave in the same region. The pattern of change of brain waves and increased alpha is compatible with the results of our study, but the anterior location of this change was not.
Some other studies at this age have recorded similar changes in the electroencephalographic waves of OCD patients. Karadag et al. reported that the relative power of theta wave and alpha wave are significantly higher and lower in OCD patients in frontotemporal sites (Karadag et al., 2003).
Bucci et al. also reported decreased alpha band power and its negative correlation with the time needed to complete neuropsychological tests about executive functions. They have suggested that hyperactivity of frontal networks in the pathogenesis of OCD (Bucci et al., 2004).
During the same period, some investigators have focused on a correlation between responsiveness and electroencephalographic features in depressive disorder. In 2000, Knott et al. studied the brain waves in male patients affected by major depressive disorder before being treated with paroxetine for 6 weeks. Their study shows that pre-intervention lower power and frequency of beta waves in the frontal area are correlated with better responsiveness to this medication. As increased beta wave indicates behavioral/affective activation, they concluded that hypoactivity of the frontal cortex before treatment predicts a more desirable SSRI treatment outcome (Knott et al., 2000).
In another study conducted in 2001, Bruder et al. worked on the power of alpha waves in depressed patients, considering the negative correlation between its power and cortical activation and previous evidence about the asymmetry of alpha waves in depression. Their sample included 34 depressed patients who responded to pharmacotherapy with fluoxetine and 19 non-responder cases. Their study showed that although there was no significant difference between the overall alpha wave between the two groups of responders and non-responders, they were significantly different in the alpha asymmetry, which was more prominent in the eyes opened condition. According to the results, the responders showed more activation (lower alpha power) in their left hemisphere, in comparison with the right side, while non-responders showed lower alpha waves in the right hemisphere and less asymmetry (Bruder et al., 2001).
Later, in 2008, Bruder reported that higher alpha waves in the occipital area and alpha wave asymmetry correlate with better responsiveness to fluoxetine medication. In this study, after 12 weeks of treatment, the power and asymmetry of the alpha wave did not alter. Hence, the investigators concluded that these differences are probably a family of traits indicating the subgroup of depressed patients rather than a state-dependent condition (Bruder et al., 2008).
In 2008, Bares et al. reported that in their sample, which consisted of 12 responders and 13 non-responders depressed patients, decreased theta band QEEG cordance in the frontal area after one week is significantly related to responsiveness to 4 weeks of treatment with venlafaxine (Bares et al., 2008).
In 2008, Iosifescu et al. investigated the changes in suicidal ideation during treatment with SSRIs and frontal electroencephalographic waves in depressed cases. They reported that worsening of suicidal ideation, which had occurred in 11% of the samples, equal to 9 of 82 patients, was correlated with asymmetry of combined theta and alpha power in that region (Iosifescu et al., 2008).
The study conducted by Hunter and his team on 72 major depressive patients showed that antidepressant treatment for emergent suicidal ideation that happened in 13.5% of cases was correlated with a significant temporary decrease of QEEG cordance in the midline and right frontal area 48 hours after initiation of treatment with fluoxetine and venlafaxine (Hunter et al., 2010).
Another study conducted by Hunter et al. categorized patients affected by major depressive disorder into 3 groups based on the pattern of changes in their symptoms over time. In the intervention group of 94 cases that received venlafaxine, 62% were responders, 20% were non-responders, and 17% were symptomatically volatile, experiencing fluctuating symptoms. They investigated QEEG cordance before the intervention and after one week and showed that responsiveness to the treatment is correlated with higher degrees of decrease in QEEG cordance in the midline and right frontal area, compared with non-responders, but not volatile cases (Hunter et al., 2010).
The next study that is available in the literature was conducted by Ischedeck et al., based on the assumption of correlation between the risk of anxiety and depressive disorder and electroencephalographic alpha wave. The investigators assessed the power of the lower alpha band (8 to 10 Hz) in 20 patients affected by OCD and compared them with 20 healthy control cases. The novelty of this study is recording the electroencephalographic waves during the presentation of neutral, aversive, and OCD-related images. The reported asymmetry of lower alpha power in favor of the left side in all three conditions did not exist in parietal areas, and higher alpha wave and theta and beta frequencies did not exist. They concluded that their findings supported increased avoidance motivation in this disorder (Ischebeck et al., 2014).
Bares et al. studied the predictive power of electroencephalographic features in 103 depressed cases who underwent treatment by SSRIs and SNRIs (Serotonin and norepinephrine reuptake inhibitors), 57 and 46 patients, respectively. They investigated alpha1, alpha2, theta power, prefrontal theta cordance, frontal and occipital alpha1, and alpha2 asymmetry at the pre-interventional stage and after 1 week. The only parameters correlated with responsiveness to these groups of antidepressants were decreased prefrontal theta cordance and increased occipital alpha1 and alpha2 asymmetry in the first week, positively and negatively, respectively. There was no significant difference between the cases at baseline investigations, and the type of received medications did not alter these correlations too (Bares et al., 2019).
The electroencephalographic features have not only been used to predict responsiveness to pharmacotherapy, but some studies (Metin et al., 2020) have also assessed its correlation with responsiveness to transcranial magnetic stimulation in OCD disorder. They have concluded that QEEG can be used as a determining factor in choosing the best treatment strategy for OCD patients (Metin et al., 2020).
The higher alpha waves in occipital areas found in our study have been reported in some previous investigations, such as the Bruder study. Our study has also shown that in closed eyes, the asymmetry between hemispheres and lower alpha in the right occipital region is correlated with responsiveness to fluvoxamine. Bruder also reported such a correlation in 2001, while Bares mentioned opposite findings in 2019, but both were in depressed cases. The correlation between higher anterior theta and unresponsiveness has also been reported by Prichep and Hansen, as well as our study (Prichep et al., 1993; Hansen et al., 2003).
5. Conclusion
Conclusively, and considering all mentioned above, the results of our study, supported by previous literature, have shown that QEEG features, especially occipital alpha waves and theta waves in frontal areas, have desirable potency to be utilized as predictive biomarkers about the responsiveness of OCD patients to fluvoxamine. Indeed, integration of accessible biomarkers such as electroencephalographic and neuroimaging data can lead to personalized treatment planning for patients; studies like ours are the pieces of the puzzle of algorithm that can make the railroad of choosing the best therapeutic alternative, hopefully minimizing the needed time to experience the ameliorative effect and maximizing effectiveness of therapy.
Study limitations
A larger sample size could undoubtedly improve the significance of outcomes. Similar investigations on other routinely used medications and even comparisons between their efficacies may be of high practicality, far beyond our study. Further studies with larger samples and about different therapeutic alternatives, including medications and neuromodulation methods, are suggested.
Ethical Considerations
Compliance with ethical guidelines
There were no ethical considerations to be considered in this research.
Funding
This research did not receive any grant from funding agencies in the public, commercial, or non-profit sectors.
Authors' contributions
All authors contributed equally to the conception and design of the study, data collection and analysis, interception of the results and drafting of the manuscript. Each author approved the final version of the manuscript for submission.
Conflict of interest
There is no conflict of interest to declare. This project was funded by the University of Social Welfare and Rehabilitation Sciences, Tehran, Iran.
Acknowledgments
The authors thank the staff of the Psychiatry Clinic and Electroencephalography Unit of Nezam Mafi University Hospital for their kind cooperation and coordination.
References
Obsessive-compulsive disorder (OCD) is characterized by obsessive intrusive thoughts provoking fearful concerns and leading to rituals that seem to be protective. Although the content of obsessive symptoms may vary based on the cultural, ethnical, and religious contexts, the whole frames have obvious similarities (Rajabi, 2007). Lifelong prevalence of OCD has been estimated to be up to 2%-3% in domestic studies (Salehi et al., 2003). A more recent study has presented the estimation of lifetime and annual prevalence equal to 2.3% and 1.2%, respectively (Ruscio et al., 2010). Some investigators have calculated that around 10% of outpatients in psychiatric clinics are affected by OCD. Accordingly, OCD is the fourth most prevalent psychiatric disorder, after specific phobias, drug-induced disorders, and depressive disorders (Kaplan Sadock, 2003).
Unfortunately, the data about the costs of OCD have not been updated recently. In 1995, DuPont et al. (1995) estimated the direct and indirect costs imposed by OCD via the human capital approach. The calculated total costs were $8.4 billion, equal to 5.7% of the estimated costs related to all mental disorders. The indirect costs that indicate the range of productivity that OCD patients lost were estimated at $6.2 billion. Recent studies stress the considerable amount of hidden costs imposed on payers caused by ineffective treatment or misdiagnosis of OCD and due to care transition (Businesswire, 2021).
For a comprehensive evaluation of the burden imposed by OCD, we must remember the psychological pressure and financial costs imposed on their caregivers. It has been proven that although OCD is less disabling than depressive disorders, their caregivers are more burdened and in need of higher levels of accommodation than the people who care for depressed patients (Vikas et al., 2011). Up to 75% of patients present the early symptoms before 25 and even in childhood, leading to substantial disability-adjusted life years and imposed costs on families and health systems (Sadock & Sadock, 2009).
According to highly variable features of this disorder, different therapeutic methods have been introduced so far, including psychological interventions (such as response prevention and mindfulness) and pharmacotherapy, or their combination (Sadock et al., 2009).
Based on the role of the serotonergic system in the pathogenesis of OCD, selective serotonin reuptake inhibitors are among the most widely used drugs. Fluvoxamine is a member of this group that many clinicians choose as the first choice in the treatment of OCD10, and its efficacy has been approved by The United States Food and Drug Administration (U.S. Food and Drug Administration, 2008).
Although the remission of symptoms soon after the initiation of the trial is a promising signal for responsiveness, the outcomes of pharmaceutical interventions are routinely evaluated after 6 to 12 weeks. The minimum time for assessing responsiveness to the first prescribed selective serotonin reuptake inhibitors (SSRI) is 4 weeks, which would be extended to 6 weeks to evaluate the remission of symptoms. Unfortunately, it is not surprising for a patient to not respond desirably to the first choice of medication (Trivedi et al., 2006). In some cases, achieving the best drug regimen, such as monotherapy or combination, may last up to one year (Rush et al., 2009; Rush, 2007; Keitner et al., 1992). In addition to the longer suffering that they experience, about 26% of the patients who did not experience the ameliorative effects of the first chosen drug will refuse their treatment after two weeks (Warden et al., 2007), and this ratio increases up to 42% on the 30th day (Olfson et al., 2006). According to the socioeconomic consequences of failed antidepressant therapy for OCD, any means that helps in predicting responsiveness would be of high clinical and financial importance (Maron & Nutt, 2015).
Digitalization of electroencephalography has made it possible to work on the correlation between characteristics of waves and other parameters quantitatively. By Fourier Transform, any raw electroencephalographic data obtained from each point could be divided into categorized waves with specific frequency ranges, and each one has its amplitude. Investigations to find any correlation between these detailed data and responsiveness to a particular treatment or prognosis of a condition is the topic of an increasing number of studies on different psychiatric and neurologic disorders, such as depression, drug dependency, psychosis, traumatic brain injuries, and disorders of consciousness (Spronk et al., 2011; Widge et al., 2019; Venneman et al., 2006; van Tricht et al., 2014; Tolonen et al., 2018; Stefan et al., 2018).
Considering what was discussed, we decided to investigate the potential predictive value of quantitative electroencephalographic (QEEG) features in the responsiveness of OCD patients to fluvoxamine. There is no doubt that such a possible correlation would be of high practical importance to designing anticipatory models and individualized treatment plans, leading to diminished suffering of patients and burden on families and health systems.
2. Materials and Methods
This prospective study investigates the predictive power of QEEG features in the responsiveness of OCD patients to fluvoxamine. We included 40 cases from Nezam Mafi University Clinic, University of Social Welfare and Rehabilitation Sciences, Tehran City, Iran. The number of samples was calculated with 95% confidence and 80% statistical power, based on Equation 1. All cases were visited by a board-certified psychiatrist and received the diagnosis of OCD according to DSM-V for the first time. All of them were medication-free until the time of participation in our study. They were informed about the study methods and purposes and their right to quit at any time, and they signed the consent form.
Equation 1:
We applied the Yale-Brown obsessive-compulsive scale (Y-BOCS), Persian edition, to assess the severity of symptoms and responsiveness to treatment at the beginning of the study and 6 weeks after the initiation of therapy. This instrument, which a clinician scores, includes 10 scales and is scored by the Likert system (from 0 to 4 aligned with the severity), ranging between 0 to 40 overall score. According to this scale, scores of 0 to 7, 8 to 15, 16 to 23, 24 to 31, and more than 31 indicate subclinical, mild, moderate, severe, and very severe cases, respectively. Validity and reliability of this scale and its Persian version have been proved desirable (Esfahani et al., 2012; Rabiee et al., 2010). We did not consider any minimum score of Y-BOCS for inclusion in the study because we made our diagnosis clinically, and the differences between pre and post-treatment scores would be the data of comparison.
QEEG was obtained when patients had not used any medication with psychotropic effects for at least 72 hours through the algorithms provided by the American Clinical Neurophysiology Society and Pharmaco-EEG Guidelines. The records were conducted by Nihon Kohden EEG, Neurofax 1200 J/K, under the direct observation of a neurologist. The electrodes were placed based on a 10/20 montage system on O2, O1, T5, T6, P3, P4, P2, T4, T3, C3, C4, C2, F8, F7, F4, F3, F2, FP2, FP1 points in addition to reference and ground electrodes on auricles. The impedances of each electrode were checked and rechecked by an expert technician not to be more than 10 kΩ. The sensitivity was tuned on 7 μV/mm, and low and high-frequency filters (1 and 70 Hz) were activated. Notch filters (60 Hz) were also used if indicated. The recordings were performed between 9 AM and 1 PM to diminish the effects of daily rhythms and feeding on the waves in a semi-sitting position and awake in a silent, slightly lighted room, kept from hindering environmental stimuli. The obtained data were analyzed by NeuroGuide software 2.3.8, which uses the fast Fourier transform (FFT) to assess waves. The primary resting EEG with a closed eye for 5 to 15 minutes was used to evaluate the electrode placements and potential artifacts, and abnormal cases, including epileptical paroxysm and abnormal alpha waves, were considered the exclusion criteria. Then, the main records containing 5 minutes with opened eyes and 5 minutes with closed eyes were taken for the basic analyses. The relative powers of each frequency range (alpha, beta, high beta, theta, and delta) were calculated for all 19 electrodes. The frequencies were analyzed by the software of NeuroGuide™ (Applied Neuroscience, Inc, 2023).
After recording the electroencephalographs, the patients began to take fluvoxamine, 150 to 300 mg per day, per os. Six weeks after treatment, provided that at least two weeks have passed since reaching the maximum dosage (based on clinical symptoms or therapeutic window), the patients were reinvestigated by Y-BOCS. In the analytic phase, the pre-intervention electroencephalographic waves were compared between responders and non-responders. Responders were defined as reducing the severity of symptoms by 50 percent or more. Also, age, gender, and educational level were considered as potential confounding factors.
The patients were assessed for adverse effects during the medication period at the end of the first, second, fourth, and sixth weeks.
Definition of terms
Responder refers to the patients who experienced at least a 50% reduction in symptoms based on the Y-BOCS scores.
EEG frequency bands are the electroencephalic waves categorized based on their frequencies: 1-3 Hz, 4-7 Hz, 8-12 Hz, and 13-25 Hz as alpha, theta, alpha, and beta bands, respectively.
Z score is the difference between the scores of the examinee and the normal population, described as standard deviation. In other words, the Z score indicates how much the patient’s score deviates from the normal population.
Multivariate analysis considers some electrodes next to each other as the indicator of the electroencephalographic activity of that particular locus. These areas include: Left lateral by F7, T3, and T5; left medial by FP1, F3, C3, P3, and O1; left anterior by FP1, F7, and F3; left central by T3 and C3; left posterior by T5, P3 and O1; midline by Fz, Cz, and Pz; right lateral by F8, T4, and T6; right medial by FP2, F4, C4, P4 and O2; right anterior by FP2, F8 and F4; right central by T4 and C4; and right posterior by T6, P4 and O2. In multivariate analysis, the Z score indicates deviation from the means among the normal population.
The inclusion criteria were aged between 18 and 65, diagnosis of obsessive-compulsive disorder based on DSM-V, and volunteer attendance in the study.
The exclusion criteria were severe somatic disorders (such as organ failures and endocrinological disorders), neurological disorders (such as a history of traumatic brain injury, epilepsy, cerebrovascular attacks, multiple sclerosis, and other degenerative disorders that may mimic obsessive symptoms), simultaneous suffering of major depressive disorder or psychotic features of any reason, usage of other psychotropic medications such as anticonvulsants, regular consumption of alcoholic drinks (more than 2-3 and 3-4 units/day in women and men, respectively), regular smoking, more than 5 cigarettes per day or an equal amount of other tobacco products, regular consumption of psychostimulants or opioids at least 3 times a week, heavy drinking of caffeine drinks, more than 4 cups per day, and having an α- rhythm higher or lower than normal limits.
Statistical analyses
We first used univariate analyses to investigate the probable correlations, including the Pearson correlation and chi-square tests. Finally, multivariate logistic regression was performed to assess potential confounding factors. P<0.05 were considered as significant. The SPSS software, version 22 was used to conduct these calculations.
3. Results
Our study included 28 samples, 14 males and 14 females, with a mean age of 34.9±17.5 years. The mean duration of symptoms was 46.6±11.6, ranging from 3 to 31 years. Six patients (21%) had a high school diploma, and 18(64.3%) had university degrees. The dosage of fluvoxamine prescribed for patients is mentioned in Table 1.
According to the definition of responsiveness to the treatment described above, Table 2 shows the rate of responsiveness based on different variables. The P about different variables indicated that none of these confounding factors had led to significant differences.
Table 3 presents the correlations between different bands of electroencephalographic waves and responsiveness to the fluvoxamine regimen.
The significant correlations between waves and loci, including FP1, FP2, F2, F3, O1, and O2, are summarized in Table 4, sorted by the P increasingly.
During the study, none of the cases experienced any serious adverse effects leading to interruption of pharmacotherapy.
4. Discussion
The results of our study showed that in closed eyes condition pre-intervention, the normal relative power of waves in FP1, FP2, FZ, and F3 and increased relative power of waves recorded from O1 are correlated with responsiveness to fluvoxamine. In contrast, increased theta waves in electrodes FP2, FZ, and F3 and no change in alpha waves from electrode O1 correlate with unresponsiveness. In the electroencephalographic records obtained with opened eyes, the increased relative power of alpha waves in electrodes O1 and O2 and the normal relative power of waves in FP1 and FP2 were correlated with desirable responsiveness. In contrast, increased alpha waves in electrodes O1 and O2 were related to unresponsiveness to fluvoxamine. Accordingly, the electroencephalographic waves recorded from the medial-frontal area (especially the left side) and occipital regions (especially the left) can be utilized as biomarkers to predict the responsiveness of OCD patients to treatment with fluvoxamine.
Previous studies have shown that not only the antidepressant agents alter the EEG waves, but also pre-interventional waves may have predictive power about responsiveness to these medications and other therapeutic alternatives. Chronologically sorted, one of the earliest outstanding studies working on the correlation between brain waves and OCD subtypes was conducted by Prichep. Among 27 patients with the diagnosis of OCD following 12 weeks of treatment with fluvoxamine, fluoxetine, or clomipramine, 16 patients expressed desirable outcomes. The responsiveness was correlated with the higher relative power of the alpha wave, while non-responders showed higher theta waves, especially in temporal and frontal areas. Our results are compatible with the findings of this study, although more accurate localization and detection of an asymmetry of waves are two points of priority in our research (Prichep et al., 1993).
The next study was conducted by Cook in 1999. In this study, 24 adult patients affected by major depressive disorder were categorized into concordant and discordant groups based on the assessment of QEEG cordance, a measure of cerebral energy utilization. Although both groups were clinically and historically similar before the intervention, the concordant group experienced a faster symptom reduction. The authors concluded that QEEG cordance could distinguish between depressed adults in terms of responsiveness to fluoxetine (Cook et al., 1999).Cook et al. reported their further studies on prefrontal activity measured by QEEG cordance and its early changes as a predictor factor to distinguish between responders and non-responders to antidepressant agents such as fluoxetine and venlafaxine and in SSRIs non-responders going to initiate a new treatment by prescription of their psychiatrists. Compatible with the abovementioned studies, prefrontal cordance has also been correlated with responsiveness to treatment (Cook & Leuchter, 2001; Cook et al., 2002; Cook et al., 2005).
Tot reported the results of their study on 22 unmedicated OCD patients and showed that they have higher frequencies of slow wave bands and a lower frequency of alpha wave at the frontotemporal region in comparison with a control group. They also found a significant correlation between increased slow waves. They found a decreased beta activity at the left frontal area during hyperventilation in responders to SSRI agents. They concluded that frontal lobe function was better in this group than in non-responders (Tot et al., 2002).
Another similar study was conducted by Hansen (2003), which shows that non-responsiveness to treatment with SSRI agents is related to excessive power of theta wave in the frontal area while the responders show higher relative power of alpha wave in the same region. The pattern of change of brain waves and increased alpha is compatible with the results of our study, but the anterior location of this change was not.
Some other studies at this age have recorded similar changes in the electroencephalographic waves of OCD patients. Karadag et al. reported that the relative power of theta wave and alpha wave are significantly higher and lower in OCD patients in frontotemporal sites (Karadag et al., 2003).
Bucci et al. also reported decreased alpha band power and its negative correlation with the time needed to complete neuropsychological tests about executive functions. They have suggested that hyperactivity of frontal networks in the pathogenesis of OCD (Bucci et al., 2004).
During the same period, some investigators have focused on a correlation between responsiveness and electroencephalographic features in depressive disorder. In 2000, Knott et al. studied the brain waves in male patients affected by major depressive disorder before being treated with paroxetine for 6 weeks. Their study shows that pre-intervention lower power and frequency of beta waves in the frontal area are correlated with better responsiveness to this medication. As increased beta wave indicates behavioral/affective activation, they concluded that hypoactivity of the frontal cortex before treatment predicts a more desirable SSRI treatment outcome (Knott et al., 2000).
In another study conducted in 2001, Bruder et al. worked on the power of alpha waves in depressed patients, considering the negative correlation between its power and cortical activation and previous evidence about the asymmetry of alpha waves in depression. Their sample included 34 depressed patients who responded to pharmacotherapy with fluoxetine and 19 non-responder cases. Their study showed that although there was no significant difference between the overall alpha wave between the two groups of responders and non-responders, they were significantly different in the alpha asymmetry, which was more prominent in the eyes opened condition. According to the results, the responders showed more activation (lower alpha power) in their left hemisphere, in comparison with the right side, while non-responders showed lower alpha waves in the right hemisphere and less asymmetry (Bruder et al., 2001).
Later, in 2008, Bruder reported that higher alpha waves in the occipital area and alpha wave asymmetry correlate with better responsiveness to fluoxetine medication. In this study, after 12 weeks of treatment, the power and asymmetry of the alpha wave did not alter. Hence, the investigators concluded that these differences are probably a family of traits indicating the subgroup of depressed patients rather than a state-dependent condition (Bruder et al., 2008).
In 2008, Bares et al. reported that in their sample, which consisted of 12 responders and 13 non-responders depressed patients, decreased theta band QEEG cordance in the frontal area after one week is significantly related to responsiveness to 4 weeks of treatment with venlafaxine (Bares et al., 2008).
In 2008, Iosifescu et al. investigated the changes in suicidal ideation during treatment with SSRIs and frontal electroencephalographic waves in depressed cases. They reported that worsening of suicidal ideation, which had occurred in 11% of the samples, equal to 9 of 82 patients, was correlated with asymmetry of combined theta and alpha power in that region (Iosifescu et al., 2008).
The study conducted by Hunter and his team on 72 major depressive patients showed that antidepressant treatment for emergent suicidal ideation that happened in 13.5% of cases was correlated with a significant temporary decrease of QEEG cordance in the midline and right frontal area 48 hours after initiation of treatment with fluoxetine and venlafaxine (Hunter et al., 2010).
Another study conducted by Hunter et al. categorized patients affected by major depressive disorder into 3 groups based on the pattern of changes in their symptoms over time. In the intervention group of 94 cases that received venlafaxine, 62% were responders, 20% were non-responders, and 17% were symptomatically volatile, experiencing fluctuating symptoms. They investigated QEEG cordance before the intervention and after one week and showed that responsiveness to the treatment is correlated with higher degrees of decrease in QEEG cordance in the midline and right frontal area, compared with non-responders, but not volatile cases (Hunter et al., 2010).
The next study that is available in the literature was conducted by Ischedeck et al., based on the assumption of correlation between the risk of anxiety and depressive disorder and electroencephalographic alpha wave. The investigators assessed the power of the lower alpha band (8 to 10 Hz) in 20 patients affected by OCD and compared them with 20 healthy control cases. The novelty of this study is recording the electroencephalographic waves during the presentation of neutral, aversive, and OCD-related images. The reported asymmetry of lower alpha power in favor of the left side in all three conditions did not exist in parietal areas, and higher alpha wave and theta and beta frequencies did not exist. They concluded that their findings supported increased avoidance motivation in this disorder (Ischebeck et al., 2014).
Bares et al. studied the predictive power of electroencephalographic features in 103 depressed cases who underwent treatment by SSRIs and SNRIs (Serotonin and norepinephrine reuptake inhibitors), 57 and 46 patients, respectively. They investigated alpha1, alpha2, theta power, prefrontal theta cordance, frontal and occipital alpha1, and alpha2 asymmetry at the pre-interventional stage and after 1 week. The only parameters correlated with responsiveness to these groups of antidepressants were decreased prefrontal theta cordance and increased occipital alpha1 and alpha2 asymmetry in the first week, positively and negatively, respectively. There was no significant difference between the cases at baseline investigations, and the type of received medications did not alter these correlations too (Bares et al., 2019).
The electroencephalographic features have not only been used to predict responsiveness to pharmacotherapy, but some studies (Metin et al., 2020) have also assessed its correlation with responsiveness to transcranial magnetic stimulation in OCD disorder. They have concluded that QEEG can be used as a determining factor in choosing the best treatment strategy for OCD patients (Metin et al., 2020).
The higher alpha waves in occipital areas found in our study have been reported in some previous investigations, such as the Bruder study. Our study has also shown that in closed eyes, the asymmetry between hemispheres and lower alpha in the right occipital region is correlated with responsiveness to fluvoxamine. Bruder also reported such a correlation in 2001, while Bares mentioned opposite findings in 2019, but both were in depressed cases. The correlation between higher anterior theta and unresponsiveness has also been reported by Prichep and Hansen, as well as our study (Prichep et al., 1993; Hansen et al., 2003).
5. Conclusion
Conclusively, and considering all mentioned above, the results of our study, supported by previous literature, have shown that QEEG features, especially occipital alpha waves and theta waves in frontal areas, have desirable potency to be utilized as predictive biomarkers about the responsiveness of OCD patients to fluvoxamine. Indeed, integration of accessible biomarkers such as electroencephalographic and neuroimaging data can lead to personalized treatment planning for patients; studies like ours are the pieces of the puzzle of algorithm that can make the railroad of choosing the best therapeutic alternative, hopefully minimizing the needed time to experience the ameliorative effect and maximizing effectiveness of therapy.
Study limitations
A larger sample size could undoubtedly improve the significance of outcomes. Similar investigations on other routinely used medications and even comparisons between their efficacies may be of high practicality, far beyond our study. Further studies with larger samples and about different therapeutic alternatives, including medications and neuromodulation methods, are suggested.
Ethical Considerations
Compliance with ethical guidelines
There were no ethical considerations to be considered in this research.
Funding
This research did not receive any grant from funding agencies in the public, commercial, or non-profit sectors.
Authors' contributions
All authors contributed equally to the conception and design of the study, data collection and analysis, interception of the results and drafting of the manuscript. Each author approved the final version of the manuscript for submission.
Conflict of interest
There is no conflict of interest to declare. This project was funded by the University of Social Welfare and Rehabilitation Sciences, Tehran, Iran.
Acknowledgments
The authors thank the staff of the Psychiatry Clinic and Electroencephalography Unit of Nezam Mafi University Hospital for their kind cooperation and coordination.
References
Bares, M., Brunovsky, M., Kopecek, M., Novak, T., Stopkova, P., & Kozeny, J., et al. (2008). Early reduction in prefrontal theta QEEG cordance value predicts response to venlafaxine treatment in patients with resistant depressive disorder. European psychiatry: The Journal of the Association of European Psychiatrists, 23(5), 350–355. [DOI:10.1016/j.eurpsy.2008.03.001] [PMID]
Bares, M., Novak, T., Vlcek, P., Hejzlar, M., & Brunovsky, M. (2019). Early change of prefrontal theta cordance and occipital alpha asymmetry in the prediction of responses to antidepressants. International Journal of Psychophysiology: Official Journal of the International Organization of Psychophysiology, 143, 1–8. [DOI:10.1016/j.ijpsycho.2019.06.006] [PMID]
Bruder, G. E., Stewart, J. W., Tenke, C. E., McGrath, P. J., Leite, P., Bhattacharya, N., & Quitkin, F. M. (2001). Electroencephalographic and perceptual asymmetry differences between responders and nonresponders to an SSRI antidepressant. Biological Psychiatry, 49(5), 416–425. [PMID]
Bruder, G. E., Sedoruk, J. P., Stewart, J. W., McGrath, P. J., Quitkin, F. M., & Tenke, C. E. (2008). Electroencephalographic alpha measures predict therapeutic response to a selective serotonin reuptake inhibitor antidepressant: Pre- and post-treatment findings. Biological Psychiatry, 63(12), 1171–1177. [DOI:10.1016/j.biopsych.2007.10.009] [PMID]
Bucci, P., Mucci, A., Volpe, U., Merlotti, E., Galderisi, S., & Maj, M. (2004). Executive hypercontrol in obsessive-compulsive disorder: electrophysiological and neuropsychological indices. Clinical Neurophysiology: Official Journal of the International Federation of Clinical Neurophysiology, 115(6), 1340–1348. [DOI:10.1016/j.clinph.2003.12.031] [PMID]
Businesswire. (2021). Hidden’ OCD population costing payers, employers billions annually. Retrieved from: [Link]
Cook, I. A., & Leuchter, A. F. (2001). Prefrontal changes and treatment response prediction in depression. Seminars in Clinical Neuropsychiatry, 6(2), 113–120.r [DOI:10.1053/scnp.2001.21844] [PMID]
Cook, I. A., Leuchter, A. F., Morgan, M., Witte, E., Stubbeman, W. F., & Abrams, M., et al. (2002). Early changes in prefrontal activity characterize clinical responders to antidepressants. Neuropsychopharmacology: official Publication of the American College of Neuropsychopharmacology, 27(1), 120–131. [DOI:10.1016/S0893-133X(02)00294-4] [PMID]
Cook, I. A., Leuchter, A. F., Morgan, M. L., Stubbeman, W., Siegman, B., & Abrams, M. (2005). Changes in prefrontal activity characterize clinical response in SSRI nonresponders: A pilot study. Journal of Psychiatric Research, 39(5), 461–466.[DOI:10.1016/j.jpsychires.2004.12.002] [PMID]
Cook, I. A., Leuchter, A. F., Witte, E., Abrams, M., Uijtdehaage, S. H., & Stubbeman, W., et al. (1999). Neurophysiologic predictors of treatment response to fluoxetine in major depression. Psychiatry Research, 85(3), 263–273. [DOI:10.1016/S0165-1781(99)00010-4] [PMID]
DuPont, R. L., Rice, D. P., Shiraki, S., & Rowland, C. R. (1995). Economic costs of obsessive-compulsive disorder. Medical Interface, 8(4), 102–109. [PMID]
Esfahani, S. R., Motaghipour, Y., Kamkari, K., Zahiredin, A., & Janbozorgi, M. (2012). [Reliability and Validity of the Persian version of the Yale-Brown Obsessive-Compulsive scale (Y-BOCS) (Persian)]. Iranian Journal of Psychiatry and Clinical Psychology, 17 (4), 297-303. [Link]
Fu, C. H., Steiner, H., & Costafreda, S. G. (2013). Predictive neural biomarkers of clinical response in depression: A meta-analysis of functional and structural neuroimaging studies of pharmacological and psychological therapies. Neurobiology of Disease, 52, 75–83.. [DOI:10.1016/j.nbd.2012.05.008] [PMID]
Hansen, E. S., Prichep, L. S., Bolwig, T. G., & John, E. R. (2003). Quantitative electroencephalography in OCD patients treated with paroxetine. Clinical EEG (electroencephalography), 34(2), 70–74. [DOI:10.1177/155005940303400205] [PMID]
Hunter, A. M., Leuchter, A. F., Cook, I. A., & Abrams, M. (2010). Brain functional changes (QEEG cordance) and worsening suicidal ideation and mood symptoms during antidepressant treatment. Acta Psychiatrica Scandinavica, 122(6), 461–469. [DOI:10.1111/j.1600-0447.2010.01560.x] [PMID]
Hunter, A. M., Muthén, B. O., Cook, I. A., & Leuchter, A. F. (2010). Antidepressant response trajectories and quantitative electroencephalography (QEEG) biomarkers in major depressive disorder. Journal of Psychiatric Research, 44(2), 90–98.[DOI:10.1016/j.jpsychires.2009.06.006] [PMID]
Iosifescu, D. V., Greenwald, S., Devlin, P., Perlis, R. H., Denninger, J. W., & Alpert, J. E., et al. (2008). Pretreatment frontal EEG and changes in suicidal ideation during SSRI treatment in major depressive disorder. Acta Psychiatrica Scandinavica, 117(4), 271–276. [DOI:10.1111/j.1600-0447.2008.01156.x] [PMID]
Ischebeck, M., Endrass, T., Simon, D., & Kathmann, N. (2014). Altered frontal EEG asymmetry in obsessive-compulsive disorder. Psychophysiology, 51(7), 596–601. [DOI:10.1111/psyp.12214] [PMID]
Metin, S. Z., Balli Altuglu, T., Metin, B., Erguzel, T. T., Yigit, S., Arıkan, M. K., & Tarhan, K. N. (2020). Use of EEG for Predicting Treatment Response to Transcranial Magnetic Stimulation in Obsessive Compulsive Disorder. Clinical EEG and Neuroscience, 51(3), 139–145. [DOI:10.1177/1550059419879569] [PMID]
Kaplan Sadock, B. (2003). Sadock's synopsis of psychiatry: behavioral sciences, clinical psychiatry. macological therapy in anxiety disorders. Dialogues in Clinical Neuroscience, 17(3), 305–317. [DOI:10.31887/DCNS.2015.17.3/emaron] [PMID]
Karadag, F., Oguzhanoglu, N. K., Kurt, T., Oguzhanoglu, A., Ateşci, F., & Ozdel, O. (2003). Quantitative EEG analysis in obsessive compulsive disorder. The International Journal of Neuroscience, 113(6), 833–847. [DOI:10.1080/00207450390200963] [PMID]
Keitner, G. I., Ryan, C. E., Miller, I. W., & Norman, W. H. (1992). Recovery and major depression: factors associated with twelve-month outcome. The American Journal of Psychiatry, 149(1), 93–99. [DOI:10.1176/ajp.149.1.93] [PMID]
Knott, V., Mahoney, C., Kennedy, S., & Evans, K. (2000). Pre-treatment EEG and it's relationship to depression severity and paroxetine treatment outcome. Pharmacopsychiatry, 33(6), 201–205. [DOI:10.1055/s-2000-8356] [PMID]
NeuroGuide™ by Applied Neuroscience, Inc. (2023). Advanced Features that make NeuroGuide™ the Best for Professional Mental Health Care Providers and Researchers. Retrieved from [Link]
Olfson, M., Marcus, S. C., Tedeschi, M., & Wan, G. J. (2006). Continuity of antidepressant treatment for adults with depression in the United States. The American Journal of Psychiatry, 163(1), 101–108. [DOI:10.1176/appi.ajp.163.1.101] [PMID]
Prichep, L. S., Mas, F., Hollander, E., Liebowitz, M., John, E. R., & Almas, M., et al. (1993). Quantitative electroencephalographic subtyping of obsessive-compulsive disorder. Psychiatry Research, 50(1), 25–32. [DOI:10.1016/0925-4927(93)90021-9] [PMID]
Rajabi, Gh. (2007). [Validating of the Padua obsessive-compulsion inventory in freshman students of Shahid Chamran University of Ahvaz (Persian). The Quarterly Journal of Fundamentals of Mental Health, 8(33), 43-52. [Link]
Rabiee, M., Khorramdel, K., Kalantari, M., Molavi, H. (2010). [Factor structure, validity and reliability of the modified Yale-Brown obsessive compulsive scale for body dysmorphic disorder in students. Iranian Journal of Psychiatry and Clinical Psychology. 15(4):343-350. [Link]
Ruscio, A. M., Stein, D. J., Chiu, W. T., & Kessler, R. C. (2010). The epidemiology of obsessive-compulsive disorder in the National Comorbidity Survey Replication. Molecular Psychiatry, 15(1), 53–63[DOI:10.1038/mp.2008.94] [PMID]
Rush, A. J., Warden, D., Wisniewski, S. R., Fava, M., Trivedi, M. H., & Gaynes, B. N., et al. (2009). STAR*D: Revising conventional wisdom. CNS Drugs, 23(8), 627–647. [PMID]
Rush A. J. (2007). Limitations in efficacy of antidepressant monotherapy. The Journal of Clinical Psychiatry, 68 (Suppl 10), 8–10. [PMID]
Sadock, B. J., Sadock, V. A. (2009). Kaplan and Sadock’s Comprehensive Textbook of Psychiatry. Philadelphia: Wolters Kluwer Health/Lippincott Williams & Wilkins. [Link]
Salehi, M., Salarifar, M., & Hadian, M. (2003). The frequency pattern of compulsive disorder-OCD. Journal of New Cognitive Science, 6(2), 87-94. [Link]
Sinha, S. R., Sullivan, L., Sabau, D., San-Juan, D., Dombrowski, K. E., & Halford, J. J., et al. (2016). American Clinical Neurophysiology Society Guideline 1: Minimum Technical Requirements for Performing Clinical Electroencephalography. Journal of Clinical Neurophysiology: Official Publication of The American Electroencephalographic Society, 33(4), 303–307. [DOI:10.1097/WNP.0000000000000308] [PMID]
Spronk, D., Arns, M., Barnett, K. J., Cooper, N. J., & Gordon, E. (2011). An investigation of EEG, genetic and cognitive markers of treatment response to antidepressant medication in patients with major depressive disorder: A pilot study. Journal of Affective Disorders, 128(1-2), 41–48. [DOI:10.1016/j.jad.2010.06.021] [PMID]
Stefan, S., Schorr, B., Lopez-Rolon, A., Kolassa, I. T., Shock, J. P., & Rosenfelder, M., et al. (2018). Consciousness Indexing and Outcome Prediction with Resting-State EEG in Severe Disorders of Consciousness. Brain Topography, 31(5), 848–862. [DOI:10.1007/s10548-018-0643-x] [PMID]
Trivedi, M. H., Fava, M., Wisniewski, S. R., Thase, M. E., Quitkin, F., & Warden, D., et al. (2006). Medication augmentation after the failure of SSRIs for depression. The New England Journal of Medicine, 354(12), 1243–1252. [DOI:10.1056/NEJMoa052964] [PMID]
Tot, S., Ozge, A., Cömelekoğlu, U., Yazici, K., & Bal, N. (2002). Association of QEEG findings with clinical characteristics of OCD: evidence of left frontotemporal dysfunction. Canadian Journal of Psychiatry. Revue Canadienne de Psychiatrie, 47(6), 538–545. [DOI:10.1177/070674370204700605] [PMID]
Tolonen, A., Särkelä, M. O. K., Takala, R. S. K., Katila, A., Frantzén, J., & Posti, J. P., et al. (2018). Quantitative EEG Parameters for Prediction of Outcome in Severe Traumatic Brain Injury: Development Study. Clinical EEG and Neuroscience, 49(4), 248–257. [PMID]
van Tricht, M. J., Ruhrmann, S., Arns, M., Müller, R., Bodatsch, M., & Velthorst, E., et al. (2014). Can quantitative EEG measures predict clinical outcome in subjects at Clinical High Risk for psychosis? A prospective multicenter study. Schizophrenia Research, 153(1-3), 42–47. [DOI:10.1016/j.schres.2014.01.019] [PMID]
Vikas, A., Avasthi, A., & Sharan, P. (2011). Psychosocial impact of obsessive-compulsive disorder on patients and their caregivers: a comparative study with depressive disorder. The International Journal of Social Psychiatry, 57(1), 45–56. [DOI:10.1177/0020764009347333] [PMID]
Venneman, S., Leuchter, A., Bartzokis, G., Beckson, M., Simon, S. L., Schaefer, M., ... & Ling, W. (2006). Variation in neurophysiological function and evidence of quantitative electroencephalogram discordance: predicting cocaine-dependent treatment attrition. The Journal of Neuropsychiatry and Clinical Neurosciences, 18(2), 208-216. [DOI:10.1176/appi.neuropsych.18.2.208]
Warden, D., Trivedi, M. H., Wisniewski, S. R., Davis, L., Nierenberg, A. A., & Gaynes, B. N., et al. (2007). Predictors of attrition during initial (citalopram) treatment for depression: A STAR*D report. The American Journal of Psychiatry, 164(8), 1189–1197. [DOI:10.1176/appi.ajp.2007.06071225] [PMID]
Widge, A. S., Bilge, M. T., Montana, R., Chang, W., Rodriguez, C. I., & Deckersbach, T., et al. (2019). Electroencephalographic Biomarkers for Treatment Response Prediction in Major Depressive Illness: A Meta-Analysis. The American Journal of Psychiatry, 176(1), 44–56. [DOI:10.1176/appi.ajp.2018.17121358] [PMID]
Type of Study: Original |
Subject:
Cognitive Neuroscience
Received: 2022/08/20 | Accepted: 2023/09/4 | Published: 2025/03/18
Received: 2022/08/20 | Accepted: 2023/09/4 | Published: 2025/03/18
Send email to the article author
| Rights and permissions | |
 |
This work is licensed under a Creative Commons Attribution-NonCommercial 4.0 International License. |
![]()
Copyright © The Author(s);
This is an open access article distributed under the terms of the Creative Commons Attribution License (CC-By-NC), which permits use, distribution, and reproduction in any medium, provided the original work is properly cited and is not used for commercial purposes.
Contact Information
