

Volume 15, Issue 3 (May & Jun 2024)
BCN 2024, 15(3): 367-382 |
Back to browse issues page


Download citation:
BibTeX | RIS | EndNote | Medlars | ProCite | Reference Manager | RefWorks
Send citation to:


BibTeX | RIS | EndNote | Medlars | ProCite | Reference Manager | RefWorks
Send citation to:
Zolghadr Z, Batouli S A H, Alavi Majd H, Shafaghi L, Mehrabi Y. fMRI-Based Multi-class DMDC Model Efficiently Decodes the Overlaps between ASD and ADHD. BCN 2024; 15 (3) :367-382
URL: http://bcn.iums.ac.ir/article-1-2487-en.html
URL: http://bcn.iums.ac.ir/article-1-2487-en.html
Zahra Zolghadr1 

 , Seyed Amir Hossein Batouli2 , Hamid Alavi Majd1 , Lida Shafaghi2 , Yadollah Mehrabi *3
, Seyed Amir Hossein Batouli2 , Hamid Alavi Majd1 , Lida Shafaghi2 , Yadollah Mehrabi *3
1- Department of Biostatistics, School of Allied Medical Sciences, Shahid Beheshti University of Medical Sciences, Tehran, Iran.
2- Department of Neuroscience and Addiction Studies, School of Advanced Technologies in Medicine, Tehran University of Medical Sciences, Tehran, Iran.
3- Department of Epidemiology, School of Public Health and Safety, Shahid Beheshti University of Medical Sciences, Tehran, Iran.
2- Department of Neuroscience and Addiction Studies, School of Advanced Technologies in Medicine, Tehran University of Medical Sciences, Tehran, Iran.
3- Department of Epidemiology, School of Public Health and Safety, Shahid Beheshti University of Medical Sciences, Tehran, Iran.
Keywords: Functional connectivity, data maximum dispersion classifier (DMDC), fMRI, Classification, Autism, Attention deficit hyperactivity disorder (ADHD), High-dimensional low sample size, ADHD-200, Autism brain imaging data exchange (ABIDE)
Full-Text [PDF 3207 kb]
| Abstract (HTML)
Full-Text:
1. Introduction
Autism spectrum disorder (ASD) and attention-deficit/hyperactivity disorder (ADHD) are heterogeneous states with developmental origins and significantly heritable patterns (Thapar & Rutter, 2015). ASD is characterized by age-inappropriate levels of persistent impaired attention and/or hyperactivity and impulsivity, while ADHD encompasses a specific set of disorders characterized by poor social communication/interaction, stereotypical behaviors, and a restricted range of interests (Guha, 2014). These two diagnoses widely affect various dimensions of patients’ lives, may persist into adulthood, and often co-occur (Brookman-Frazee et al., 2018); approximately thirteen percent of participants in an epidemiological study on ADHD were diagnosed with ASD simultaneously (Zablotsky et al., 2020). Other reports have also shown that about 13% of individuals with ADHD receive an ASD diagnosis (Jensen & Steinhausen, 2015). Another study indicated that more than one-fifth of individuals diagnosed with ASD also exhibit ADHD-associated traits; impulsion and inattention are often present in ASD. Regarding heritability, family studies have reported that having relatives with ASD increases the likelihood of receiving an ADHD diagnosis (Ghirardi et al., 2018; Ghirardi et al., 2019; Jokiranta-Olkoniemi et al., 2016; Musser et al., 2014). Although numerous investigations have consistently demonstrated shared genetic components, endophenotypic attributes, and autism-related phenomena in children and adolescents with confirmed ADHD diagnoses and vice versa (Gadow et al., 2006; Simonoff et al., 2008; Yerys et al., 2009), the distinctions in the core psychopathologies of these disorders are well-established (Clark et al., 1999; Grzadzinski et al., 2011; Grzadzinski et al., 2016; Kotte et al., 2013; Kröger et al., 2011; Martin et al., 2014; Mulligan et al., 2009). However, the significant interconnectedness between core behavioral symptoms and certain types of comorbidities (e.g. depression, anxiety, and sleep disturbances) of ADHD and ASD complicates differential diagnosis, prognosis (Grzadzinski et al., 2016), and treatment outcomes; therefore, more clarification of the neuropathophysiological aspects of ADHD, ASD, and ASD+ADHD could be crucial (Craig et al., 2015).
There is limited overlap in neural correlates between individuals with ADHD and those with ASD concerning resting-state connectivity or functional network organizations. Recognizing brain connectivity patterns is a promising approach for the characterization, diagnosis, and prediction of pathologies linked to the abnormal functional or structural organization of the brain. Functional connectivity refers to the temporal correlation of oscillatory activities within the BOLD signal related to distinct nodes of the cerebrum. Recent evidence suggests that connectivity between brain regions significantly contributes to understanding emotional regulation and the hierarchy of cognitive processing. Despite methodological variations, existing research findings (Bethlehem et al., 2017; Di Martino et al., 2013) suggest that ADHD and ASD could be considered large-scale brain connectivity disorders, albeit with insignificant similarities in the specific regions, as confirmed by meta-analyses (Dougherty et al., 2016; Rommelse et al., 2017). The attention-related insufficiencies (sustained attention and attentional shifts) are proposed as frequently observed links between ASD and ADHD. Notably, analyzing functional neuroimaging investigations yields high-dimensional data for a typically small number of subjects, necessitating novel computational approaches.
Classification is a crucial task in statistics and supervised machine learning with numerous applications in various basic and clinical fields (diagnostic and therapeutic), such as image processing. Extensive literature reviews have identified numerous research works on the application of classification methods for discriminating ADHD and Autism based on functional neuroimaging data (Abraham et al., 2017; Itani et al., 2018; Liber et al., 2015; Nielsen et al., 2013). These studies, with varying levels of accuracy, have indicated some specific dimensions of functional neural correlates regarding neurodevelopmental disorders, such as the role of the cerebellum, prefrontal cortices, and temporal lobe contributions to pathogenesis. Some studies have compared both disorders simultaneously but in separate settings without integration (Ghiassian et al., 2016), contrasting ADHD vs Healthy and ASD vs (not ADHD/ASD vs Healthy). The current modeling aims to integrate and compare both disorders with their corresponding healthy states in a unified framework. Specifically, a dataset is represented as an n×d matrix X, consisting of n data vectors xi (i ∈ {1, 2, . . ., n}) with d features and a class label yi ∈{-1, +1}. Two sets (classes) of d-dimensional training vectors are the starting point of the two-class discrimination process. The discrimination procedure aims to design a rationale to attribute the labels of -1 or 1 to the vectors of newly added data (the vectors might be “closer to class +1” or “closer to class −1”) (Zou, 2019).
Support vector machine (SVM) is a widely applied method for classifying structural and functional neuroimaging-derived variables in the clinical setting, as it avoids over-fitting even with a smaller number of samples and delivers high classification accuracy Bledsoe et al., 2020). It also provides individual classification (patient vs control) according to a boundary that is called a decision boundary (i.e. hyperplane) that separates data into two groups. The linear SVM seeks a hyperplane {x:=0} that maximizes all data points’ smallest margin (Cortes & Vapnik, 1995).
Performance degradation is a recurring challenge in conventional machine learning methods, making it a specific concern in statistics when analyzing high-dimension low–sample size (HDLSS) datasets. When working with HDLSS, and specifically during the data projection onto the normal vector of the separating hyperplane, data pilling occurs; which in some HDLSS situations, might influence the SVM performance (Zou, 2019). The data maximum dispersion classifier (DMDC), applicable to general data, especially HDLSS, serves as a novel linear binary classifier. DMDC notably increases data dispersion, thereby inhibiting data pilling. Moreover, it performs well on HDLSS, remains invariant to the intercept term, and involves a straightforward implementation process with minimal computational loads (Shen & Yin, 2020). Another critical aspect is constituting a reasonable interpretation of the ultimate coefficients. The models mentioned earlier and their improved versions could classify the high dimensional observations, but since the standard SVM-based models employ all the variables due to the L2-norm penalty (‖β‖2), providing an appropriate description of the findings and making the results more interpretable requires approaching toward L1-norm regularized method. In these sparse methods, some entries of β are set to zero, facilitating interpretation as only a subset of input features is deemed relevant for the final predictive algorithm. In 2003, Zhu et al. developed and introduced the sparse version of the support vector machine (Zhu et al., 2003), proving beneficial for the neuroscience domain. One recent study, Sen et al. (2018) aimed to identify and classify neuroimaging data using structural and functional connectivity characteristics, exploring a series of three learners. Additionally, Ghiassian et al. proposed a classification method based on MRI-derived histograms of oriented gradients (HOG) features and personal information, describing an algorithm capable of efficacious classification for ASD and ADHD. Their framework achieved 69.6% accuracy in classifying ADHD from controls (over a baseline of 55.0%) (Ghiassian et al., 2016).
Since all existing investigations have applied two-class classification techniques (ADHD/ASD vs healthy controls) that are not entirely able to categorize disorders and decode the ambiguities in neural correlates between ADHD and ASD, we aimed to apply a novel multi-class classification model called DMDC (Shen & Yin, 2020), on publicly available functional neuroimaging datasets of these two disorders and their healthy counterparts. Through the current project, primarily, we extended binary DMDC to a multiclass version for discrimination between more than two classes, and then we developed a two-level classification model based on this multiclass DMDC algorithm. This model could help solve the problem of data pilling and efficient interpretation of the findings. Then we applied a version of the sparse modified SVM model to find the discriminative functional links between different states (ADHD vs ASD, disordered vs healthy conditions).
2. Materials and Methods
Datasets
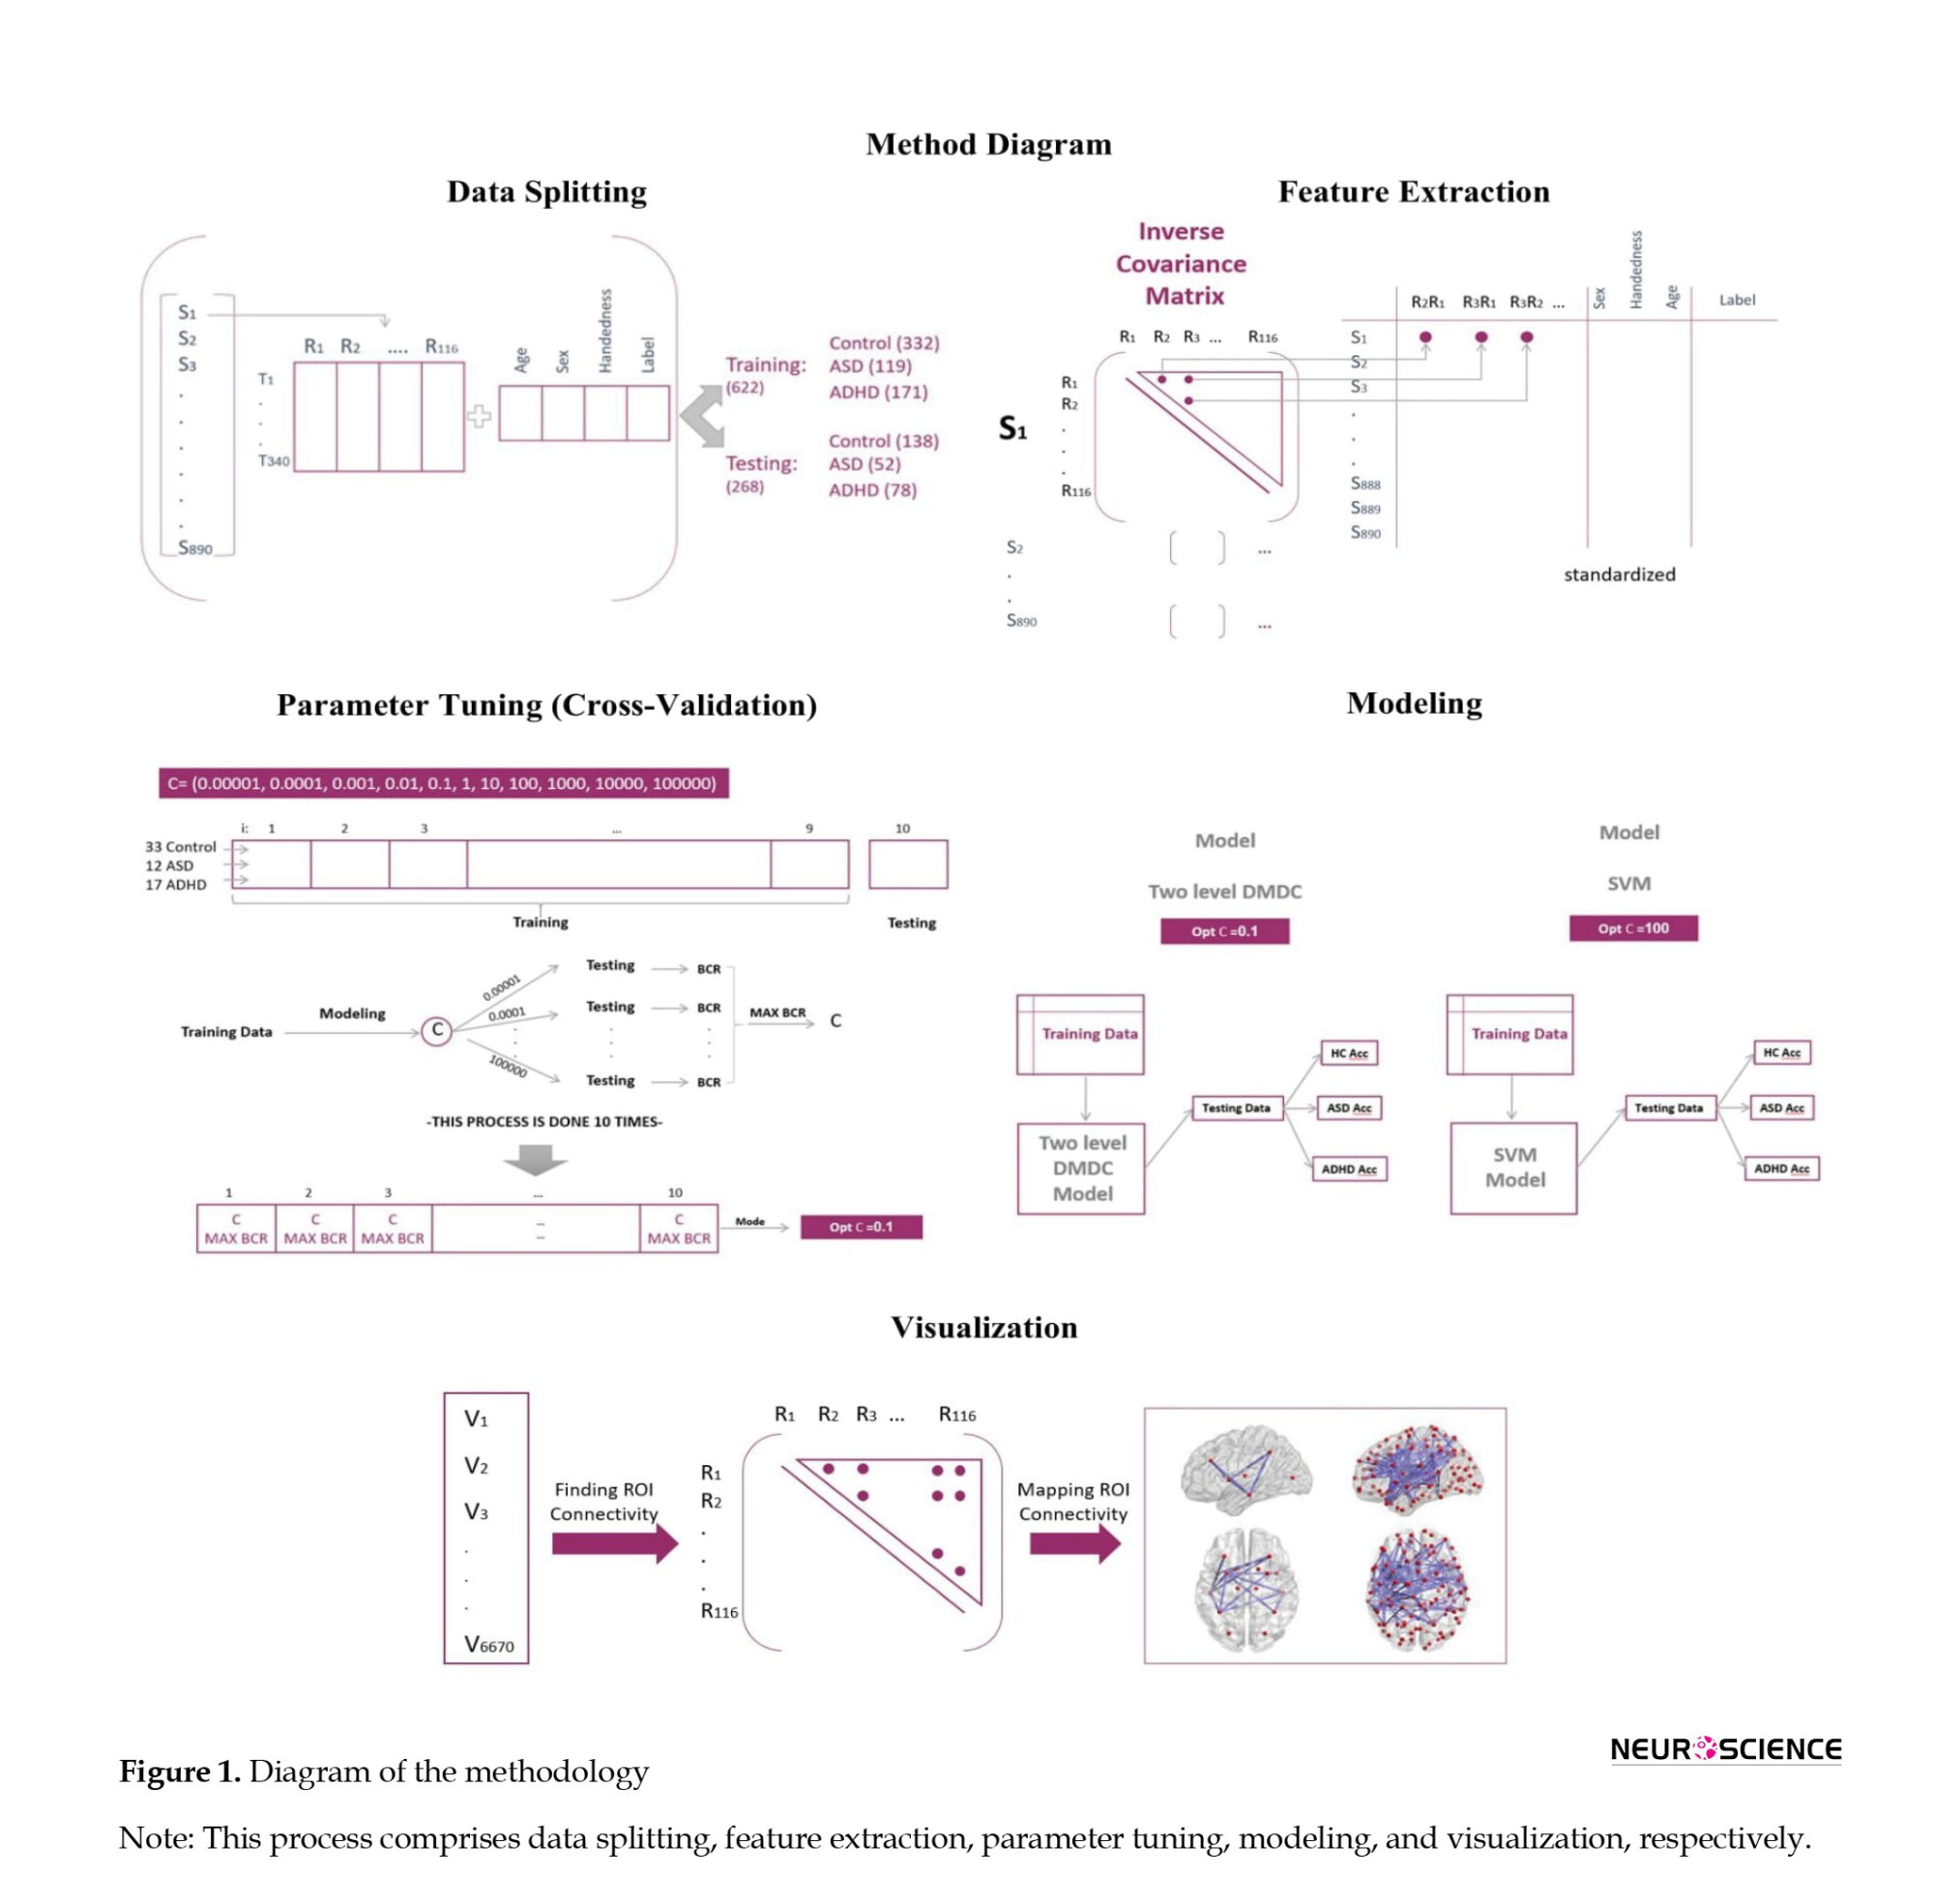
The entire methodology is depicted in Figure 1. In this research, we analyzed ADHD-200 and ABIDE (autism brain imaging data exchange) datasets that are publicly accessible at NITRC. The data collection procedures adhered to predefined approval criteria, and to ensure confidentiality, the collecting institutions anonymized all participant data before making them publicly accessible. Both datasets included resting-state fMRI and T1-weighted images. The ADHD-200 dataset comprised 939 subjects (357 with ADHD and 582 healthy controls) from North America, Europe, and China, with diagnoses made based on algorithmic criteria. The Autism brain imaging data exchange (ABIDE I) dataset was another included dataset. Currently, this collection also comprises resting-state fMRI and T1-weighted structural MRI scans from 1112 participants (573 healthy controls (HC) and 539 patients with autism diagnosis), acquired from standard institutions in North America and Europe. Diagnostic characteristics are available on the referenced websites. To ensure consistency in diagnostic criteria, we reviewed the criteria of all imaging sites and excluded collections that had not assessed the presence of comorbid ADHD according to standard procedures. This process resulted in 388 individual data (217 healthy controls, 171 ASD) remaining for analysis. Similarly, we applied this criterion to the ADHD-200 dataset and limited the data to two sites (253 healthy controls and 249 ADHD patients). Subsequently, we combined the two datasets (ADHD-200 and ABIDE I) and randomly partitioned this combination into 332, 119, and 171 individual data for training procedures respectively for healthy control, ASD, and ADHD groups. For testing partition, 138, 52, and 78 subjects were assigned to the healthy control, ASD, and ADHD groups, respectively. Ultimately, we allocated 30% of the final data for testing and 70% for the training procedure.
Preprocessing
After downloading both datasets, sequential preprocessing steps were performed using FSL software. In order to remove non-brain tissue parts from the structural images, we randomly selected images of three subjects and applied various sets of parameters to identify the most optimized parameters for each data acquisition center. Then MCflirt and rigid body motion correction methods with six specific parameters were performed. In addition, the process of slice-timing correction was performed based on the specific conditions of imaging procedures mentioned in the data acquisition description of each data center. The fMRI data was also motion-corrected, and the voxel intensity was normalized. The band-pass filter was determined to be within the range of 2.8-60 Hz and registered to the MNI-152. Spatial smoothing was performed using full width with half maximum equal to 6 mm. In order to standardize and automate the data preparation process as much as possible, a bash code system was used that was applied to preprocess steps based on the appropriate parameters for each data center.
Feature extraction
The parcellation part was based on the automated anatomical labeling (AAL 116) atlas (the fMRI volumes were
segmented into 116 regions through masking the ALL). Functional connectivity metric provides an index of the level of co-activation of brain regions based on the time series of rs-fMRI brain imaging data. From the regional time series (nt time-points×np regions), time points were variable among different centers, and np was equal to 116. We computed the pairwise inter-regional covariance matrix for each participant. Since the covariance matrix and its inverse are symmetric, the upper triangular elements of these matrices are considered. By adding variables of individual characteristics and the state of communication of the regions, the structures of the datasets were prepared for classification. Also, due to different scattering of fMRI data and individual characteristics (gender, age, and handedness), the values of quantitative variables were standardized by dividing the deviation of each observation from its mean to the standard deviation.
Parameter tunning
We used a 10-fold cross-validation design for parameter tuning. The training data were divided into 10 folds, such that each fold approximately encompassed one-tenth of the training data in a random way to discover the optimum parameter across eleven considered parameters. Through every iteration process, 9 folds of the data were considered as training and this modeling was performed with every 11 parameters. Subsequently, the BCR (balanced classification rate: The average accuracy across classes) index was calculated within that single fold of test data. Ultimately, the parameter with the highest value in each test fold would be selected for the subsequent step. Overall, the mode of the parameter with maximum BCR was obtained and considered as the optimum parameter. This cross-validation process was then performed for either two-level DMDC or SVM models. Furthermore, the current models exhibited acceptable stability during iterations, with insignificant variations in accuracies (below 5%).
Multiclass DMDC
The computational cost of implementing DMDC is low, as it involves solving the convex quadratic programming formulation similar to SVM (Equation 1):
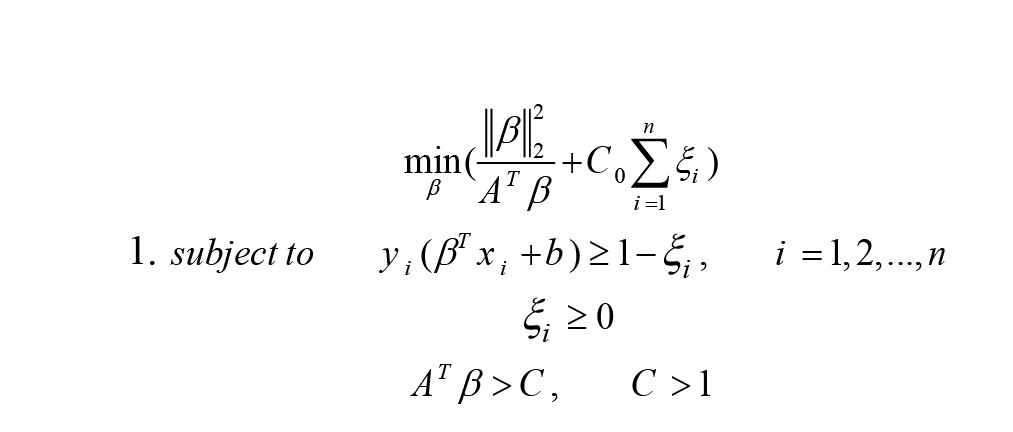
A is the eigenvector related to the largest eigenvalue of Sβ (Equation 2).
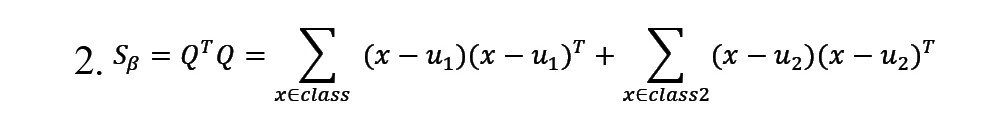
In this equation, uj represents the mean of training samples from the jj-th class, where j=1, 2. The term AT β is utilized to manage the training samples. Following optimization and the formation of f(x), if f(x)>0, the new sample would be classified as belonging to classy=+1, otherwise, it would be classified as belonging to classy=-1 (Shen & Yin, 2020).
As the current output variable (y) encompasses more than two classes and cannot be modeled by binary DMDC, we used a novel methodological framework derived from a one-vs-one strategy. This approach splits the multiclass dataset into one binary classification problem for each pair of classes. By applying our method, any two classes of output variables are defined based on the binary DMDC model; then, we will have
(k(k-1))⁄2 binary classification (k is the number of classes in the target variable space). Consequently, for each observation, there will be an equal number of predicted classes. To determine the classification for an observation, the class with the highest frequency is considered as the final predicted label, employing a majority voting approach. When multiple classes show the same frequency, the observations are allocated to the class with a maximum absolute value of f(x). Through applying this technique, more precise classifications will be achieved. We also compared the classic SVM and the DMDC models to ensure better accuracy representation.
Moreover, we designed a two-level DMDC model. In the first level, using the training data, a binary DMDC model discriminates between two states (in this case, healthy control and disordered conditions). In the second level, observations that the designed model assigned the disorder label undergo classification using a multiclass DMDC. This process categorizes healthy states (non-accurately assigned), ASD, and ADHD categories. Subsequently, this two-level classification process is applied to the test dataset and yields an ultimate predicted label, which is then compared with the actual diagnostic labels to assess classification performance to evaluate this two-level classification process.
Regarding the applied SVM model, we calculated the non-zero coefficients as the discriminative links and connections.
3. Results
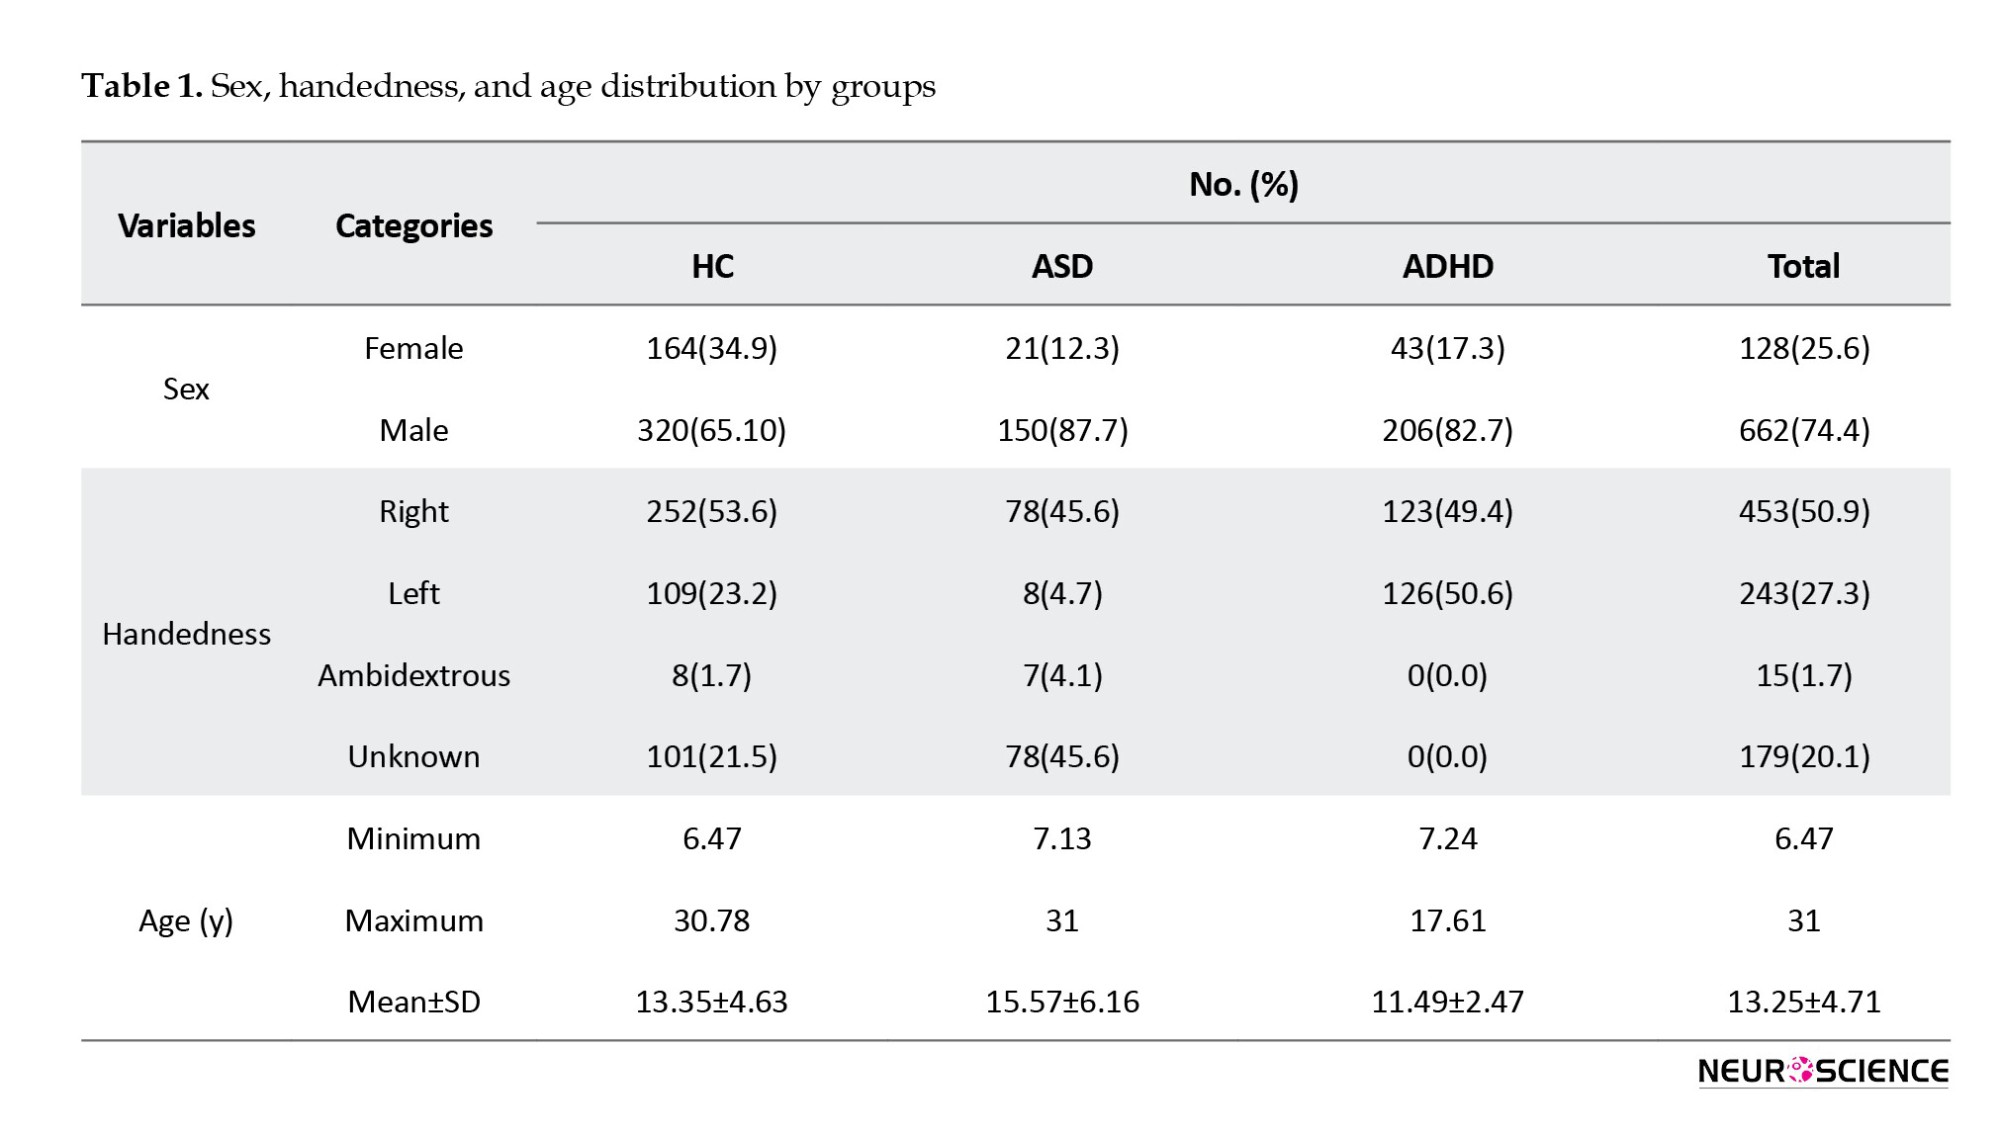
We summarized sex, handedness, and age distribution by groups in Table 1.
Comparison of two models (DMDC vs SVM)
Applying the DMDC model to the test data resulted in a total accuracy of 62%. The model achieved accuracies of 51%, 61%, and 84% for the control, autism spectrum disorder, and ADHD groups, respectively. In the SVM model, an accuracy of 46% was obtained for the healthy control and autism spectrum disorder groups, while an 84% accuracy was observed for ADHD. As shown in Table 2, these two models exhibit similar performance parameters in the ADHD group; however, the discrimination power is higher in the ASD group.
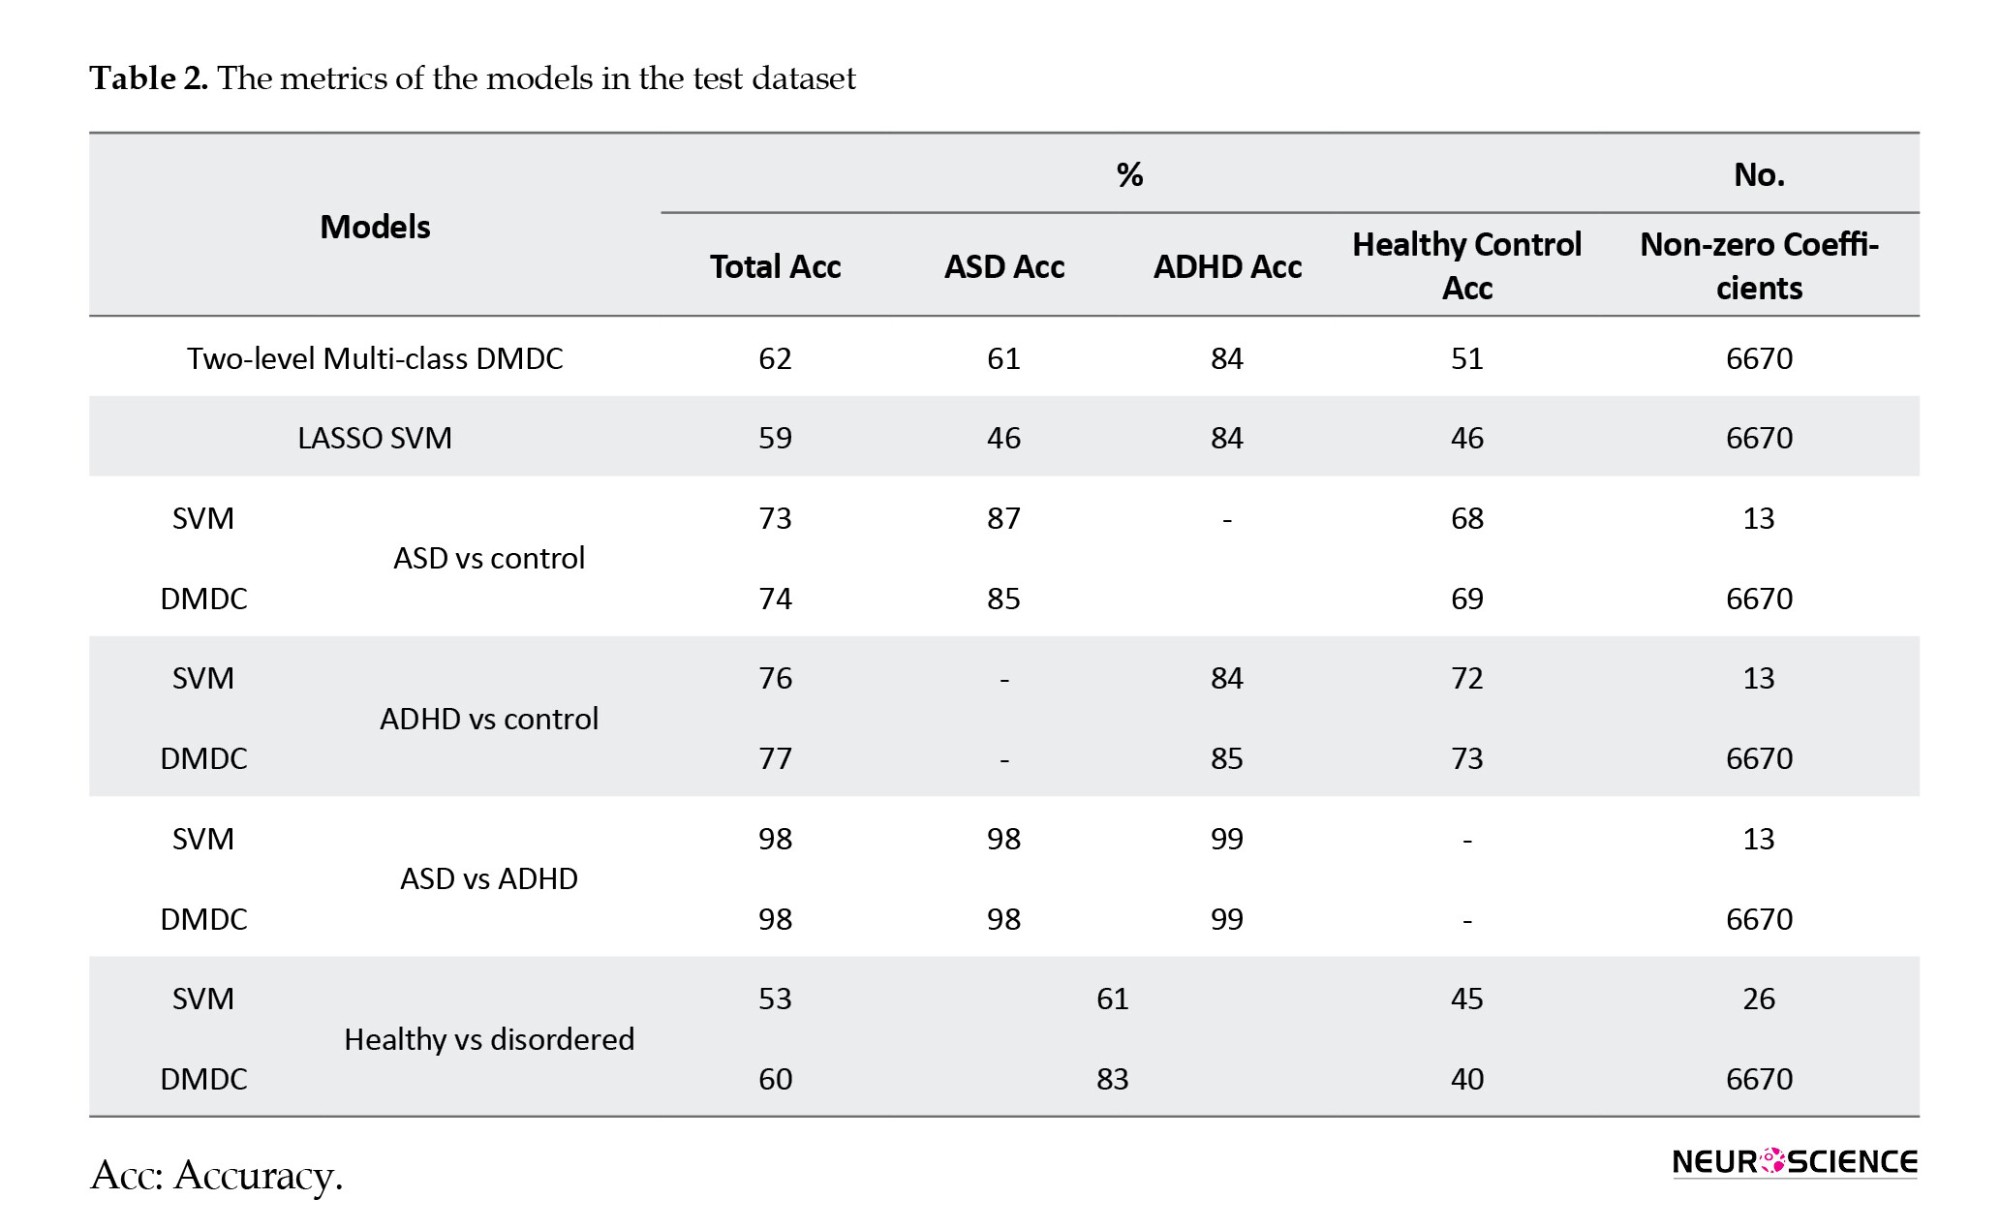
In the context of healthy versus disordered states, the total accuracy was 53%. Specifically, within the healthy group, the accuracy was 45%, and within the disordered group, it was 61%. Overall, around twenty-six connectivity paths exhibited non-zero coefficients.
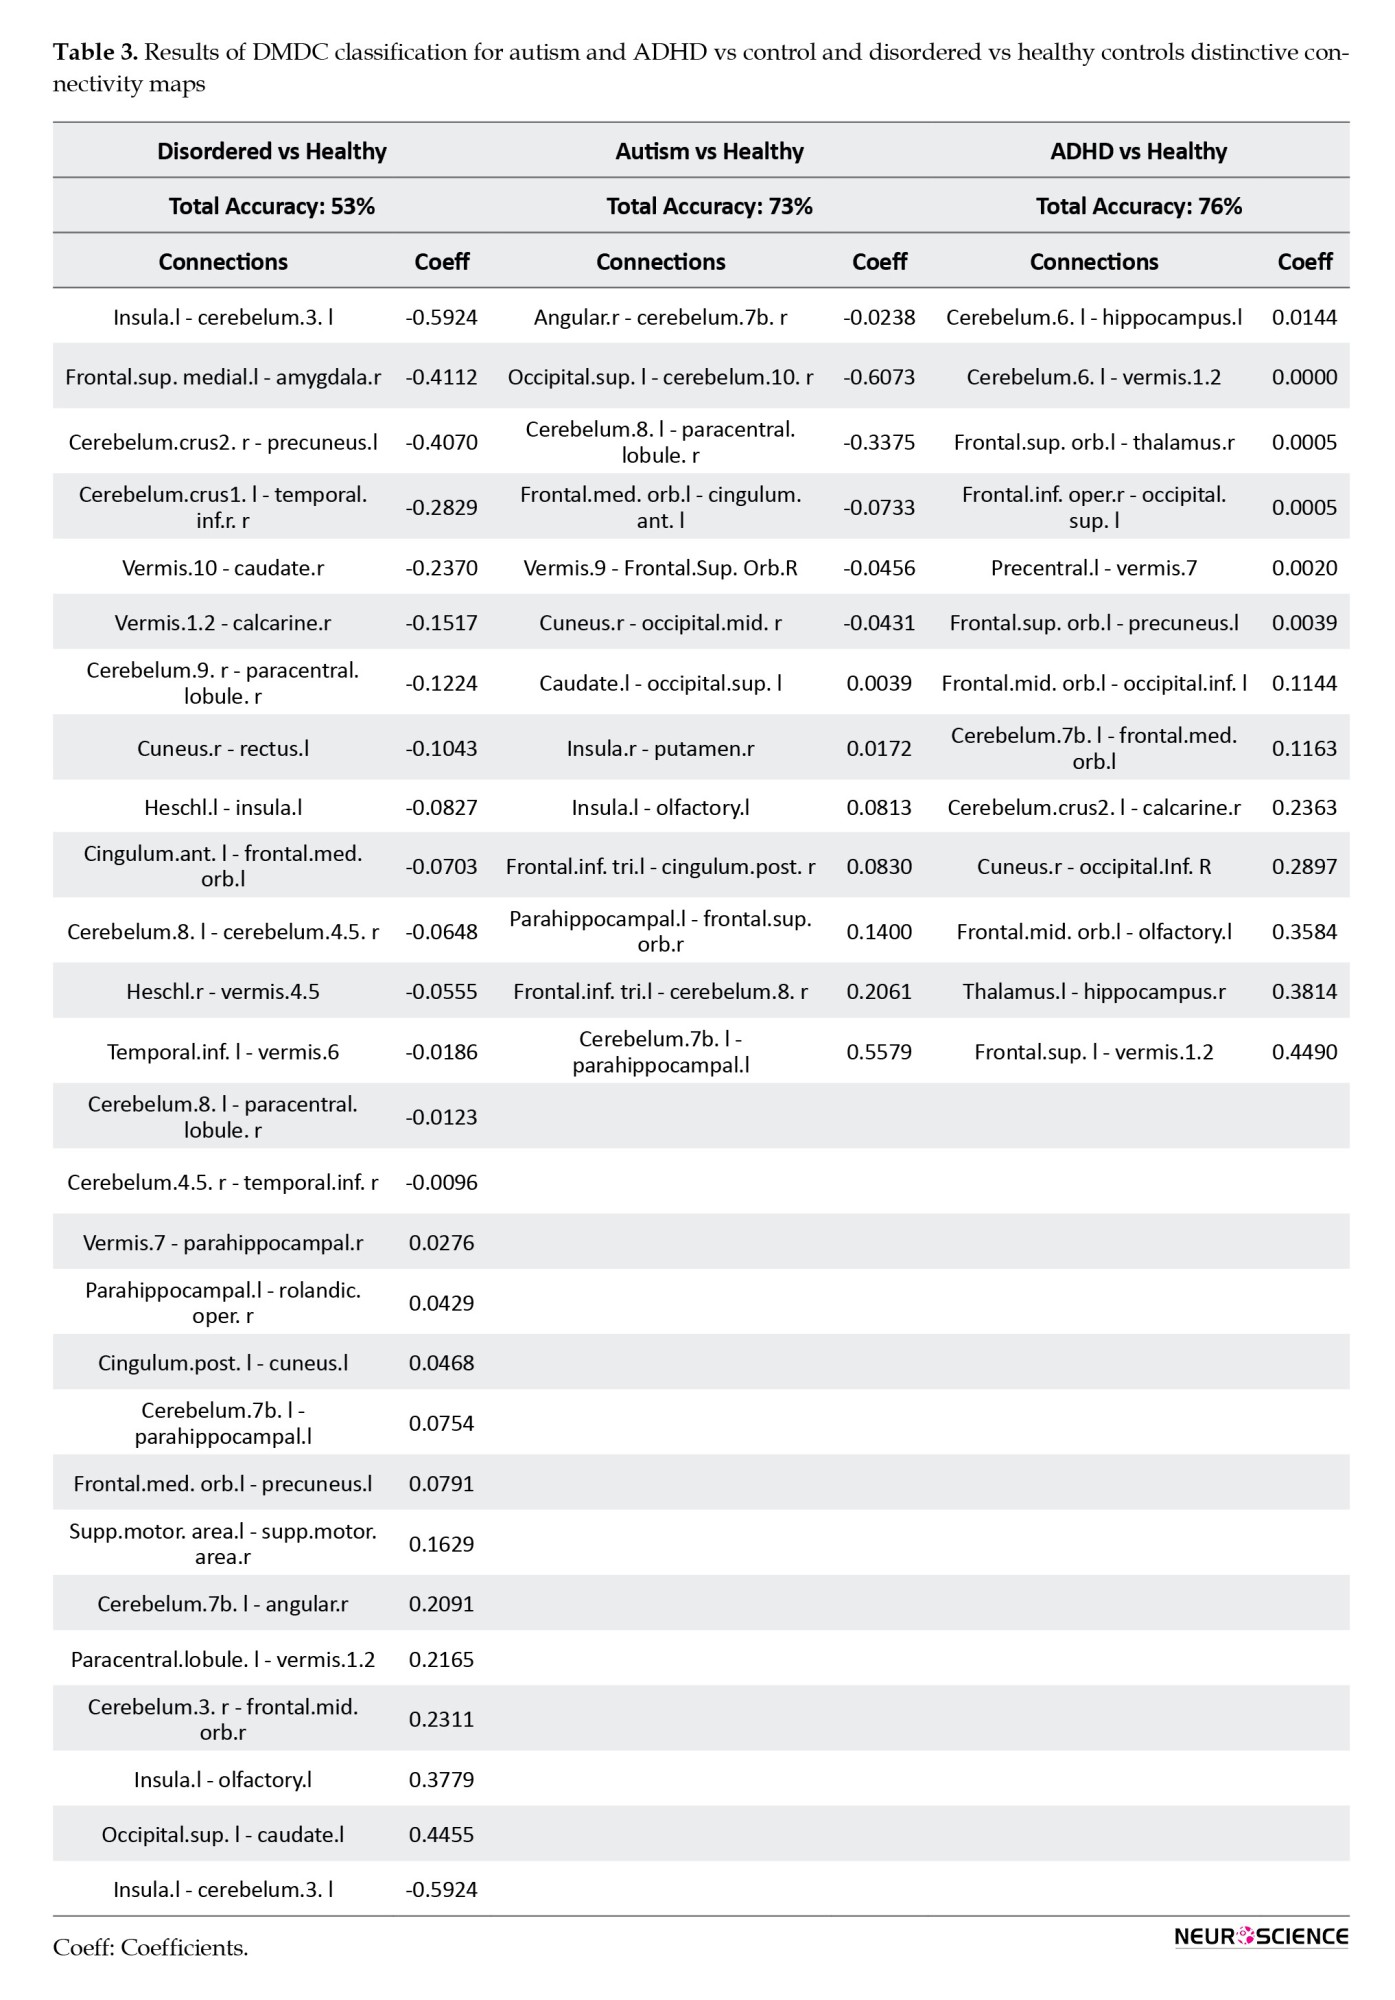
The model differentiated between Autism and control fMRI datasets with a total accuracy of 73%. More specifically, within the control group, the accuracy was 68%, and within the autism spectrum disorder group, it was 87%. Overall, around thirteen connectivity paths exhibited non-zero coefficients (Table 3). In the comparison between ADHD and Control groups, the total accuracy was 76%. Specifically, within the control group, the accuracy was 72%, and within the ADHD group, it was 84%. Overall, approximately thirteen connectivity paths showed non-zero coefficients (Table 3).
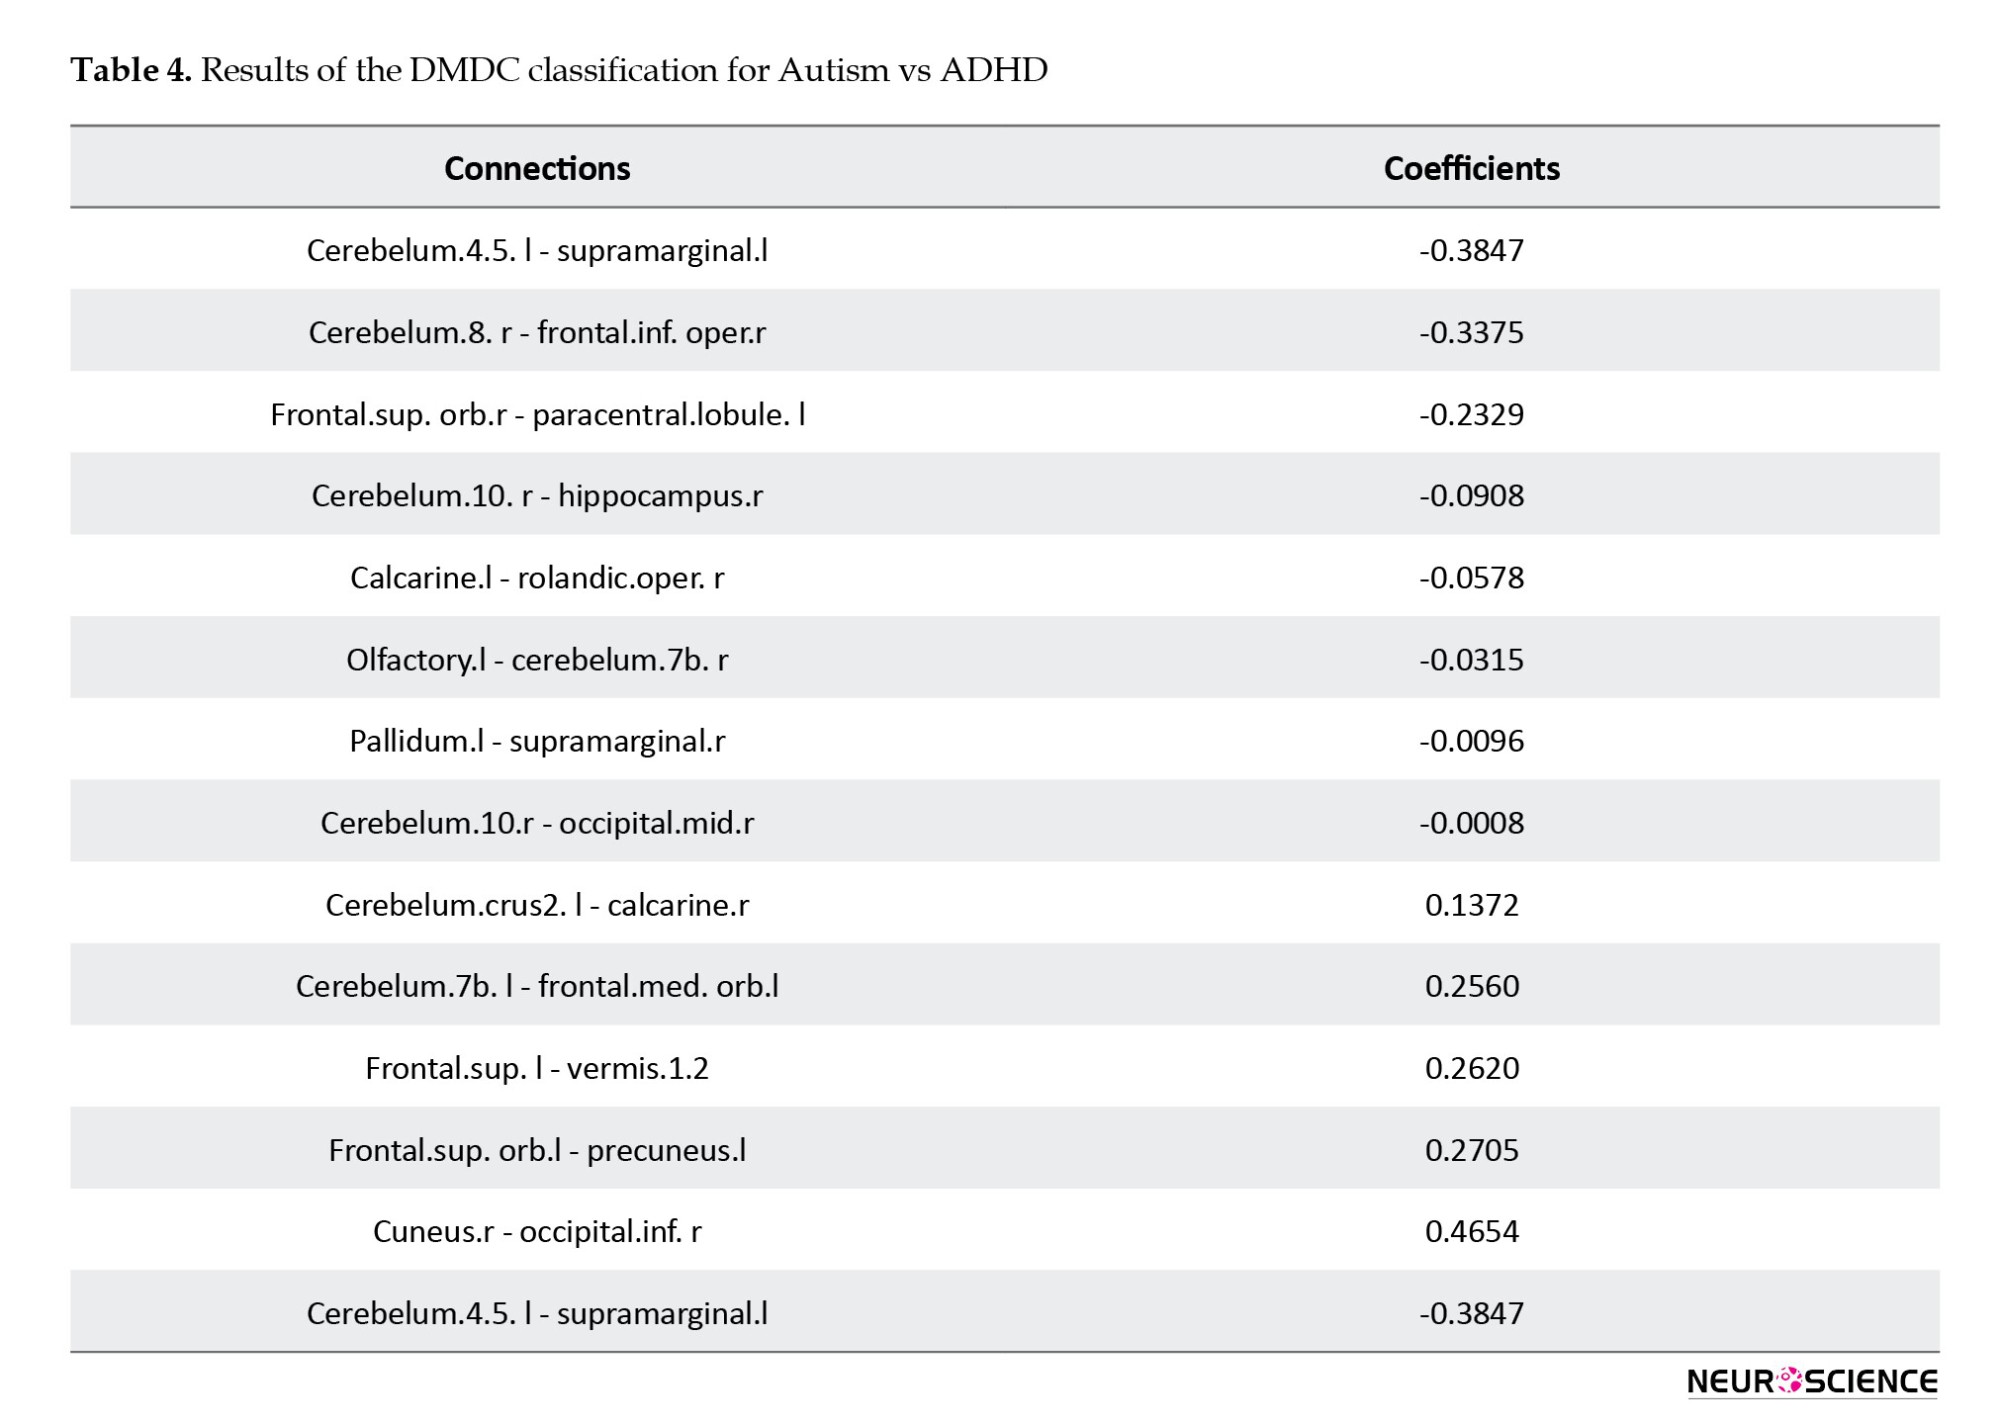
The total accuracy was 98%, with a specific accuracy of 98% within the ASD group and 99% within the ADHD group. Overall, approximately thirteen connectivity paths exhibited non-zero coefficients (Table 4).
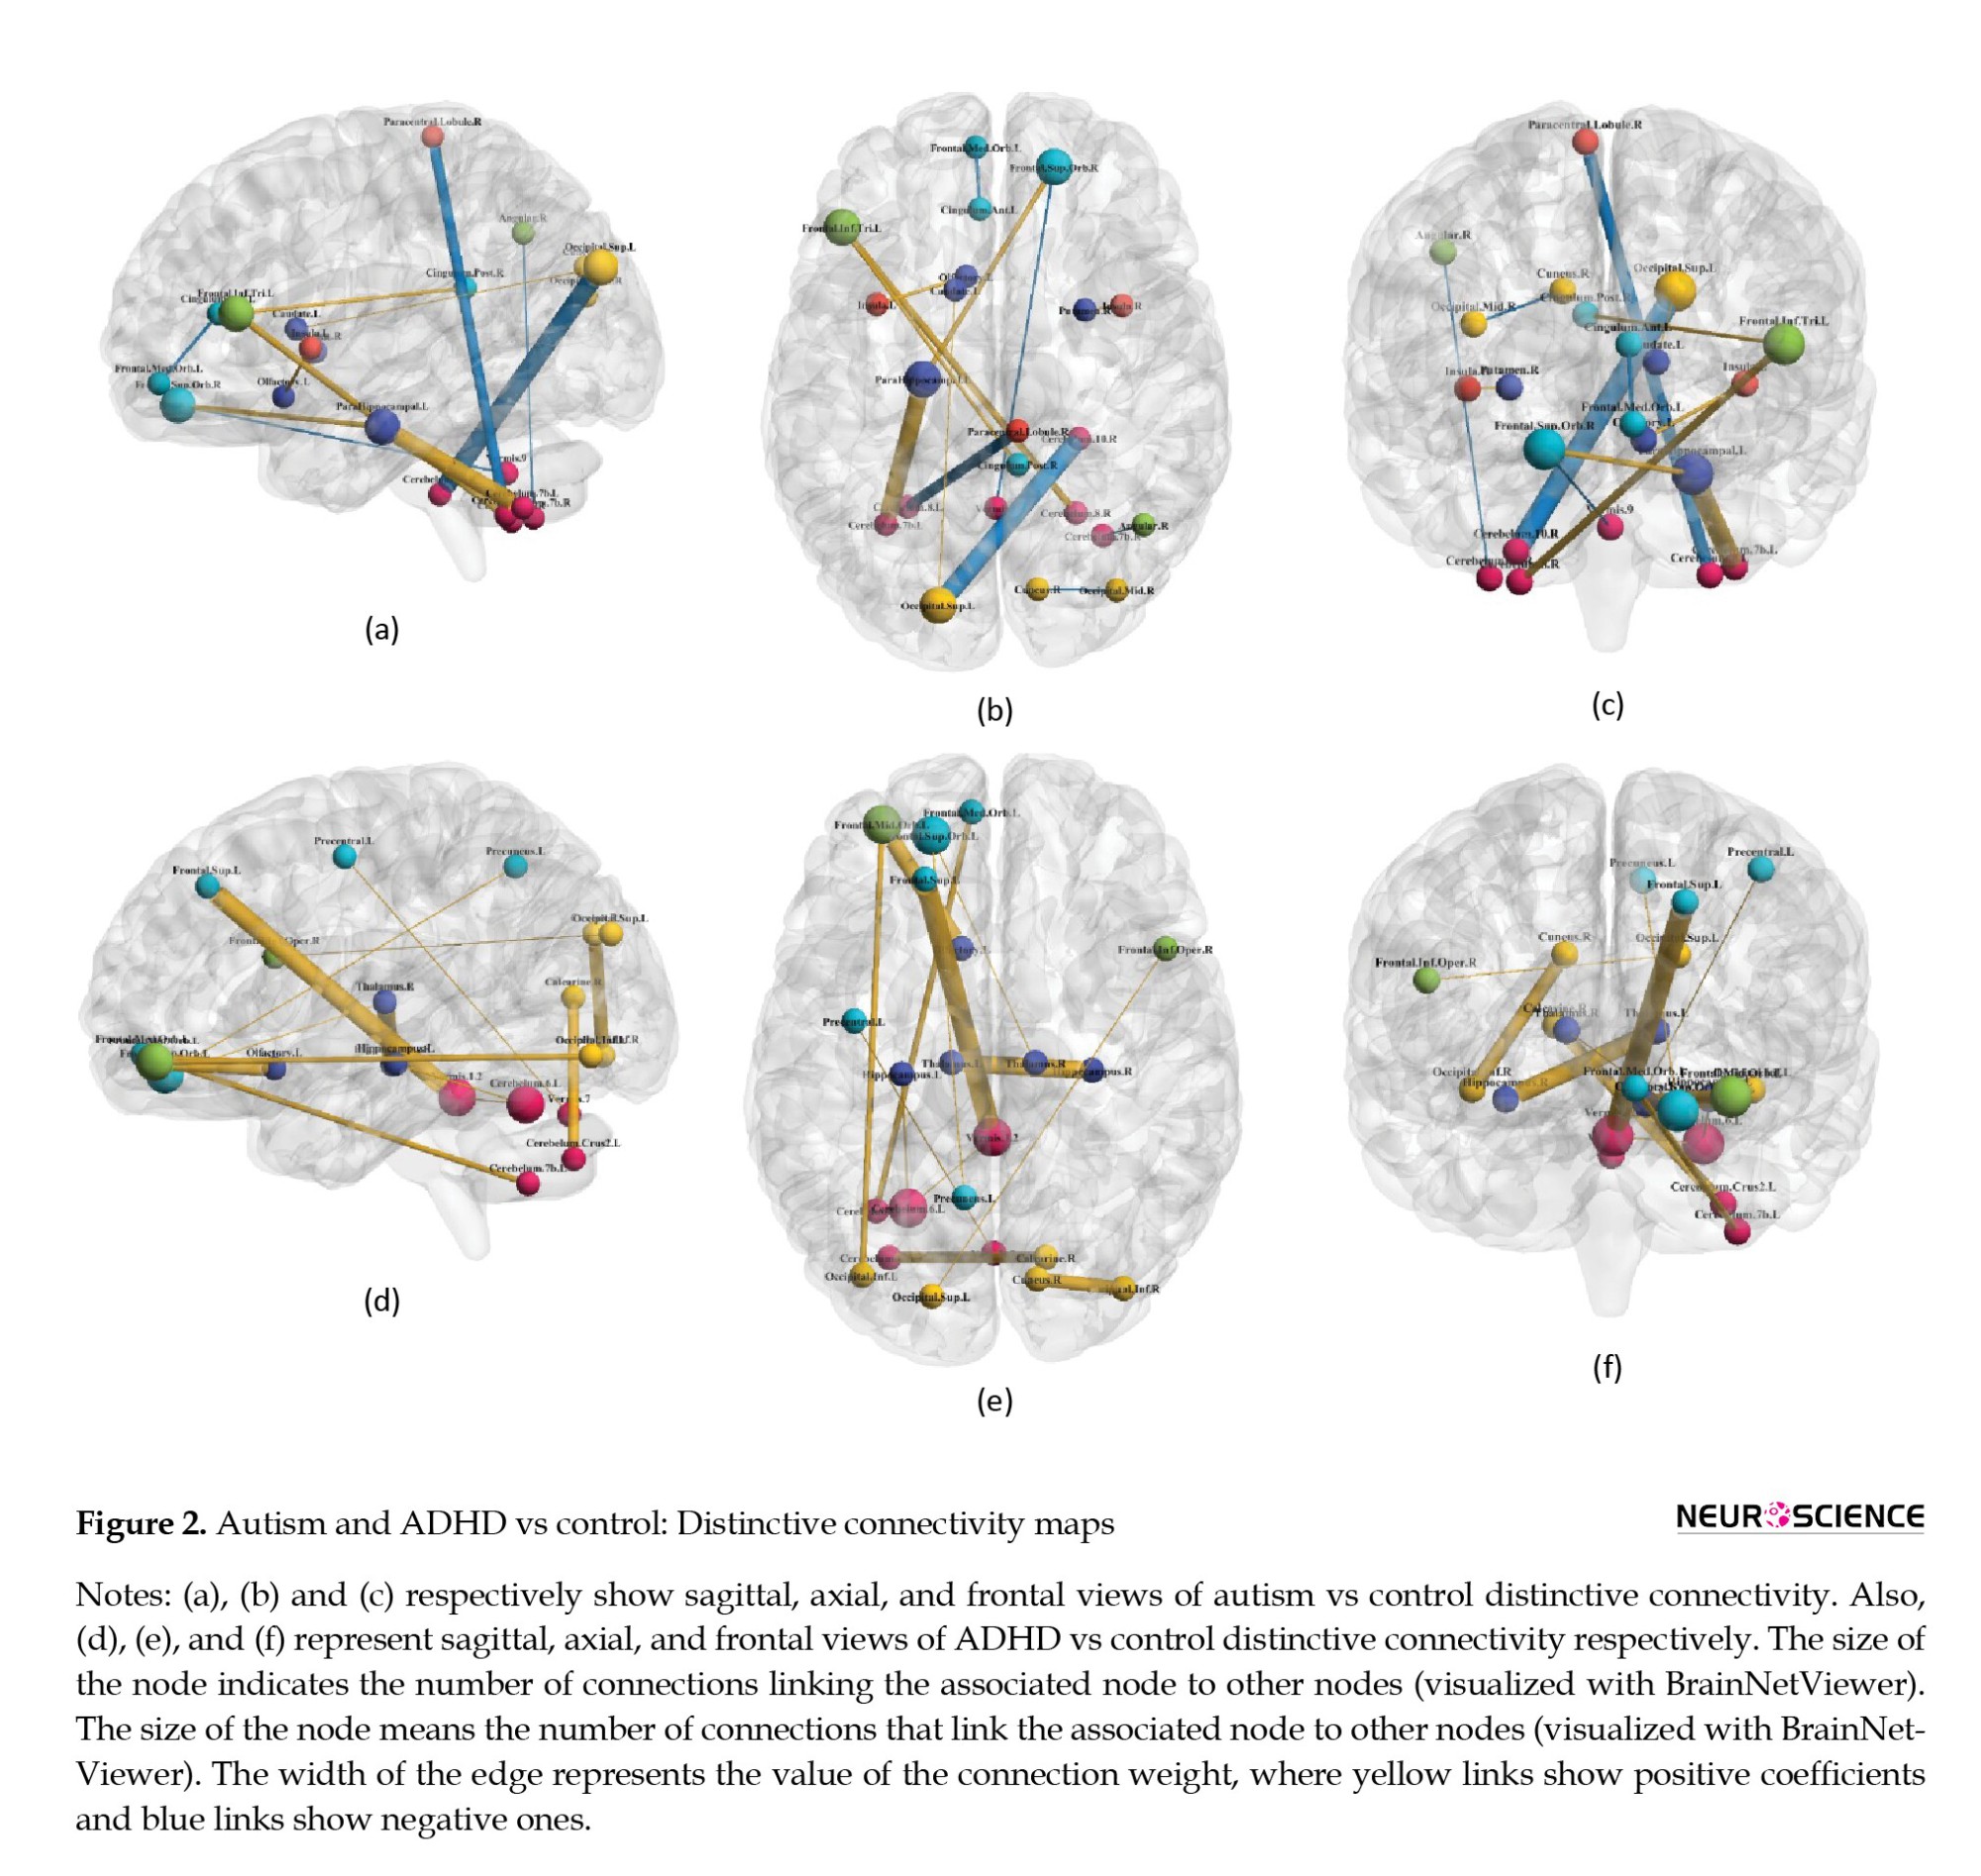
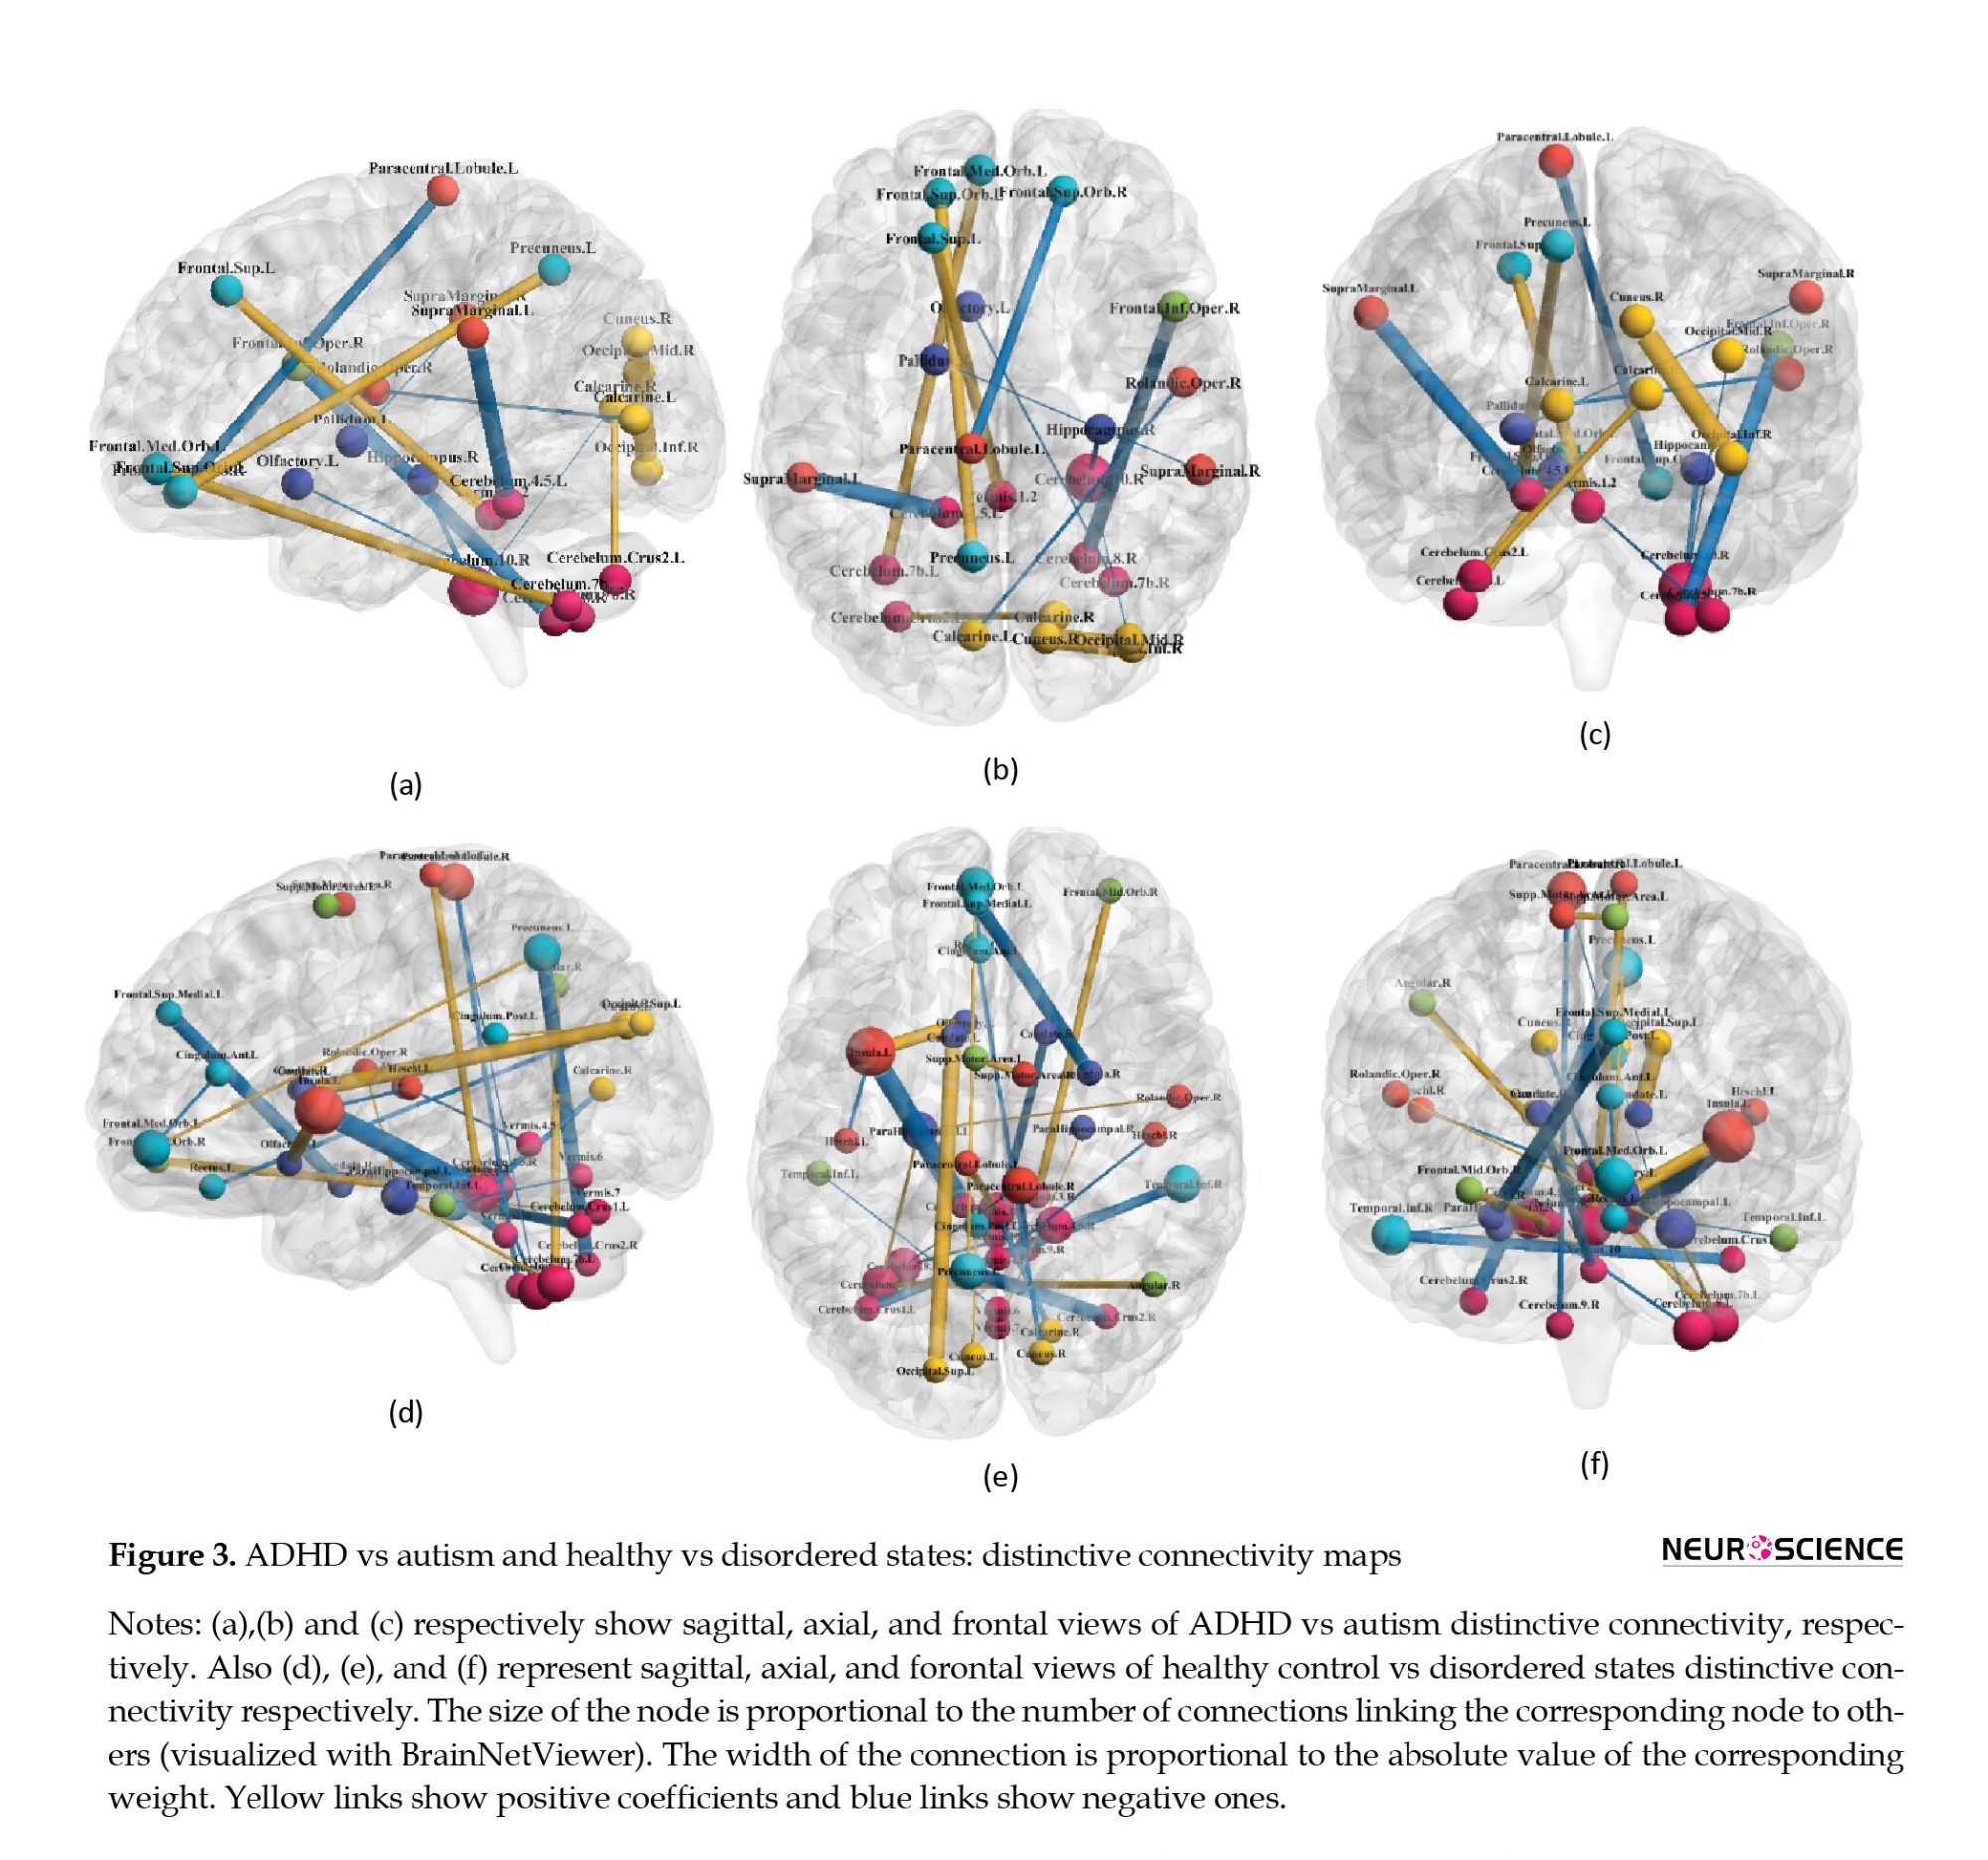
The recognized patterns based on non-zero coefficients are visualized in Figures 2 and 3, as functional connectivity maps.
4. Discussion
ASD and ADHD are neurodevelopmental abnormalities that frequently occur together with below-threshold cross-disorder manifestations (the existence of symptoms of the other one despite not receiving the diagnostic label) (Syed et al., 2017). Since there are ambiguities in diagnosis and subsequent treatment options, in the current study, we used a novel two-level multi-class DMDC algorithm to classify the functional connectivity values for each state of ADHD, ASD, or healthy participants. The obtained values showed that this model might be an efficient extension of the previous support vector machines and could be applied to other disordered states with more than two or even more classes. The total accuracy was 62%, 51% for healthy control subjects, 61% for ASD, and 84% for ADHD. Functional connections of the cerebellum exhibited discriminative features for the two datasets of ADHD-200 and ABIDE.
The currently available diagnostic attitudes that exclusively rely on behavioral findings could provide differentiation; however, there has been evidence supporting the insufficiencies. The shared properties of genetic composition and intermediate phenotypes might blur the diagnostic procedures that depend on subjective clinical judgments, particularly for children and young adolescents exhibiting overlapping symptoms that do not neatly align with the combined form of disorders (ADHD+ASD). Furthermore, accurately expressing internally perceived symptoms can be challenging. Incorporating objective parameters derived from diagnostic tools alongside diagnosis and prognosis processes can potentially enhance treatment approaches. Structural and functional magnetic resonance imaging leverage brain tissue attributes to non-invasively map structural and functional characteristics’ spatial distribution. Regarding neuromodulation, understanding the precise location of the interventions (either transcranial direct current stimulation or transcranial magnetic stimulation) (Cao et al., 2019; Barreiros et al., 2019) assists in determining the pattern of the stimulation, cognitive changes, and probable side effects. While known functional and structural brain abnormalities exist in ASD and ADHD, they alone cannot fully elucidate the disorders’ fundamental aspects. Given the high-dimensional nature of brain connectivity data, designing a computational framework for precise big data identification is imperative.
Several studies have applied machine learning techniques toward diagnosing neurodevelopmental disorders. Nielsen et al., (2013) obtained 60 % accuracy for classifying ASD and typically developed controls using the ABIDE dataset; Abraham et al., (2017) designed individual FC matrices, achieving 67% classification accuracy. Jin et al. (2015) reached a classification accuracy of 76% using a multi-kernel SVM. Additionally, Libero et al. used multimodal data to perform ASD classification (Libero et al., 2015). More recently, Agastinose Ronicko et al. (2020) examined several classifiers and different input parameters, obtaining 65%-70% accuracy. SVM has also been extensively used in the ADHD classification with different fMRI findings and variables. Dos Santos Siqueira et al. (dos Santos Siqueira et al., 2014) designed a functional brain graph according to the classical temporal correlation between nodes and applied SVM-based classification; the highest achieved accuracy value was 65%. Moreover, Itani et al., (2018) extracted statistical-focused parameters from functional imaging data and demographic information, achieving accuracies of 68.3% and 82.4% for the two applied datasets. Despite numerous investigations for each dataset (ABIDE and ADHD-200), only two studies have combined these datasets in one paper. The following studies have approached the discrimination framework but toward a two-class classification (ADHD vs healthy controls and ASD vs healthy controls). The currently presented model has integrated the classes of ADHD, ASD, and healthy controls to compare the functional neural correlates in a more comprehensive manner (achieving a total accuracy of 62% and 51% for healthy controls, 61% for ASD, and 84% for ADHD). Compared to the DMDC, the SVM model provided accuracies of 46% for the healthy control group, 46% for ASD, and 84% for ADHD. As far as we know, t similar merger work has not been previously conducted; however, two modeling-based assessments have yielded acceptable accuracies for ADHD vs healthy controls and ASD vs healthy controls. Sen et al. in their 2018 investigation used structural texture and functional connectivity features obtained from anatomical images and functional scans. They achieved an accuracy of 67.3% on the ADHD-200 data and 64.3% on the ABIDE data. Their modeling algorithm identified key components for ADHD, including nodes of the default mode network, peristriate area, lateral and superior occipital gyrus, frontal and occipital lobe, pons, and temporal lobe. Regarding the ABIDE database, they found remarkable discriminative components comprising the visual areas, with relative similarities to some default mode network-associated areas and motor networks (Sen et al., 2018). Similarly, by applying structural imaging parameters and demographic data, Ghiasian et al. (2016) achieved 69.6% accuracy. They provided an accuracy of 65.0% on a holdout set that was better than that of Nielsen et al., (2013). The image features used by their classifiers encompassed the cortical/subcortical and cerebellar regions. The proposed hypothesis was that patients with ADHD show differences in resting-state connections, specifically in the sensorimotor network, default mode network, attention network, striatum, and cerebellum (Cao et al., 2014). Reduced functional connectivity values in the default mode network have been evidenced in subjects with ASD (Minshew & Keller, 2010). Given the relatively shared pathophysiological nature of these two neurodevelopmental disorders, there is a need to model these states together through multiclass classification.
Based on previous findings, there is both contradictory and supportive evidence regarding neurobiological differences between ASD/ADHD and healthy controls. Briefly, decreased functional connectivity (FC) in ASD was investigated by findings obtained from functional imaging data (resting-state and task-based) (Just et al., 2004; Villalobos et al., 2005; Welchew et al., 2005). These studies have identified decreased connectivity values across nodes of the default mode network (Cherkassky et al., 2006; Di Martino et al., 2014; Kennedy & Courchesne, 2008), social brain (Gotts et al., 2012; von dem Hagen et al., 2013), and attentional networks (Koshino et al., 2005). However, contrary reports have shown either higher or unchanged FC values (Müller et al., 2011), particularly in corticostriatal connections (Di Martino et al., 2011), visual search regions (Keehn et al., 2013), and brain network-level metrics (Anderson et al., 2013; Lynch et al., 2013) in individuals with autism spectrum disorder. The interpretation of this contradiction in the current findings becomes even more complicated when we consider the chronological alterations as well. The frontostriatal circuit, which includes areas such as the dorsolateral prefrontal cortex and dorsal striatum, plays a crucial role in shaping behavioral components and various cognitive abilities (Rubia ert al., 2014). disruptions in the fronto-cerebellar circuit, involving the cerebellum, are frequently observed in ADHD, particularly in the posterior parts of the vermis (Bledsoe et al., 2009). Also, the attentional circuitry of the brain, mainly comprising prefrontal cortices and the dorsal anterior cingulate, is often disrupted in children with ADHD (Bush, 2010).
As indicated by the present results, different connections with the cerebellum could be considered as discriminative features and connectivities. Regarding healthy controls and all the disordered states (ADHD+ASD), the insular-cerebellum connection has been the most correlated one. Cerebellum connections with the angular area and hippocampus were other distinguishing connections, respectively, for autism vs control and ADHD vs typically developed subjects. The cerebellum is composed of cerebellar lobules and the vermis. The precise functioning framework of these divisions is not identified. However, it is suggested that lobules I-V and VIII may process sensorimotor information, while lobules VI and VII play roles in cognition, and lobules IX and X contribute to visual guidance and vestibular organization, respectively (Stoodley & Schmahmann, 2018). Recognized as a node in the attentional network (Mannarelli et al., 2019), the cerebellum’s involvement in neurodevelopmental disorders with attention difficulties is not surprising (Mannarelli et al., 2019; van der Heijden et al., 2021).
A whole-brain, voxel-wise meta-analysis comparing ASD vs healthy control revealed higher activation in the inferior-posterior cerebellum (Hodge et al., 2010). The regions with the most prominent hypoactivation levels were in the default mode network (DMN) and cerebellar crus I. Hodge et al. indicated that the posterior lateral cerebellum was remarkably associated with the frontal parts of the cerebrum, including Broca’s area, contributing to the fronto-cortico-cerebellar language network (Hodge et al., 2010). Autistic participants exhibited cerebrocerebellar hypoconnectivity during a finger-tapping task (Mostofsky et al., 2009). However, significant degrees of hyperactivity in cerebellothalamic circuitry were observed in individuals with ASD during a saccade-based task (Takarae et al., 2008).
In 2003, Hill et al. reported that the group with ADHD diagnosis showed area reduction in cerebellar lobules VIII to X and I to V (Hill et al., 2003). Further studies have exhibited a lower volume of the inferior vermis, which was correlated with inattention, hyperactivity, and impulse control scores. Also, fMRI studies have demonstrated overactivation of the posterior cerebellum coupled with frontal lobe underactivation when performing attention-related tasks (Berquin et al., 1998; Cubillo et al., 2014; Mostofsky et al., 1998; Rubia et al., 2009) and also lower activation in right crus I and left lobule VI during memory processing (Durston, 2003). Moreover, task-negative functional imaging reports showed ADHD-associated disturbances in cerebrocerebellar connectivity (Konrad & Eickhoff, 2010).
We encountered some limitations, there are critical missing data regarding the IQ level; thus, it could not be considered for interpretations. In other words, there were no scores of cognitive states, impeding a complete understanding of neurocognitive conditions, which could be quite crucial. Variations in age distribution are also a significant limitation that could affect the outcomes and interpretations. Longitudinal investigations are recommended to provide a comprehensive assessment, along with age-related considerations. A noticeable limitation of these types of works that also applies to the current research, is the multicenter nature of the acquired data, resulting in differences in imaging facilities and protocols. While this diversity could enhance the generalizability of the results, mild variations in imaging parameters might interfere with the study goals. Accordingly, we attempted to mitigate the influence of these factors through careful preprocessing steps. Moreover, incorporating other categories of neurodevelopmental disorders, such as obsessive-compulsive disorder and some milder forms of intellectual disability might provide a more accurate distinction for these disorders. Additionally, the available diagnosis tools for the subjects of the datasets were not fully explained, so there might be traits of other neurodevelopmental disorders in the “other” category that encompass the structural and functional neural correlates and subsequently affect the classification process and outcomes. Although the aim of this study was to design a supervised classification, performing a parallel clustering method and modeling could reveal more aspects regarding the different categories of disorders and sets of brain connectivities.
5. Conclusion
Neurodevelopmental disorders are a group of neuropsychiatric anomalies that share genetic and endophenotypic correlates. Behavior-based diagnostic approaches are currently used in clinical settings, but the overlapping features among the disorders vague the recognition and management of these disorders. Machine learning approaches based on functional neuroimaging data could provide a computational setting for discriminating between different states of health and disorder. DMDC showed promising results for classification, with the cerebellum and its attributed connections exhibiting acceptable classifying characteristics.
Ethical Considerations
Compliance with ethical guidelines
In this study, publicly accessible datasets were used. This study was approved by the Ethics Committee of Shahid Beheshti University of Medical Sciences (Code: IR.SBMU.PHNS.REC.1402.032).
Funding
The paper was extracted from the PhD dissertation of Zahra Zolghadr, approved by the Department of Biostatistics, School of Allied Medical Sciences, Shahid Beheshti University of Medical Sciences. Also, this research was partially supported by the Deputy for Research and Technology, Shahid Beheshti University of Medical Sciences (Grant No.: 43006024).
Authors' contributions
All authors equally contributed to preparing this article.
Conflict of interest
The authors declared no conflict of interest.
Acknowledgments
The authors would like to express special thanks to Dayche Data Mining Group for equipment and technical support.
References
Autism spectrum disorder (ASD) and attention-deficit/hyperactivity disorder (ADHD) are heterogeneous states with developmental origins and significantly heritable patterns (Thapar & Rutter, 2015). ASD is characterized by age-inappropriate levels of persistent impaired attention and/or hyperactivity and impulsivity, while ADHD encompasses a specific set of disorders characterized by poor social communication/interaction, stereotypical behaviors, and a restricted range of interests (Guha, 2014). These two diagnoses widely affect various dimensions of patients’ lives, may persist into adulthood, and often co-occur (Brookman-Frazee et al., 2018); approximately thirteen percent of participants in an epidemiological study on ADHD were diagnosed with ASD simultaneously (Zablotsky et al., 2020). Other reports have also shown that about 13% of individuals with ADHD receive an ASD diagnosis (Jensen & Steinhausen, 2015). Another study indicated that more than one-fifth of individuals diagnosed with ASD also exhibit ADHD-associated traits; impulsion and inattention are often present in ASD. Regarding heritability, family studies have reported that having relatives with ASD increases the likelihood of receiving an ADHD diagnosis (Ghirardi et al., 2018; Ghirardi et al., 2019; Jokiranta-Olkoniemi et al., 2016; Musser et al., 2014). Although numerous investigations have consistently demonstrated shared genetic components, endophenotypic attributes, and autism-related phenomena in children and adolescents with confirmed ADHD diagnoses and vice versa (Gadow et al., 2006; Simonoff et al., 2008; Yerys et al., 2009), the distinctions in the core psychopathologies of these disorders are well-established (Clark et al., 1999; Grzadzinski et al., 2011; Grzadzinski et al., 2016; Kotte et al., 2013; Kröger et al., 2011; Martin et al., 2014; Mulligan et al., 2009). However, the significant interconnectedness between core behavioral symptoms and certain types of comorbidities (e.g. depression, anxiety, and sleep disturbances) of ADHD and ASD complicates differential diagnosis, prognosis (Grzadzinski et al., 2016), and treatment outcomes; therefore, more clarification of the neuropathophysiological aspects of ADHD, ASD, and ASD+ADHD could be crucial (Craig et al., 2015).
There is limited overlap in neural correlates between individuals with ADHD and those with ASD concerning resting-state connectivity or functional network organizations. Recognizing brain connectivity patterns is a promising approach for the characterization, diagnosis, and prediction of pathologies linked to the abnormal functional or structural organization of the brain. Functional connectivity refers to the temporal correlation of oscillatory activities within the BOLD signal related to distinct nodes of the cerebrum. Recent evidence suggests that connectivity between brain regions significantly contributes to understanding emotional regulation and the hierarchy of cognitive processing. Despite methodological variations, existing research findings (Bethlehem et al., 2017; Di Martino et al., 2013) suggest that ADHD and ASD could be considered large-scale brain connectivity disorders, albeit with insignificant similarities in the specific regions, as confirmed by meta-analyses (Dougherty et al., 2016; Rommelse et al., 2017). The attention-related insufficiencies (sustained attention and attentional shifts) are proposed as frequently observed links between ASD and ADHD. Notably, analyzing functional neuroimaging investigations yields high-dimensional data for a typically small number of subjects, necessitating novel computational approaches.
Classification is a crucial task in statistics and supervised machine learning with numerous applications in various basic and clinical fields (diagnostic and therapeutic), such as image processing. Extensive literature reviews have identified numerous research works on the application of classification methods for discriminating ADHD and Autism based on functional neuroimaging data (Abraham et al., 2017; Itani et al., 2018; Liber et al., 2015; Nielsen et al., 2013). These studies, with varying levels of accuracy, have indicated some specific dimensions of functional neural correlates regarding neurodevelopmental disorders, such as the role of the cerebellum, prefrontal cortices, and temporal lobe contributions to pathogenesis. Some studies have compared both disorders simultaneously but in separate settings without integration (Ghiassian et al., 2016), contrasting ADHD vs Healthy and ASD vs (not ADHD/ASD vs Healthy). The current modeling aims to integrate and compare both disorders with their corresponding healthy states in a unified framework. Specifically, a dataset is represented as an n×d matrix X, consisting of n data vectors xi (i ∈ {1, 2, . . ., n}) with d features and a class label yi ∈{-1, +1}. Two sets (classes) of d-dimensional training vectors are the starting point of the two-class discrimination process. The discrimination procedure aims to design a rationale to attribute the labels of -1 or 1 to the vectors of newly added data (the vectors might be “closer to class +1” or “closer to class −1”) (Zou, 2019).
Support vector machine (SVM) is a widely applied method for classifying structural and functional neuroimaging-derived variables in the clinical setting, as it avoids over-fitting even with a smaller number of samples and delivers high classification accuracy Bledsoe et al., 2020). It also provides individual classification (patient vs control) according to a boundary that is called a decision boundary (i.e. hyperplane) that separates data into two groups. The linear SVM seeks a hyperplane {x:=0} that maximizes all data points’ smallest margin (Cortes & Vapnik, 1995).
Performance degradation is a recurring challenge in conventional machine learning methods, making it a specific concern in statistics when analyzing high-dimension low–sample size (HDLSS) datasets. When working with HDLSS, and specifically during the data projection onto the normal vector of the separating hyperplane, data pilling occurs; which in some HDLSS situations, might influence the SVM performance (Zou, 2019). The data maximum dispersion classifier (DMDC), applicable to general data, especially HDLSS, serves as a novel linear binary classifier. DMDC notably increases data dispersion, thereby inhibiting data pilling. Moreover, it performs well on HDLSS, remains invariant to the intercept term, and involves a straightforward implementation process with minimal computational loads (Shen & Yin, 2020). Another critical aspect is constituting a reasonable interpretation of the ultimate coefficients. The models mentioned earlier and their improved versions could classify the high dimensional observations, but since the standard SVM-based models employ all the variables due to the L2-norm penalty (‖β‖2), providing an appropriate description of the findings and making the results more interpretable requires approaching toward L1-norm regularized method. In these sparse methods, some entries of β are set to zero, facilitating interpretation as only a subset of input features is deemed relevant for the final predictive algorithm. In 2003, Zhu et al. developed and introduced the sparse version of the support vector machine (Zhu et al., 2003), proving beneficial for the neuroscience domain. One recent study, Sen et al. (2018) aimed to identify and classify neuroimaging data using structural and functional connectivity characteristics, exploring a series of three learners. Additionally, Ghiassian et al. proposed a classification method based on MRI-derived histograms of oriented gradients (HOG) features and personal information, describing an algorithm capable of efficacious classification for ASD and ADHD. Their framework achieved 69.6% accuracy in classifying ADHD from controls (over a baseline of 55.0%) (Ghiassian et al., 2016).
Since all existing investigations have applied two-class classification techniques (ADHD/ASD vs healthy controls) that are not entirely able to categorize disorders and decode the ambiguities in neural correlates between ADHD and ASD, we aimed to apply a novel multi-class classification model called DMDC (Shen & Yin, 2020), on publicly available functional neuroimaging datasets of these two disorders and their healthy counterparts. Through the current project, primarily, we extended binary DMDC to a multiclass version for discrimination between more than two classes, and then we developed a two-level classification model based on this multiclass DMDC algorithm. This model could help solve the problem of data pilling and efficient interpretation of the findings. Then we applied a version of the sparse modified SVM model to find the discriminative functional links between different states (ADHD vs ASD, disordered vs healthy conditions).
2. Materials and Methods
Datasets
The entire methodology is depicted in Figure 1. In this research, we analyzed ADHD-200 and ABIDE (autism brain imaging data exchange) datasets that are publicly accessible at NITRC. The data collection procedures adhered to predefined approval criteria, and to ensure confidentiality, the collecting institutions anonymized all participant data before making them publicly accessible. Both datasets included resting-state fMRI and T1-weighted images. The ADHD-200 dataset comprised 939 subjects (357 with ADHD and 582 healthy controls) from North America, Europe, and China, with diagnoses made based on algorithmic criteria. The Autism brain imaging data exchange (ABIDE I) dataset was another included dataset. Currently, this collection also comprises resting-state fMRI and T1-weighted structural MRI scans from 1112 participants (573 healthy controls (HC) and 539 patients with autism diagnosis), acquired from standard institutions in North America and Europe. Diagnostic characteristics are available on the referenced websites. To ensure consistency in diagnostic criteria, we reviewed the criteria of all imaging sites and excluded collections that had not assessed the presence of comorbid ADHD according to standard procedures. This process resulted in 388 individual data (217 healthy controls, 171 ASD) remaining for analysis. Similarly, we applied this criterion to the ADHD-200 dataset and limited the data to two sites (253 healthy controls and 249 ADHD patients). Subsequently, we combined the two datasets (ADHD-200 and ABIDE I) and randomly partitioned this combination into 332, 119, and 171 individual data for training procedures respectively for healthy control, ASD, and ADHD groups. For testing partition, 138, 52, and 78 subjects were assigned to the healthy control, ASD, and ADHD groups, respectively. Ultimately, we allocated 30% of the final data for testing and 70% for the training procedure.
Preprocessing
After downloading both datasets, sequential preprocessing steps were performed using FSL software. In order to remove non-brain tissue parts from the structural images, we randomly selected images of three subjects and applied various sets of parameters to identify the most optimized parameters for each data acquisition center. Then MCflirt and rigid body motion correction methods with six specific parameters were performed. In addition, the process of slice-timing correction was performed based on the specific conditions of imaging procedures mentioned in the data acquisition description of each data center. The fMRI data was also motion-corrected, and the voxel intensity was normalized. The band-pass filter was determined to be within the range of 2.8-60 Hz and registered to the MNI-152. Spatial smoothing was performed using full width with half maximum equal to 6 mm. In order to standardize and automate the data preparation process as much as possible, a bash code system was used that was applied to preprocess steps based on the appropriate parameters for each data center.
Feature extraction
The parcellation part was based on the automated anatomical labeling (AAL 116) atlas (the fMRI volumes were
segmented into 116 regions through masking the ALL). Functional connectivity metric provides an index of the level of co-activation of brain regions based on the time series of rs-fMRI brain imaging data. From the regional time series (nt time-points×np regions), time points were variable among different centers, and np was equal to 116. We computed the pairwise inter-regional covariance matrix for each participant. Since the covariance matrix and its inverse are symmetric, the upper triangular elements of these matrices are considered. By adding variables of individual characteristics and the state of communication of the regions, the structures of the datasets were prepared for classification. Also, due to different scattering of fMRI data and individual characteristics (gender, age, and handedness), the values of quantitative variables were standardized by dividing the deviation of each observation from its mean to the standard deviation.
Parameter tunning
We used a 10-fold cross-validation design for parameter tuning. The training data were divided into 10 folds, such that each fold approximately encompassed one-tenth of the training data in a random way to discover the optimum parameter across eleven considered parameters. Through every iteration process, 9 folds of the data were considered as training and this modeling was performed with every 11 parameters. Subsequently, the BCR (balanced classification rate: The average accuracy across classes) index was calculated within that single fold of test data. Ultimately, the parameter with the highest value in each test fold would be selected for the subsequent step. Overall, the mode of the parameter with maximum BCR was obtained and considered as the optimum parameter. This cross-validation process was then performed for either two-level DMDC or SVM models. Furthermore, the current models exhibited acceptable stability during iterations, with insignificant variations in accuracies (below 5%).
Multiclass DMDC
The computational cost of implementing DMDC is low, as it involves solving the convex quadratic programming formulation similar to SVM (Equation 1):
A is the eigenvector related to the largest eigenvalue of Sβ (Equation 2).
In this equation, uj represents the mean of training samples from the jj-th class, where j=1, 2. The term AT β is utilized to manage the training samples. Following optimization and the formation of f(x), if f(x)>0, the new sample would be classified as belonging to classy=+1, otherwise, it would be classified as belonging to classy=-1 (Shen & Yin, 2020).
As the current output variable (y) encompasses more than two classes and cannot be modeled by binary DMDC, we used a novel methodological framework derived from a one-vs-one strategy. This approach splits the multiclass dataset into one binary classification problem for each pair of classes. By applying our method, any two classes of output variables are defined based on the binary DMDC model; then, we will have
(k(k-1))⁄2 binary classification (k is the number of classes in the target variable space). Consequently, for each observation, there will be an equal number of predicted classes. To determine the classification for an observation, the class with the highest frequency is considered as the final predicted label, employing a majority voting approach. When multiple classes show the same frequency, the observations are allocated to the class with a maximum absolute value of f(x). Through applying this technique, more precise classifications will be achieved. We also compared the classic SVM and the DMDC models to ensure better accuracy representation.
Moreover, we designed a two-level DMDC model. In the first level, using the training data, a binary DMDC model discriminates between two states (in this case, healthy control and disordered conditions). In the second level, observations that the designed model assigned the disorder label undergo classification using a multiclass DMDC. This process categorizes healthy states (non-accurately assigned), ASD, and ADHD categories. Subsequently, this two-level classification process is applied to the test dataset and yields an ultimate predicted label, which is then compared with the actual diagnostic labels to assess classification performance to evaluate this two-level classification process.
Regarding the applied SVM model, we calculated the non-zero coefficients as the discriminative links and connections.
3. Results
We summarized sex, handedness, and age distribution by groups in Table 1.
Comparison of two models (DMDC vs SVM)
Applying the DMDC model to the test data resulted in a total accuracy of 62%. The model achieved accuracies of 51%, 61%, and 84% for the control, autism spectrum disorder, and ADHD groups, respectively. In the SVM model, an accuracy of 46% was obtained for the healthy control and autism spectrum disorder groups, while an 84% accuracy was observed for ADHD. As shown in Table 2, these two models exhibit similar performance parameters in the ADHD group; however, the discrimination power is higher in the ASD group.
In the context of healthy versus disordered states, the total accuracy was 53%. Specifically, within the healthy group, the accuracy was 45%, and within the disordered group, it was 61%. Overall, around twenty-six connectivity paths exhibited non-zero coefficients.
The model differentiated between Autism and control fMRI datasets with a total accuracy of 73%. More specifically, within the control group, the accuracy was 68%, and within the autism spectrum disorder group, it was 87%. Overall, around thirteen connectivity paths exhibited non-zero coefficients (Table 3). In the comparison between ADHD and Control groups, the total accuracy was 76%. Specifically, within the control group, the accuracy was 72%, and within the ADHD group, it was 84%. Overall, approximately thirteen connectivity paths showed non-zero coefficients (Table 3).
The total accuracy was 98%, with a specific accuracy of 98% within the ASD group and 99% within the ADHD group. Overall, approximately thirteen connectivity paths exhibited non-zero coefficients (Table 4).
The recognized patterns based on non-zero coefficients are visualized in Figures 2 and 3, as functional connectivity maps.
4. Discussion
ASD and ADHD are neurodevelopmental abnormalities that frequently occur together with below-threshold cross-disorder manifestations (the existence of symptoms of the other one despite not receiving the diagnostic label) (Syed et al., 2017). Since there are ambiguities in diagnosis and subsequent treatment options, in the current study, we used a novel two-level multi-class DMDC algorithm to classify the functional connectivity values for each state of ADHD, ASD, or healthy participants. The obtained values showed that this model might be an efficient extension of the previous support vector machines and could be applied to other disordered states with more than two or even more classes. The total accuracy was 62%, 51% for healthy control subjects, 61% for ASD, and 84% for ADHD. Functional connections of the cerebellum exhibited discriminative features for the two datasets of ADHD-200 and ABIDE.
The currently available diagnostic attitudes that exclusively rely on behavioral findings could provide differentiation; however, there has been evidence supporting the insufficiencies. The shared properties of genetic composition and intermediate phenotypes might blur the diagnostic procedures that depend on subjective clinical judgments, particularly for children and young adolescents exhibiting overlapping symptoms that do not neatly align with the combined form of disorders (ADHD+ASD). Furthermore, accurately expressing internally perceived symptoms can be challenging. Incorporating objective parameters derived from diagnostic tools alongside diagnosis and prognosis processes can potentially enhance treatment approaches. Structural and functional magnetic resonance imaging leverage brain tissue attributes to non-invasively map structural and functional characteristics’ spatial distribution. Regarding neuromodulation, understanding the precise location of the interventions (either transcranial direct current stimulation or transcranial magnetic stimulation) (Cao et al., 2019; Barreiros et al., 2019) assists in determining the pattern of the stimulation, cognitive changes, and probable side effects. While known functional and structural brain abnormalities exist in ASD and ADHD, they alone cannot fully elucidate the disorders’ fundamental aspects. Given the high-dimensional nature of brain connectivity data, designing a computational framework for precise big data identification is imperative.
Several studies have applied machine learning techniques toward diagnosing neurodevelopmental disorders. Nielsen et al., (2013) obtained 60 % accuracy for classifying ASD and typically developed controls using the ABIDE dataset; Abraham et al., (2017) designed individual FC matrices, achieving 67% classification accuracy. Jin et al. (2015) reached a classification accuracy of 76% using a multi-kernel SVM. Additionally, Libero et al. used multimodal data to perform ASD classification (Libero et al., 2015). More recently, Agastinose Ronicko et al. (2020) examined several classifiers and different input parameters, obtaining 65%-70% accuracy. SVM has also been extensively used in the ADHD classification with different fMRI findings and variables. Dos Santos Siqueira et al. (dos Santos Siqueira et al., 2014) designed a functional brain graph according to the classical temporal correlation between nodes and applied SVM-based classification; the highest achieved accuracy value was 65%. Moreover, Itani et al., (2018) extracted statistical-focused parameters from functional imaging data and demographic information, achieving accuracies of 68.3% and 82.4% for the two applied datasets. Despite numerous investigations for each dataset (ABIDE and ADHD-200), only two studies have combined these datasets in one paper. The following studies have approached the discrimination framework but toward a two-class classification (ADHD vs healthy controls and ASD vs healthy controls). The currently presented model has integrated the classes of ADHD, ASD, and healthy controls to compare the functional neural correlates in a more comprehensive manner (achieving a total accuracy of 62% and 51% for healthy controls, 61% for ASD, and 84% for ADHD). Compared to the DMDC, the SVM model provided accuracies of 46% for the healthy control group, 46% for ASD, and 84% for ADHD. As far as we know, t similar merger work has not been previously conducted; however, two modeling-based assessments have yielded acceptable accuracies for ADHD vs healthy controls and ASD vs healthy controls. Sen et al. in their 2018 investigation used structural texture and functional connectivity features obtained from anatomical images and functional scans. They achieved an accuracy of 67.3% on the ADHD-200 data and 64.3% on the ABIDE data. Their modeling algorithm identified key components for ADHD, including nodes of the default mode network, peristriate area, lateral and superior occipital gyrus, frontal and occipital lobe, pons, and temporal lobe. Regarding the ABIDE database, they found remarkable discriminative components comprising the visual areas, with relative similarities to some default mode network-associated areas and motor networks (Sen et al., 2018). Similarly, by applying structural imaging parameters and demographic data, Ghiasian et al. (2016) achieved 69.6% accuracy. They provided an accuracy of 65.0% on a holdout set that was better than that of Nielsen et al., (2013). The image features used by their classifiers encompassed the cortical/subcortical and cerebellar regions. The proposed hypothesis was that patients with ADHD show differences in resting-state connections, specifically in the sensorimotor network, default mode network, attention network, striatum, and cerebellum (Cao et al., 2014). Reduced functional connectivity values in the default mode network have been evidenced in subjects with ASD (Minshew & Keller, 2010). Given the relatively shared pathophysiological nature of these two neurodevelopmental disorders, there is a need to model these states together through multiclass classification.
Based on previous findings, there is both contradictory and supportive evidence regarding neurobiological differences between ASD/ADHD and healthy controls. Briefly, decreased functional connectivity (FC) in ASD was investigated by findings obtained from functional imaging data (resting-state and task-based) (Just et al., 2004; Villalobos et al., 2005; Welchew et al., 2005). These studies have identified decreased connectivity values across nodes of the default mode network (Cherkassky et al., 2006; Di Martino et al., 2014; Kennedy & Courchesne, 2008), social brain (Gotts et al., 2012; von dem Hagen et al., 2013), and attentional networks (Koshino et al., 2005). However, contrary reports have shown either higher or unchanged FC values (Müller et al., 2011), particularly in corticostriatal connections (Di Martino et al., 2011), visual search regions (Keehn et al., 2013), and brain network-level metrics (Anderson et al., 2013; Lynch et al., 2013) in individuals with autism spectrum disorder. The interpretation of this contradiction in the current findings becomes even more complicated when we consider the chronological alterations as well. The frontostriatal circuit, which includes areas such as the dorsolateral prefrontal cortex and dorsal striatum, plays a crucial role in shaping behavioral components and various cognitive abilities (Rubia ert al., 2014). disruptions in the fronto-cerebellar circuit, involving the cerebellum, are frequently observed in ADHD, particularly in the posterior parts of the vermis (Bledsoe et al., 2009). Also, the attentional circuitry of the brain, mainly comprising prefrontal cortices and the dorsal anterior cingulate, is often disrupted in children with ADHD (Bush, 2010).
As indicated by the present results, different connections with the cerebellum could be considered as discriminative features and connectivities. Regarding healthy controls and all the disordered states (ADHD+ASD), the insular-cerebellum connection has been the most correlated one. Cerebellum connections with the angular area and hippocampus were other distinguishing connections, respectively, for autism vs control and ADHD vs typically developed subjects. The cerebellum is composed of cerebellar lobules and the vermis. The precise functioning framework of these divisions is not identified. However, it is suggested that lobules I-V and VIII may process sensorimotor information, while lobules VI and VII play roles in cognition, and lobules IX and X contribute to visual guidance and vestibular organization, respectively (Stoodley & Schmahmann, 2018). Recognized as a node in the attentional network (Mannarelli et al., 2019), the cerebellum’s involvement in neurodevelopmental disorders with attention difficulties is not surprising (Mannarelli et al., 2019; van der Heijden et al., 2021).
A whole-brain, voxel-wise meta-analysis comparing ASD vs healthy control revealed higher activation in the inferior-posterior cerebellum (Hodge et al., 2010). The regions with the most prominent hypoactivation levels were in the default mode network (DMN) and cerebellar crus I. Hodge et al. indicated that the posterior lateral cerebellum was remarkably associated with the frontal parts of the cerebrum, including Broca’s area, contributing to the fronto-cortico-cerebellar language network (Hodge et al., 2010). Autistic participants exhibited cerebrocerebellar hypoconnectivity during a finger-tapping task (Mostofsky et al., 2009). However, significant degrees of hyperactivity in cerebellothalamic circuitry were observed in individuals with ASD during a saccade-based task (Takarae et al., 2008).
In 2003, Hill et al. reported that the group with ADHD diagnosis showed area reduction in cerebellar lobules VIII to X and I to V (Hill et al., 2003). Further studies have exhibited a lower volume of the inferior vermis, which was correlated with inattention, hyperactivity, and impulse control scores. Also, fMRI studies have demonstrated overactivation of the posterior cerebellum coupled with frontal lobe underactivation when performing attention-related tasks (Berquin et al., 1998; Cubillo et al., 2014; Mostofsky et al., 1998; Rubia et al., 2009) and also lower activation in right crus I and left lobule VI during memory processing (Durston, 2003). Moreover, task-negative functional imaging reports showed ADHD-associated disturbances in cerebrocerebellar connectivity (Konrad & Eickhoff, 2010).
We encountered some limitations, there are critical missing data regarding the IQ level; thus, it could not be considered for interpretations. In other words, there were no scores of cognitive states, impeding a complete understanding of neurocognitive conditions, which could be quite crucial. Variations in age distribution are also a significant limitation that could affect the outcomes and interpretations. Longitudinal investigations are recommended to provide a comprehensive assessment, along with age-related considerations. A noticeable limitation of these types of works that also applies to the current research, is the multicenter nature of the acquired data, resulting in differences in imaging facilities and protocols. While this diversity could enhance the generalizability of the results, mild variations in imaging parameters might interfere with the study goals. Accordingly, we attempted to mitigate the influence of these factors through careful preprocessing steps. Moreover, incorporating other categories of neurodevelopmental disorders, such as obsessive-compulsive disorder and some milder forms of intellectual disability might provide a more accurate distinction for these disorders. Additionally, the available diagnosis tools for the subjects of the datasets were not fully explained, so there might be traits of other neurodevelopmental disorders in the “other” category that encompass the structural and functional neural correlates and subsequently affect the classification process and outcomes. Although the aim of this study was to design a supervised classification, performing a parallel clustering method and modeling could reveal more aspects regarding the different categories of disorders and sets of brain connectivities.
5. Conclusion
Neurodevelopmental disorders are a group of neuropsychiatric anomalies that share genetic and endophenotypic correlates. Behavior-based diagnostic approaches are currently used in clinical settings, but the overlapping features among the disorders vague the recognition and management of these disorders. Machine learning approaches based on functional neuroimaging data could provide a computational setting for discriminating between different states of health and disorder. DMDC showed promising results for classification, with the cerebellum and its attributed connections exhibiting acceptable classifying characteristics.
Ethical Considerations
Compliance with ethical guidelines
In this study, publicly accessible datasets were used. This study was approved by the Ethics Committee of Shahid Beheshti University of Medical Sciences (Code: IR.SBMU.PHNS.REC.1402.032).
Funding
The paper was extracted from the PhD dissertation of Zahra Zolghadr, approved by the Department of Biostatistics, School of Allied Medical Sciences, Shahid Beheshti University of Medical Sciences. Also, this research was partially supported by the Deputy for Research and Technology, Shahid Beheshti University of Medical Sciences (Grant No.: 43006024).
Authors' contributions
All authors equally contributed to preparing this article.
Conflict of interest
The authors declared no conflict of interest.
Acknowledgments
The authors would like to express special thanks to Dayche Data Mining Group for equipment and technical support.
References
Abraham, A., Milham, M. P., Di Martino, A., Craddock, R. C., Samaras, D., & Thirion, B., et al. (2017). Deriving reproducible biomarkers from multi-site resting-state data: An Autism-based example. NeuroImage, 147, 736-745. [DOI:10.1016/j.neuroimage.2016.10.045] [PMID]
Agastinose Ronicko, J. F., Thomas, J., Thangavel, P., Koneru, V., Langs, G., & Dauwels, J. (2020). Diagnostic classification of autism using resting-state fMRI data improves with full correlation functional brain connectivity compared to partial correlation. Journal of Neuroscience Methods, 345, 108884. [DOI:10.1016/j.jneumeth.2020.108884] [PMID]
American Psychiatric Association. (2014). Diagnostic and statistical manual of mental disorders: DSM-5. Washington:American Psychiatric Association. [Link]
Anderson, J. S., Nielsen, J. A., Ferguson, M. A., Burback, M. C., Cox, E. T., & Dai, L., et al. (2013). Abnormal brain synchrony in Down syndrome. NeuroImage. Clinical, 2, 703–715.[DOI:10.1016/j.nicl.2013.05.006] [PMID] [PMCID]
Barreiros, A. R., Almeida, I., Baía, B. C., & Castelo-Branco, M. (2019). Amygdala modulation during emotion regulation training with fmri-based neurofeedback. Frontiers in Human Neuroscience, 13, 89. [DOI:10.3389/fnhum.2019.00089] [PMID] [PMCID]
Berquin, P. C., Giedd, J. N., Jacobsen, L. K., Hamburger, S. D., Krain, A. L., & Rapoport, J. L., et al. (1998). Cerebellum in attention-deficit hyperactivity disorder: A morphometric MRI study. Neurology, 50(4), 1087-1093. [DOI:10.1212/WNL.50.4.1087] [PMID]
Bethlehem, R. A. I., Romero-Garcia, R., Mak, E., Bullmore, E. T., & Baron-Cohen, S. (2017). Structural covariance networks in children with Autism or ADHD. Cerebral Cortex, 27(8), 4267-4276. [DOI:10.1093/cercor/bhx135] [PMID] [PMCID]
Bledsoe, J., Semrud-Clikeman, M., & Pliszka, S. R. (2009). A magnetic resonance imaging study of the cerebellar vermis in chronically treated and treatment-naive children with attention-deficit/hyperactivity disorder combined type. Biological Psychiatry, 65(7), 620-624. [DOI:10.1016/j.biopsych.2008.11.030] [PMID] [PMCID]
Bledsoe, J. C., Xiao, C., Chaovalitwongse, A., Mehta, S., Grabowski, T. J., & Semrud-Clikeman, M., et al. (2020). Diagnostic classification of ADHD versus control: Support vector machine classification using brief neuropsychological assessment. Journal of Attention Disorders, 24(11), 1547-1556. [DOI:10.1177/1087054716649666] [PMID]
Brookman-Frazee, L., Stadnick, N., Chlebowski, C., Baker-Ericzén, M., & Ganger, W. (2018). Characterizing psychiatric comorbidity in children with autism spectrum disorder receiving publicly funded mental health services. Autism, 22(8), 938-952. [DOI:10.1177/1362361317712650] [PMID] [PMCID]
Bush, G. (2010). Attention-deficit/hyperactivity disorder and attention networks. Neuropsychopharmacology, 35(1), 278-300. [DOI:10.1038/npp.2009.120] [PMID] [PMCID]
Cao, M., Shu, N., Cao, Q., Wang, Y., & He, Y. (2014). Imaging functional and structural brain connectomics in attention-deficit/hyperactivity disorder. Molecular Neurobiology, 50(3), 1111-1123. [DOI:10.1007/s12035-014-8685-x] [PMID]
Cao, P., Wang, L., Cheng, Q., Sun, X., Kang, Q., & Dai, L., et al. (2019). Changes in serum miRNA-let-7 level in children with attention deficit hyperactivity disorder treated by repetitive transcranial magnetic stimulation or atomoxetine: An exploratory trial. Psychiatry Research, 274, 189-194. [DOI:10.1016/j.psychres.2019.02.037] [PMID]
Cherkassky, V. L., Kana, R. K., Keller, T. A., & Just, M. A. (2006). Functional connectivity in a baseline resting-state network in Autism. Neuroreport, 17(16), 1687-1690. [DOI:10.1097/01.wnr.0000239956.45448.4c] [PMID]
Clark, T., Feehan, C., Tinline, C., & Vostanis, P. (1999). Autistic symptoms in children with attention deficit-hyperactivity disorder. European Child & Adolescent Psychiatry, 8(1), 50-55. [DOI:10.1007/s007870050083] [PMID]
Craig, F., Lamanna, A. L., Margari, F., Matera, E., Simone, M., & Margari, L. (2015). Overlap between Autism spectrum disorders and attention deficit hyperactivity disorder: Searching for distinctive/common clinical features. Autism Research, 8(3), 328-337. [DOI:10.1002/aur.1449] [PMID] [PMCID]
Cubillo, A., Smith, A. B., Barrett, N., Giampietro, V., Brammer, M. J., & Simmons, A., et al. (2014). Shared and drug-specific effects of atomoxetine and methylphenidate on inhibitory brain dysfunction in medication-naive ADHD boys. Cereb Cortex, 24(1), 174-185. [DOI:10.1093/cercor/bhs296] [PMID] [PMCID]
Di Martino, A., Kelly, C., Grzadzinski, R., Zuo, X. N., Mennes, M., & Mairena, M. A., et al. (2011). Aberrant striatal functional connectivity in children with Autism. Biological Psychiatry, 69(9), 847-856. [PMID]
Di Martino, A., Yan, C. G., Li, Q., Denio, E., Castellanos, F. X., & Alaerts, K., et al. (2014). The autism brain imaging data exchange: towards a large-scale evaluation of the intrinsic brain architecture in autism. Molecular Psychiatry, 19(6), 659-667. [DOI:10.1038/mp.2013.78] [PMID] [PMCID]
Di Martino, A., Zuo, X. N., Kelly, C., Grzadzinski, R., Mennes, M., & Schvarcz, A., et al. (2013). Shared and distinct intrinsic functional network centrality in autism and attention-deficit/hyperactivity disorder. Biological Psychiatry, 74(8), 623-632. [PMID] [PMCID]
dos Santos Siqueira, A., Biazoli Junior, C. E., Comfort, W. E., Rohde, L. A., & Sato, J. R. (2014). Abnormal functional resting-state networks in ADHD: Graph theory and pattern recognition analysis of fMRI data. BioMed Research International, 2014, 380531. [DOI:10.1155/2014/380531] [PMID] [PMCID]
Dougherty, C. C., Evans, D. W., Myers, S. M., Moore, G. J., & Michael, A. M. (2016). A comparison of structural brain imaging findings in autism spectrum disorder and attention-deficit hyperactivity disorder. Neuropsychology Review, 26(1), 25-43. [DOI:10.1007/s11065-015-9300-2] [PMID]
Durston, S. (2003). A review of the biological bases of ADHD: What have we learned from imaging studies? Mental Retardation and Developmental Disabilities Research Reviews, 9(3), 184–195. [DOI:10.1002/mrdd.10079] [PMID]
Gadow, K. D., DeVincent, C. J., & Pomeroy, J. (2006). ADHD symptom subtypes in children with pervasive developmental disorder. Journal of Autism and Developmental Disorders, 36(2), 271-283. [DOI:10.1007/s10803-005-0060-3] [PMID]
Ghiassian, S., Greiner, R., Jin, P., & Brown, M. R. (2016). Using functional or structural magnetic resonance images and personal characteristic data to identify ADHD and Autism. Plos One, 11(12), e0166934. [DOI:10.1371/journal.pone.0166934] [PMID] [PMCID]
Ghirardi, L., Brikell, I., Kuja-Halkola, R., Freitag, C. M., Franke, B., & Asherson, P., et al. (2018). The familial co-aggregation of ASD and ADHD: A register-based cohort study. Molecular Psychiatry, 23(2), 257–262. [DOI:10.1038/mp.2017.17] [PMID] [PMCID]
Ghirardi, L., Pettersson, E., Taylor, M. J., Freitag, C. M., Franke, B., & Asherson, P., et al. (2019). Genetic and environmental contribution to the overlap between ADHD and ASD trait dimensions in young adults: A twin study. Psychological Medicine, 49(10), 1713-1721. [DOI:10.1017/S003329171800243X] [PMID] [PMCID]
Gotts, S. J., Simmons, W. K., Milbury, L. A., Wallace, G. L., Cox, R. W., & Martin, A. (2012). Fractionation of social brain circuits in autism spectrum disorders. Brain, 135(9), 2711-2725. [DOI:10.1093/brain/aws160] [PMID] [PMCID]
Grzadzinski, R., Di Martino, A., Brady, E., Mairena, M. A., O'Neale, M.,& Petkova, E., et al. (2011). Examining autistic traits in children with ADHD: Does the autism spectrum extend to ADHD? Journal of Autism and Developmental Disorders, 41(9), 1178-1191. [DOI:10.1007/s10803-010-1135-3] [PMID] [PMCID]
Grzadzinski, R., Dick, C., Lord, C., & Bishop, S. (2016). Parent-reported and clinician-observed autism spectrum disorder (ASD) symptoms in children with attention deficit/hyperactivity disorder (ADHD): Implications for practice under DSM-5. Molecular Autism, 7, 7. [DOI:10.1186/s13229-016-0072-1] [PMID] [PMCID]
Hill, D. E., Yeo, R. A., Campbell, R. A., Hart, B., Vigil, J., & Brooks, W. (2003). Magnetic resonance imaging correlates of attention-deficit/hyperactivity disorder in children. Neuropsychology, 17(3), 496-506. [Link]
Hodge, S. M., Makris, N., Kennedy, D. N., Caviness, V. S., Jr, & Howard, J., et al. (2010). Cerebellum, language, and cognition in autism and specific language impairment. Journal of Autism and Developmental Disorders, 40(3), 300-316. [DOI:10.1007/s10803-009-0872-7] [PMID] [PMCID]
Itani, S., Lecron, F., & Fortemps, P. (2018). A multi-level classification framework for multi-site medical data: Application to the ADHD-200 collection. Expert Systems with Applications, 91, 36-45. [DOI:10.1016/j.eswa.2017.08.044]
Jensen, C. M., & Steinhausen, H. C. (2015). Comorbid mental disorders in children and adolescents with attention-deficit/hyperactivity disorder in a large nationwide study. Attention Deficit and Hyperactivity Disorders, 7(1), 27–38. [DOI:10.1007/s12402-014-0142-1] [PMID]
Jin, Y., Wee, C. Y., Shi, F., Thung, K. H., Ni, D., & Yap, P. T., et al. (2015). Identification of infants at high-risk for autism spectrum disorder using multiparameter multiscale white matter connectivity networks. Human Brain Mapping, 36(12), 4880-4896. [DOI:10.1002/hbm.22957] [PMID] [PMCID]
Jokiranta-Olkoniemi, E., Cheslack-Postava, K., Sucksdorff, D., Suominen, A., Gyllenberg, D., & Chudal, R., et al. (2016). Risk of psychiatric and neurodevelopmental disorders among siblings of probands with autism spectrum disorders. JAMA Psychiatry, 73(6), 622–629. [DOI:10.1001/jamapsychiatry.2016.0495] [PMID]
Just, M. A., Cherkassky, V. L., Keller, T. A., & Minshew, N. J. (2004). Cortical activation and synchronization during sentence comprehension in high-functioning autism: Evidence of underconnectivity. Brain, 127(8), 1811-1821. [DOI:10.1093/brain/awh199] [PMID]
Keehn, B., Shih, P., Brenner, L. A., Townsend, J., & Müller, R. A. (2013). Functional connectivity for an “island of sparing” in autism spectrum disorder: An fMRI study of visual search. Human Brain Mapping, 34(10), 2524-2537. [DOI:10.1002/hbm.22084] [PMID] [PMCID]
Kennedy, D. P., & Courchesne, E. (2008). The intrinsic functional organization of the brain is altered in Autism. NeuroImage, 39(4), 1877-1885. [DOI:10.1016/j.neuroimage.2007.10.052] [PMID]
Konrad, K., & Eickhoff, S. B. (2010). Is the ADHD brain wired differently? A review on structural and functional connectivity in attention deficit hyperactivity disorder. Hum Brain Mapp, 31(6), 904-916. [DOI:10.1002/hbm.21058] [PMID] [PMCID]
Koshino, H., Carpenter, P. A., Minshew, N. J., Cherkassky, V. L., Keller, T. A., & Just, M. A. (2005). Functional connectivity in an fMRI working memory task in high-functioning autism. NeuroImage, 24(3), 810-821. [DOI:10.1016/j.neuroimage.2004.09.028] [PMID]
Kotte, A., Joshi, G., Fried, R., Uchida, M., Spencer, A., & Woodworth, K. Y., et al. (2013). Autistic traits in children with and without ADHD. Pediatrics, 132(3), e612-e622. [DOI:10.1542/peds.2012-3947] [PMID] [PMCID]
Kröger, A., Hänig, S., Seitz, C., Palmason, H., Meyer, J., & Freitag, C. M. (2011). Risk factors of autistic symptoms in children with ADHD. European Child & Adolescent Psychiatry, 20(11), 561-570. [DOI:10.1007/s00787-011-0221-1] [PMID]
Libero, L. E., DeRamus, T. P., Lahti, A. C., Deshpande, G., & Kana, R. K. (2015). Multimodal neuroimaging based classification of autism spectrum disorder using anatomical, neurochemical, and white matter correlates. Cortex, 66, 46-59. [DOI:10.1016/j.cortex.2015.02.008] [PMID] [PMCID]
Lynch, C. J., Uddin, L. Q., Supekar, K., Khouzam, A., Phillips, J., & Menon, V. (2013). Default mode network in childhood autism: posteromedial cortex heterogeneity and relationship with social deficits. Biological Psychiatry, 74(3), 212–219.[DOI:10.1016/j.biopsych.2012.12.013] [PMID] [PMCID]
Mannarelli, D., Pauletti, C., Currà, A., Marinelli, L., Corrado, A., & Delle Chiaie, R., et al. (2019). The cerebellum modulates attention network functioning: Evidence from a cerebellar transcranial direct current stimulation and attention network test study. Cerebellum, 18(3), 457-468. [DOI:10.1007/s12311-019-01014-8] [PMID]
Martin, J., Hamshere, M. L., O'Donovan, M. C., Rutter, M., & Thapar, A. (2014). Factor structure of autistic traits in children with ADHD. Journal of Autism and Developmental Disorders, 44(1), 204-215. [DOI:10.1007/s10803-013-1865-0] [PMID] [PMCID]
Minshew, N. J., & Keller, T. A. (2010). The nature of brain dysfunction in autism: Functional brain imaging studies. Current Opinion in Neurology, 23(2), 124-130. [DOI:10.1097/WCO.0b013e32833782d4] [PMID] [PMCID]
Mostofsky, S. H., Powell, S. K., Simmonds, D. J., Goldberg, M. C., Caffo, B., & Pekar, J. J. (2009). Decreased connectivity and cerebellar activity in autism during motor task performance. Brain, 132(9), 2413-2425. [DOI:10.1093/brain/awp088] [PMID] [PMCID]
Mostofsky, S. H., Reiss, A. L., Lockhart, P., & Denckla, M. B. (1998). Evaluation of cerebellar size in attention-deficit hyperactivity disorder. Journal of Child Neurology, 13(9), 434-439. [DOI:10.1177/088307389801300904] [PMID]
Müller, R. A., Shih, P., Keehn, B., Deyoe, J. R., Leyden, K. M., & Shukla, D. K. (2011). Underconnected, but how? A survey of functional connectivity MRI studies in autism spectrum disorders. Cerebral Cortex, 21(10), 2233-2243. [DOI:10.1093/cercor/bhq296] [PMID] [PMCID]
Mulligan, A., Anney, R. J., O'Regan, M., Chen, W., Butler, L., & Fitzgerald, M., et al. (2009). Autism symptoms in attention-deficit/hyperactivity disorder: A familial trait which correlates with conduct, oppositional defiant, language and motor disorders. Journal of Autism and Developmental Disorders, 39(2), 197-209. [DOI:10.1007/s10803-008-0621-3] [PMID]
Musser, E. D., Hawkey, E., Kachan-Liu, S. S., Lees, P., Roullet, J. B., & Goddard, K., et al. (2014). Shared familial transmission of autism spectrum and attention/deficit/hyperactivity disorders. Journal of Child Psychology and Psychiatry, and Allied Disciplines, 55(7), 819–827. [DOI:10.1111/jcpp.12201] [PMID] [PMCID]
Nielsen, J. A., Zielinski, B. A., Fletcher, P. T., Alexander, A. L., Lange, N., & Bigler, E. D., et al. (2013). Multisite functional connectivity MRI classification of autism: ABIDE results. Frontiers in Human Neuroscience, 7, 599. [DOI:10.3389/fnhum.2013.00599] [PMID] [PMCID]
Rommelse, N., Buitelaar, J. K., & Hartman, C. A. (2017). Structural brain imaging correlates of ASD and ADHD across the lifespan: A hypothesis-generating review on developmental ASD-ADHD subtypes. Journal of Neural Transmission, 124(2), 259-271. [DOI:10.1007/s00702-016-1651-1] [PMID] [PMCID]
Rubia, K., Alegría, A. A., & Brinson, H. (2014). Brain abnormalities in attention-deficit hyperactivity disorder: A review. Revista de Neurologia, 58 (Suppl 1), S3–S16. [PMID]
Rubia, K., Halari, R., Christakou, A., & Taylor, E. (2009). Impulsiveness as a timing disturbance: Neurocognitive abnormalities in attention-deficit hyperactivity disorder during temporal processes and normalization with methylphenidate. Philosophical Transactions of the Royal Society B: Biological Sciences, 364(1525), 1919-1931. [DOI:10.1098/rstb.2009.0014] [PMID] [PMCID]
Sen, B., Borle, N. C., Greiner, R., & Brown, M. R. G. (2018). A general prediction model for the detection of ADHD and Autism using structural and functional MRI. PloS One, 13(4), e0194856. [DOI:10.1371/journal.pone.0194856] [PMID] [PMCID]
Shen, L., & Yin, Q. (2020). Data maximum dispersion classifier in projection space for high-dimension low-sample-size problems. Knowledge-Based Systems, 193, 105420. [DOI:10.1016/j.knosys.2019.105420]
Simonoff, E., Pickles, A., Charman, T., Chandler, S., Loucas, T., & Baird, G. (2008). Psychiatric disorders in children with autism spectrum disorders: Prevalence, comorbidity, and associated factors in a population-derived sample. Journal of the American Academy of Child & Adolescent Psychiatry, 47(8), 921-929. [DOI:10.1097/CHI.0b013e318179964f] [PMID]
Stoodley, C. J., & Schmahmann, J. D. (2018). Functional topography of the human cerebellum. Handbook of Clinical Neurology, 154, 59-70. [DOI:10.1016/B978-0-444-63956-1.00004-7] [PMID]
Syed, M. A., Yang, Z., Hu, X. P., & Deshpande, G. (2017). Investigating brain connectomic alterations in autism using the reproducibility of independent components derived from resting state functional MRI data. Frontiers in Neuroscience, 11, 459. [DOI:10.3389/fnins.2017.00459] [PMID] [PMCID]
Takarae, Y., Luna, B., Minshew, N. J., & Sweeney, J. A. (2008). Patterns of visual sensory and sensorimotor abnormalities in autism vary in relation to history of early language delay. Journal of the International Neuropsychological Society, 14(6), 980-989. [DOI:10.1017/S1355617708081277] [PMID] [PMCID]
Thapar, A., & Rutter, M. (2015). Neurodevelopmental disorders. In: A. Thapar, D. Pine, K. F. Leckman, S. Scott, M. J. Snowling, & E. Taylor (Eds.), Rutter’s child and adolescent psychiatry (pp. 31-40). New Jersey: John Wiley & Sons, Ltd. [DOI:10.1002/9781118381953.ch3]
van der Heijden, M. E., Gill, J. S., & Sillitoe, R. V. (2021). Abnormal cerebellar development in autism spectrum disorders. Developmental Neuroscience, 43(3-4), 181-190. [DOI:10.1159/000515189] [PMID] [PMCID]
Villalobos, M. E., Mizuno, A., Dahl, B. C., Kemmotsu, N., & Müller, R. A. (2005). Reduced functional connectivity between V1 and inferior frontal cortex associated with visuomotor performance in autism. NeuroImage, 25(3), 916-925. [DOI:10.1016/j.neuroimage.2004.12.022] [PMID] [PMCID]
von dem Hagen, E. A., Stoyanova, R. S., Baron-Cohen, S., & Calder, A. J. (2013). Reduced functional connectivity within and between ‘social’resting state networks in autism spectrum conditions. Social Cognitive and Affective Neuroscience, 8(6), 694-701. [DOI:10.1093/scan/nss053] [PMID] [PMCID]
Welchew, D. E., Ashwin, C., Berkouk, K., Salvador, R., Suckling, J., & Baron-Cohen, S., et al. (2005). Functional disconnectivity of the medial temporal lobe in Asperger’s syndrome. Biological Psychiatry, 57(9), 991-998. [DOI:10.1016/j.biopsych.2005.01.028] [PMID]
Yerys, B. E., Wallace, G. L., Sokoloff, J. L., Shook, D. A., James, J. D., & Kenworthy, L. (2009). Attention deficit/hyperactivity disorder symptoms moderate cognition and behavior in children with autism spectrum disorders. Autism Research, 2(6), 322-333. [DOI:10.1002/aur.103] [PMID] [PMCID]
Zablotsky, B., Bramlett, M. D., & Blumberg, S. J. (2020). The co-occurrence of autism spectrum disorder in children with ADHD. Journal of Attention Disorders, 24(1), 94-103. [DOI:10.1177/1087054717713638] [PMID] [PMCID]
Type of Study: Original |
Subject:
Computational Neuroscience
Received: 2022/06/11 | Accepted: 2023/01/16 | Published: 2024/05/1
Received: 2022/06/11 | Accepted: 2023/01/16 | Published: 2024/05/1
Send email to the article author
| Rights and permissions | |
 |
This work is licensed under a Creative Commons Attribution-NonCommercial 4.0 International License. |
![]()
Copyright © The Author(s);
This is an open access article distributed under the terms of the Creative Commons Attribution License (CC-By-NC), which permits use, distribution, and reproduction in any medium, provided the original work is properly cited and is not used for commercial purposes.
Contact Information
