

Volume 14, Issue 5 (September & October 2023)
BCN 2023, 14(5): 713-726 |
Back to browse issues page


Download citation:
BibTeX | RIS | EndNote | Medlars | ProCite | Reference Manager | RefWorks
Send citation to:


BibTeX | RIS | EndNote | Medlars | ProCite | Reference Manager | RefWorks
Send citation to:
Fathi Khorasani D, Rastgou Moghadam M, Saebipour M R, Ghoshuni M. Quantitative Comparison of Brain Waves of Dyslexic Students With Perceptual and Linguistic Types With Normal Students in Reading. BCN 2023; 14 (5) :713-726
URL: http://bcn.iums.ac.ir/article-1-2034-en.html
URL: http://bcn.iums.ac.ir/article-1-2034-en.html


1- Department of Psychology, Faculty of Educational Sciences and Psychology Birjand University, Birjand, Iran.
2- Department of Anatomical Sciences, School of Medicine, Birjand University of Medical Sciences, Birjand, Iran.
3- Department of Biomedical Engineering, Mashhad Branch, Islamic Azad University, Mashhad, Iran.
2- Department of Anatomical Sciences, School of Medicine, Birjand University of Medical Sciences, Birjand, Iran.
3- Department of Biomedical Engineering, Mashhad Branch, Islamic Azad University, Mashhad, Iran.
Keywords: Baker imbalance model, Perceptual type dyslexia, Linguistic type dyslexia, Quantitative electroencephalography
Full-Text [PDF 1499 kb]
| Abstract (HTML)
Full-Text:
1. Introduction
Reading is a complex cognitive skill that serves a wide range of language and vision-related areas. Disruption of communication in this network is associated with evolutionary dyslexia (Hallahan, et al., 2005). Dyslexia is a term used mainly by neurologists; but teachers call it reading problems (Walker & Norman, 2006). There are several definitions of dyslexia; according to the definition of the fifth diagnostic and statistical classification (Association, 2013), dyslexia is a pattern of learning disorder characterized by poor speech recognition, poor coding, and poor spelling, which is not due to sensory impairment, low intelligence, or inadequate educational experience. Dyslexia occurs in all groups of children regardless of gender, social group, mental level, and geographical area (Schlaggar & McCandliss, 2007). Papagiannopoulou and Lagopoulos (2016) believed that dyslexia is a neurodevelopmental disorder with an unknown cause that affects 4-7% of the population.
“Causation” is one of the most important challenges in the field of learning disabilities. Over the past three decades, the neurological approach has taken more seriously the weaknesses of children with dyslexia. According to this approach, the occurrence of this disorder is due to the malfunctions of the nervous system, especially the central nervous system (Temple, 2002).
Due to recent advances in imaging (magnetic resonance imaging, positron emission neurosurgery, functional magnetic resonance imaging, and regional blood flow) as well as neurophysiology (recall potentials, quantitative electroencephalogram (QEEG), coherence studies, and magnetic resonance imaging), today, researchers are able to look at the normal circuits involved in reading and the differences between people who have difficulty learning to read (Abdeldayem & Selim, 2005). The results of several studies on dyslexics (Casanova, et al., 2004; Meyler et al., 2007; Shaywitz et al., 2004) have shown that these individuals have poor performance in the temporomandibular region. There is a positive linear relationship between reading ability and brain activity in the left temporal lobes and lower parietal areas in the right lobe, which means that the activity of these areas also increases following the ability to read. On the other hand, other studies (Ferrer, et al., 2010; Shaywitz et al., 2002) have shown that children with dyslexia have problems with their nervous systems; it is associated with dysfunction in the anterior cerebral cortex, parietal temporal lobes, and posterior parietal cortex. Also, the dysfunction of the left temporal lobe of the left temporal forehead was associated with impaired phonological awareness, speech perception, and direct access to speech (Vandermosten, Boets, et al., 2012). Based on evidence (Galaburda, Sherman, et al., 1985; Plante, et al, 1996; Rumsey, et al., 1994) on functional imaging in the field of reading development, defects in specific areas of the brain, such as planimetric symmetry or poor functional angular torture, are associated with dyslexia. Based on neurological studies (Lyon, et al., 2003; Meyler et al., 2007; Shaywitz & Shaywitz, 2007; Spironelli, et al., 2008) forehead areas, parietal forehead, temporal forehead, cortex hippocampus and right hemisphere thalamus, left angular gyrus, and left temporal lobe are some of the areas that have dysfunction in dyslexic people.
One of the tools for measuring the level of brain activity is the recording of brain waves by an electroencephalographic device invented to examine the function of the brain (not the structure of the banana). So far, several studies have been done to identify the pattern of brain waves in dyslexic people. Scarlar et al. (1995, Cited in Abdeldayem & Selim, 2005) found that the EEG activity of dyslexic individuals had a significant difference in the higher power of tetanus band activity in dyslexics. Arns et al. (Arns, et al., 2007) also confirmed this result. The results showed that in the dyslexic group, more slow wave activity (delta and theta) was observed in temporal and cerebral regions of the brain and beta 1 activity increased, especially in the F7 region., Coherence (EEG correlation) in the anterior, central, and temporal regions also increased for all frequency bands. The weakening of beta strength in the central and bilateral areas in children with dyslexia has also been reported by Gallin et al. (1986; cited in Papagiannopoulou and Lagopoulos, 2016). The difference between the beta and delta waves has been confirmed in at least two studies (Lavidor, et al., 2006; Ziegler, 2006). In one study, Fadzal et al. (2012) identified the EEG signals of dyslexic and normal children in two modes: rest and writing words and processed, analyzed, and compared them. Four electrodes C3, C4, P3, and P4 were used to record EEG signals. The recorded EEG signals were filtered using a bandwidth filter with a frequency range of 8 Hz. Analysis of EEG signals showed that the frequency range of EEG signals during writing at each electrode position at a lower beta band frequency is much larger for dyslexic children than for normal reading children. The frequency range of EEG signals was 20 to 28 Hz for dyslexic children and 14 to 22 Hz for normal children. It is also reported an increase in alpha strength in the left hemisphere of temporal areas as well as the left ventricular areas of dyslexics (Breteler, et al., 2010). On the other hand, Butler et al. (2010) stated that a significant increase in alpha coherence may be indicative of attention processes that improve reading (Breteler, et al., 2010).
There are anatomical studies (Galaburda, et al.,2000), which have shown the absence of the usual left-right hemisphere asymmetry of the planum temporale in dyslexia or suggested a possible role of the left inferior frontal gyrus in speech perception and rapid auditory processing, as well as in phonological aspects of reading (Habib, 2000), although no strong effects have been reported (Habib, 2000). Eckert et al. (2003) found anatomical anomalies underlying the double-deficit subtype of dyslexia. Their findings suggest that impairments in a frontal-cerebellar network may play a role in delayed reading development in dyslexia.
To study the neural factors of dyslexia, functional neuroimaging has been used. However, there is not much evidence with respect to developmental dyslexia since this research has focused on (young) adults (Habib, 2000). Only Shaywitz and Shaywitz (Shaywitz & et al., 2002; Shaywitz & Shaywitz, 2005) used children in their neuroimaging studies in order to examine the neural systems for reading during the acquisition of literacy. These reports show a failure of the left hemisphere posterior brain systems to function properly during reading (Shaywitz & Shaywitz, 2002; Shaywitz & Shaywitz, 2005). The majority of studies show increased activation in the basal surface of the temporal lobe, the posterior portion of the superior and middle temporal gyri, extending into temporoparietal areas and the inferior frontal lobe during tasks requiring reading and phonological processing (Vellutino,2004). Shaywitz et al. (2002) supported these findings; however, they show evidence of right hemisphere activation in the posterior temporal parietal regions. This could reflect compensatory processes or indicate that other nonlinguistic factors are related to reading disability (Shaywitz & Shaywitz, 2002; Shaywitz & Shaywitz, 2005; Vellutino,2004).
Undoubtedly, the researcher’s efforts have paved the way for the identification of the neuropsychological foundations of dyslexia. But most of this research seems to have neglected attention to dyslexia as a heterogeneous disability. As Sophie and Rico (2002, cited by Hill & Fiurlo, 1961) have suggested, the notion of these children as a “common group by reading” may inadvertently lead to a lack of recognition of learning disabilities, possibly due to referral biases. Different diagnoses result from the tools used. These necessitate more detailed work to identify the relationships of the neuroscientific, physiological, and functional nerves between the types of dyslexia that can lead to more effective interventions for these children ( Spring, 2001, quoted in Hill & Fiurlo, 1961). Significance of the Attention Deficit Hyperactivity Disorder (ADHD) was emphasized by Walker and Norman (2006), Breteler, et al. (2010), Penolazzi et al. (2008), Arns, et al. (2007), Papagiannopoulou and Lagopoulos (2016), and Fadzal et al. (2012).
Accordingly, the present study aimed to identify the pattern of brain waves in dyslexic subgroups. For this purpose, one of the known divisions, namely the division of dyslexics into two subconscious and linguistic subgroups, has been used. This classification is provided by Bakker (1992) and his model Brasan for normal reading growth as well as an explanation of dyslexia. According to this model, known as the Treadmill Baker Model, primary learning is created primarily by the right hemisphere of the brain, while final reading should normally be controlled by the left hemisphere of the brain (Bakker, 1992). According to the equilibrium model, reading disorders occur when a hemisphere change occurs to control reading deviations (Dryer, et al., 1999).
Baker classified dyslexic readers into two categories: type P or perceptual, type L, or linguistic. Type P or perceptual dyslexia occurs when a person in the dominant use of the right hemisphere reading strategy is unable to shift to the production of left-wing strategies in the advanced reading stages. Accordingly, the reader continues to focus on the perceptual features of the text, leading to a precise but relatively slow and divided reading; these types of people make a lot of time-consuming mistakes, such as repetition and self-correction. Another subcategory, language type or L-type dyslexia, occurs when a person relies largely on the language strategies of the left hemisphere in the early stages of reading development. Model L has malfunctions and is used by fast readers, but incorrect, and also has many nominal errors, such as deletion, addition, and replacement (Dryer, et al., 1999).
In the present study, in order to identify the neural dysfunction pattern in the mentioned subgroups of dyslexia (only type L and type P), quantitative electroencephalography (QEEG) dyslexia was used to answer what is the difference between the three groups of dyslexic, perceptual, and normal students in reading each other to examine the pattern of cerebral waves?
2. Materials and Methods
Sample
The present study is a comparative cause in terms of the data collection method. The statistical population included all students in grades one to five who were illiterate in special centers for learning disabilities and normal students who were studying at Birjand primary school in the academic year 2018-19. Targeted sampling was used to select perceptual (P) and language (L) dyslexic students. In this study, of the 27 subjects studied, 24 cases (equivalent to 9.88%) were boys and three cases (equivalent to 1.11%) were girls. According to the information obtained from the educational level, six people (equivalent to 3.22%) in the first grade, eight people (equivalent to 6.29%) in the second grade, ten people (equivalent to 37%) in the third grade, two people (equivalent to 4.7%) in The fourth grade, and one person (equivalent to 7.3%) were studying in the fifth grade.
Instrument
To collect information about the physical and mental condition of students, the Questionnaire developed by Tabrizi in 2012 was used (Tabrizi, 2010). This questionnaire contains 11 paragraphs that include the following information: general information, birth, pregnancy, neurodevelopmental stages, physical health, family, child behavioral problems, educational problems, and the child’s self-concept. This questionnaire is completed by the mother.
The Wechsler test of this scale was developed by Wechsler (1969) to measure children’s intelligence. The Wechsler Intelligence Test is one of the most authoritative and widely used tests for assessing children’s intelligence (Marnat, 1996). The validity of this test has been reported through the two-half method to be 0.97 for general intelligence, 0.97 for verbal intelligence, and 0.93 for practical intelligence Tabrizi, 2010. In this study, its Persian form by Shahim (1994) was used to measure the intelligence of normalized children aged 6 to 13 years. The validity of this test has been reported through the two-factor model to be 0.94 for general intelligence and 0.96 for non-verbal intelligence. Also, the correlation of the test with academic achievement and retraining rate was reported to be 0.88 and 0.85, respectively (Shahim, 1994).
Disorders in reading and reading comprehension tests were used to identify and isolate dyslexic students. This test includes 11 Persian texts, each written on a card. Card number one is a practice card and the results are not taken into account in the calculations. Two to 11 cards are the main cards and both cards belong to the same base. In this way, the ability to read, understand, and read the speed of students in each grade is measured by two texts.
The validity of the structure of the test in reading accuracy for pair cards (story text at the relevant basic level) was between 0.6 and 0.9, and for individual cards (text of the relevant grade textbook) between 0.7 and 0.9, comprehension. Content for even cards is between 0.3 and 0.6 and for individual cards is between 0.3 and 0.5. The reading speed for even and odd cards fluctuated between 0.8 and 0.9 separately. All coefficients were significant at the P<0.100 level. In order to calculate the reliability of the test, two methods of Cronbach’s alpha and parallel were used. Cronbach’s alpha for reading accuracy in pair cards was 0.9 and in individual cards was 0.8. The reading comprehension score was 0.8 for even cards, 0.7 for individual cards, 0.9 for reading speed for even cards, and 0.8 for individual cards. Parallel validity in couple and individual cards in reading accuracy, comprehension, and reading speed was 0.9 for all (Hosseinilor, et al., 2005).
A small amount of electroencephalography was used in this study to record the brain waves of the target groups using the Mitsar amplifier, during which a special cap was placed on the patient’s head. From 19 head area F3, F7, Fp2, Fp1, O2, O1, T6, P4, PZ, P3, T5, T4, C4, CZ, C3, T3, F8, F4, and FZ waves were recorded.
The power was calculated in the following frequency bands: delta (1-4 Hz), theta (4-8 Hz), alpha (8-12 Hz), and beta (12-25 Hz).
The brain waves were recorded in a quiet room in both open and closed-eye conditions for 6 minutes at a sampling rate of 500 Hz. The mean left and right ear electrodes (E1 and E2) were used as reference electrodes. Vienna EEG software was used to record brain waves and NeuroGuide™ software was used to analyze brain waves.
To process brain signals, first, the brain signals in NeuroGuide software were filtered by a 1-40 Hz midpoint filter. Then, in NeuroGuide software, parts of the signal with a motion artifact, the noise of eye movements, and the noise of nerve stimulation of the muscle were manually deleted. Then, the power was calculated in the following frequency bands: delta (1-4 Hz), theta (4-8 Hz), alpha (8-12 Hz), and beta (12-25 Hz), and extracted and analyzed with the help of this software.
Design
Using this method, the city center of learning disorders was first referred to. Then, a list of students with reading disorders from first to fifth grade was provided to the researcher. In the next step, the parents of each of these students were contacted and invited to participate in the research. Poor-e-Etemad test was performed on dyslexic students who were willing to cooperate. According to the analysis of errors in this test, students whose basic errors were of the type of deletion and addition of the word, inversion, displacement, etc. under the linguistic group and students whose basic errors were mainly self-correction, repetition and pause were placed in the perceptual group. Since the study group in the present study was normal students in reading, an available sampling method was used to select this sample. For this purpose, a boys’ school willing to cooperate was selected. Then, ten students in the first to fifth grade were selected who, according to their teachers, were normal in reading, and in addition were willing to cooperate with the research. The criteria for entering this group other than (obtaining a low score on the diagnostic test) were similar to the criteria for dyslexic students. The mentioned groups were age equivalent. Inclusion criteria in this study included normal IQ (95-110), the age range of 7-11 years, primary school education, lack of history of mental disorders, brain injury, neurological, sensory and motor problems, and reading problems related to emotional disorders.
The subjects were asked first to stare at a fixed point, while they were in a calm condition and minimize blinking and extra movements of their head, hands, and feet, and recording was done when the eyes were open for 6 minutes. After 3 to 5 minutes of break, the students were asked to return to the previously mentioned conditions and close their eyes. In closed-eye mode, the recording time was 6 minutes for each child. Then, all the encrypted information was stored separately in a folder for each person. Due to the small number of dependent variables (absolute and relative power of the waves) and the structure of the hypotheses and questions considered in the research, multivariate analysis of variance (MANOVA) and one-way analysis of variance (ANOVA) were used. It should be noted that data analysis was performed using NeuroGuide, SPSS software, version 25, STATA software, version 16, MATLAB software, and Excel version 2010.
3. Results
Comparison of the absolute power of brain waves of study groups in closed-eye mode
Based on the findings of one-way ANOVA and the Bonferroni test, a correction (0.05÷4=0.0125) was observed in all the brain locations considered; the difference in the absolute average power of the brain wave in the three study groups was not significant at P<0.05. It should be noted that if the Bonfroni test was ignored, in the FP2 brain location, the assumption of the equality of the absolute power averages of the delta wave was rejected (F(2, 13.679)=4.502, P=0.031). According to the Hughes Games follow-up test, the difference in the mean of the absolute power of the linguistic and normal groups in reading was significant (P=0.023).
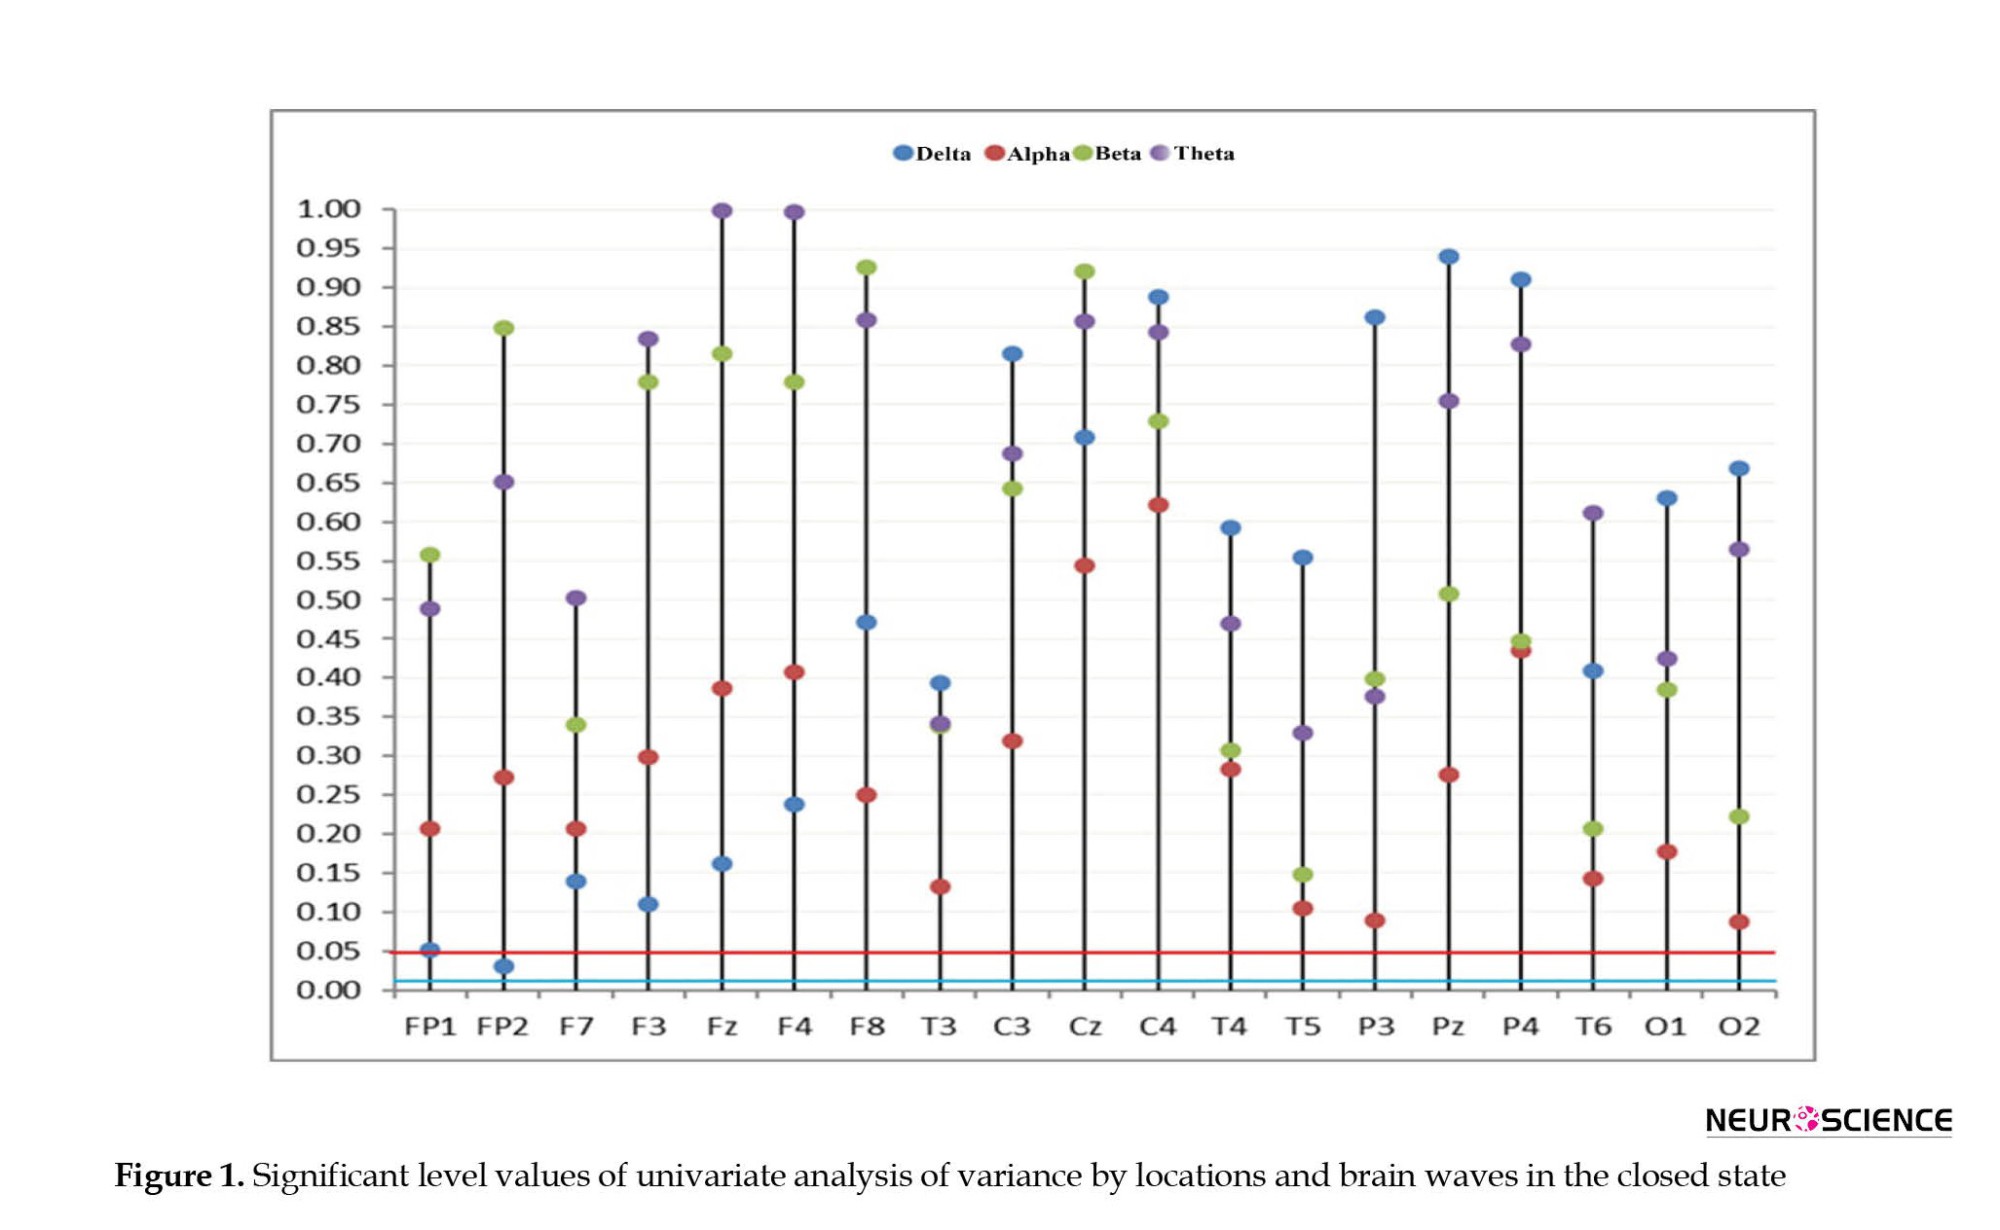
In order to confirm the previous content, according to Figure 1, it is clear that considering the Bonferroni test, p-values resulting from the univariate ANOVA for all locations and brain waves were above the line 0.125 (blue line). Ignoring the univariate correction, it is observed that in the FP2 brain location, a significant value corresponding to the delta wave was below the 0.05 line (red line).
Comparison of the absolute power of brain waves of study groups in open-eye mode
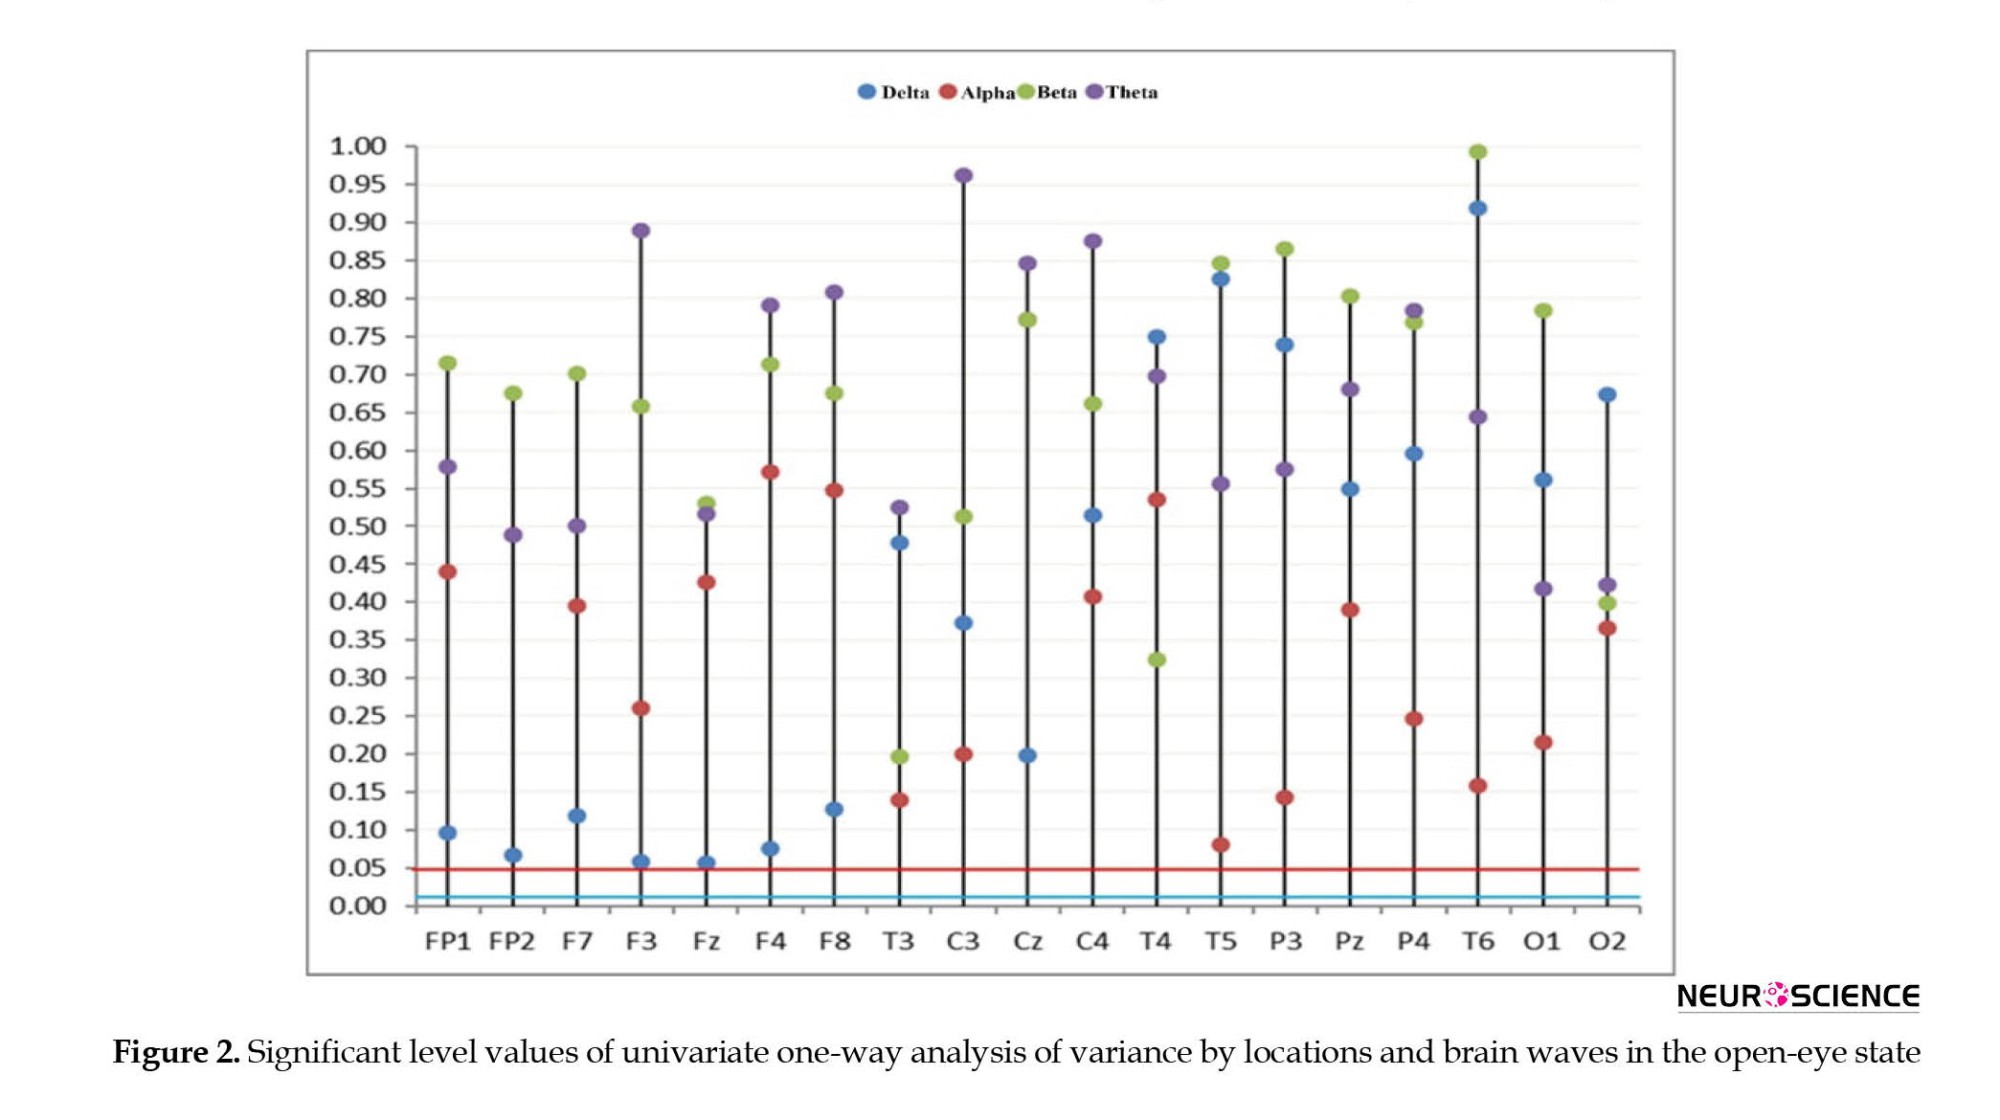
Based on the findings of the univariate ANOVA and considering the Bonferroni test (0.05÷0.04=0.0125), in all brain locations considered, sufficient reasons were found to reject the assumption of the equality of absolute brain power averages in three study groups at P<0.05. According to Figure 2, it is clear that by considering the buffering correction, the P obtained from the one-way ANOVA for all locations and brain waves are above the line of 0.125 (blue line).
Comparison of the relative power of brain waves in study groups
In the open and closed eye modes for each of the delta, theta, and beta waves, there was no significant difference between the study groups in terms of relative power. Also, based on the results obtained for the relative powers of the alpha wave in open and closed eyes, in the open-eye mode, there was no significant difference between the study groups, but in the closed-eye mode, there was a significant difference for some brain locations between study groups. Therefore, the output and tables related to delta, theta, and beta waves in open-eye and closed-eye modes and alpha wave in the open-eye mode were omitted, and only the details related to alpha wave in the closed-eye mode were expressed.
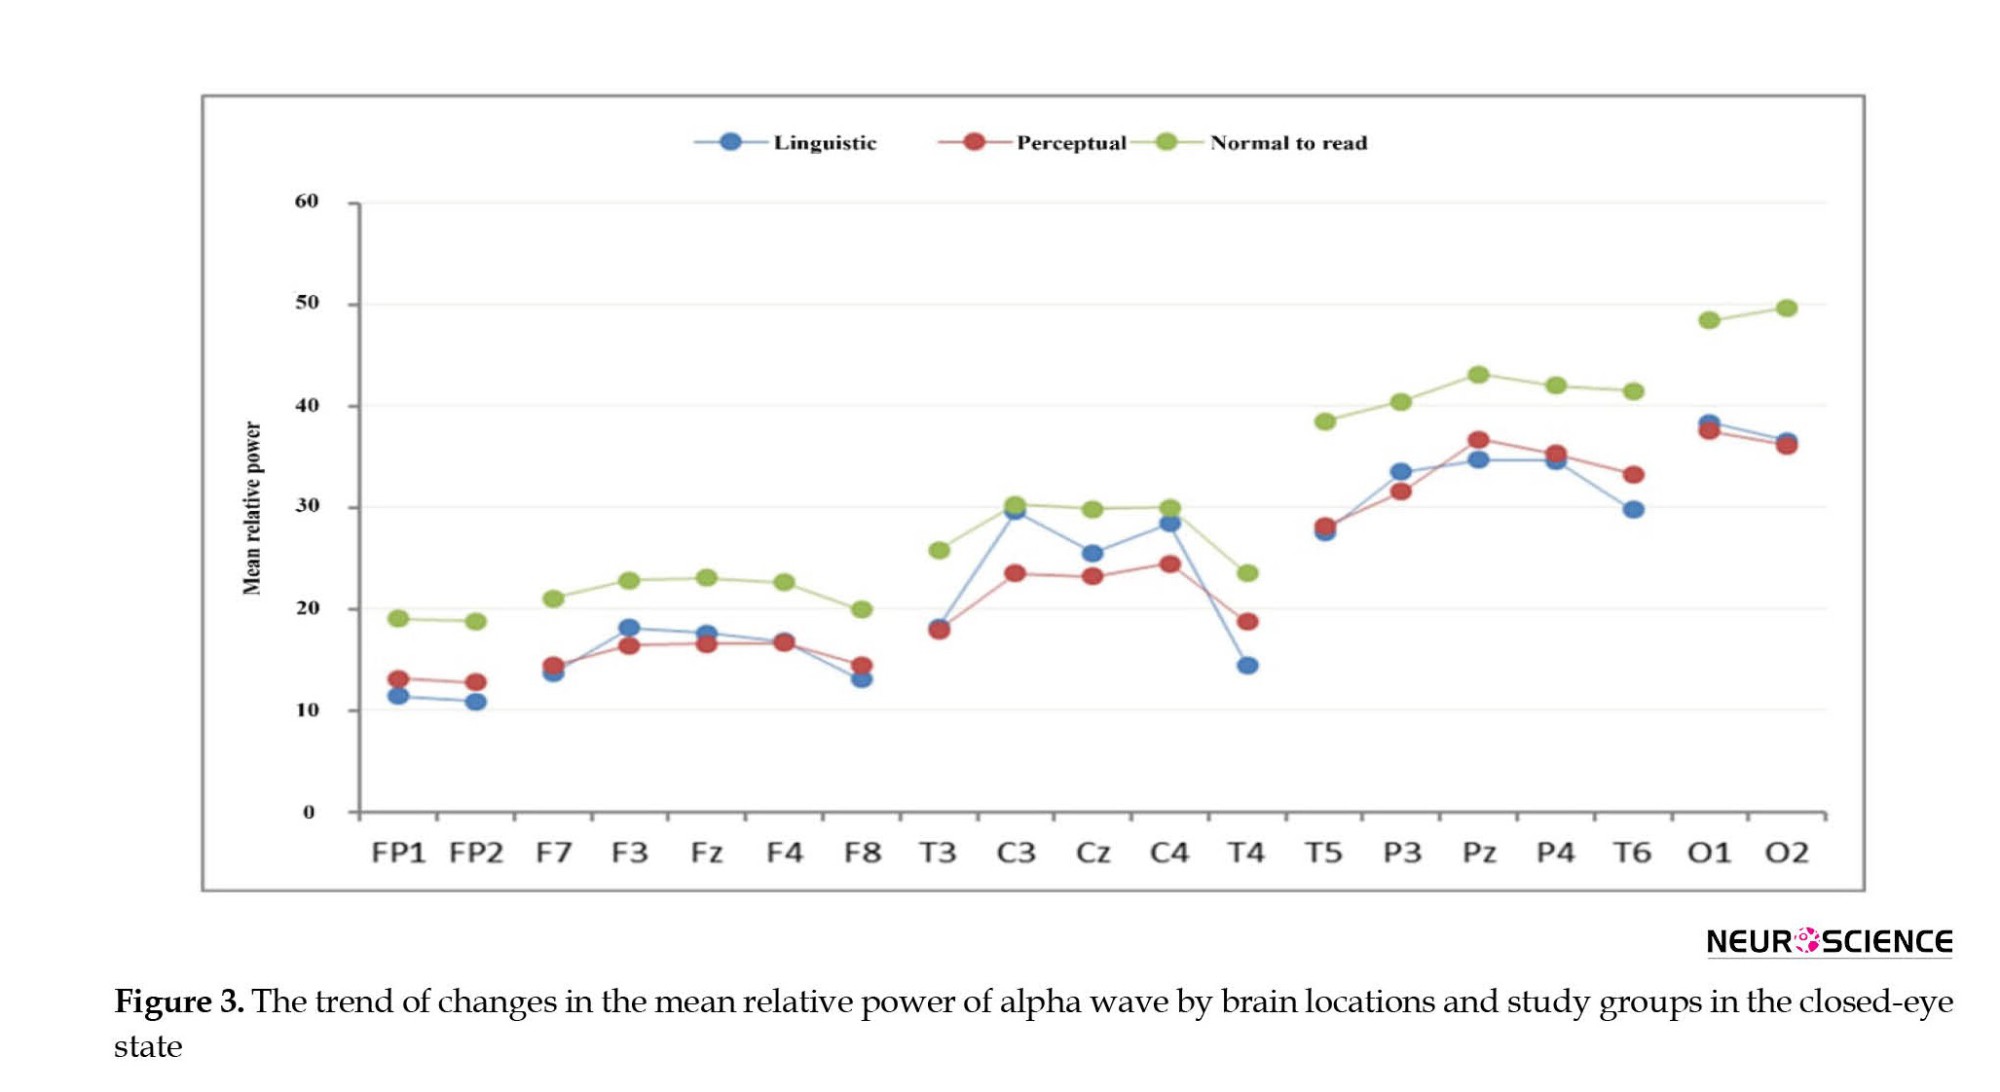
According to Figure 3, for all brain locations, the mean relative power of the alpha wave in the normal reading group was higher than in other study groups.
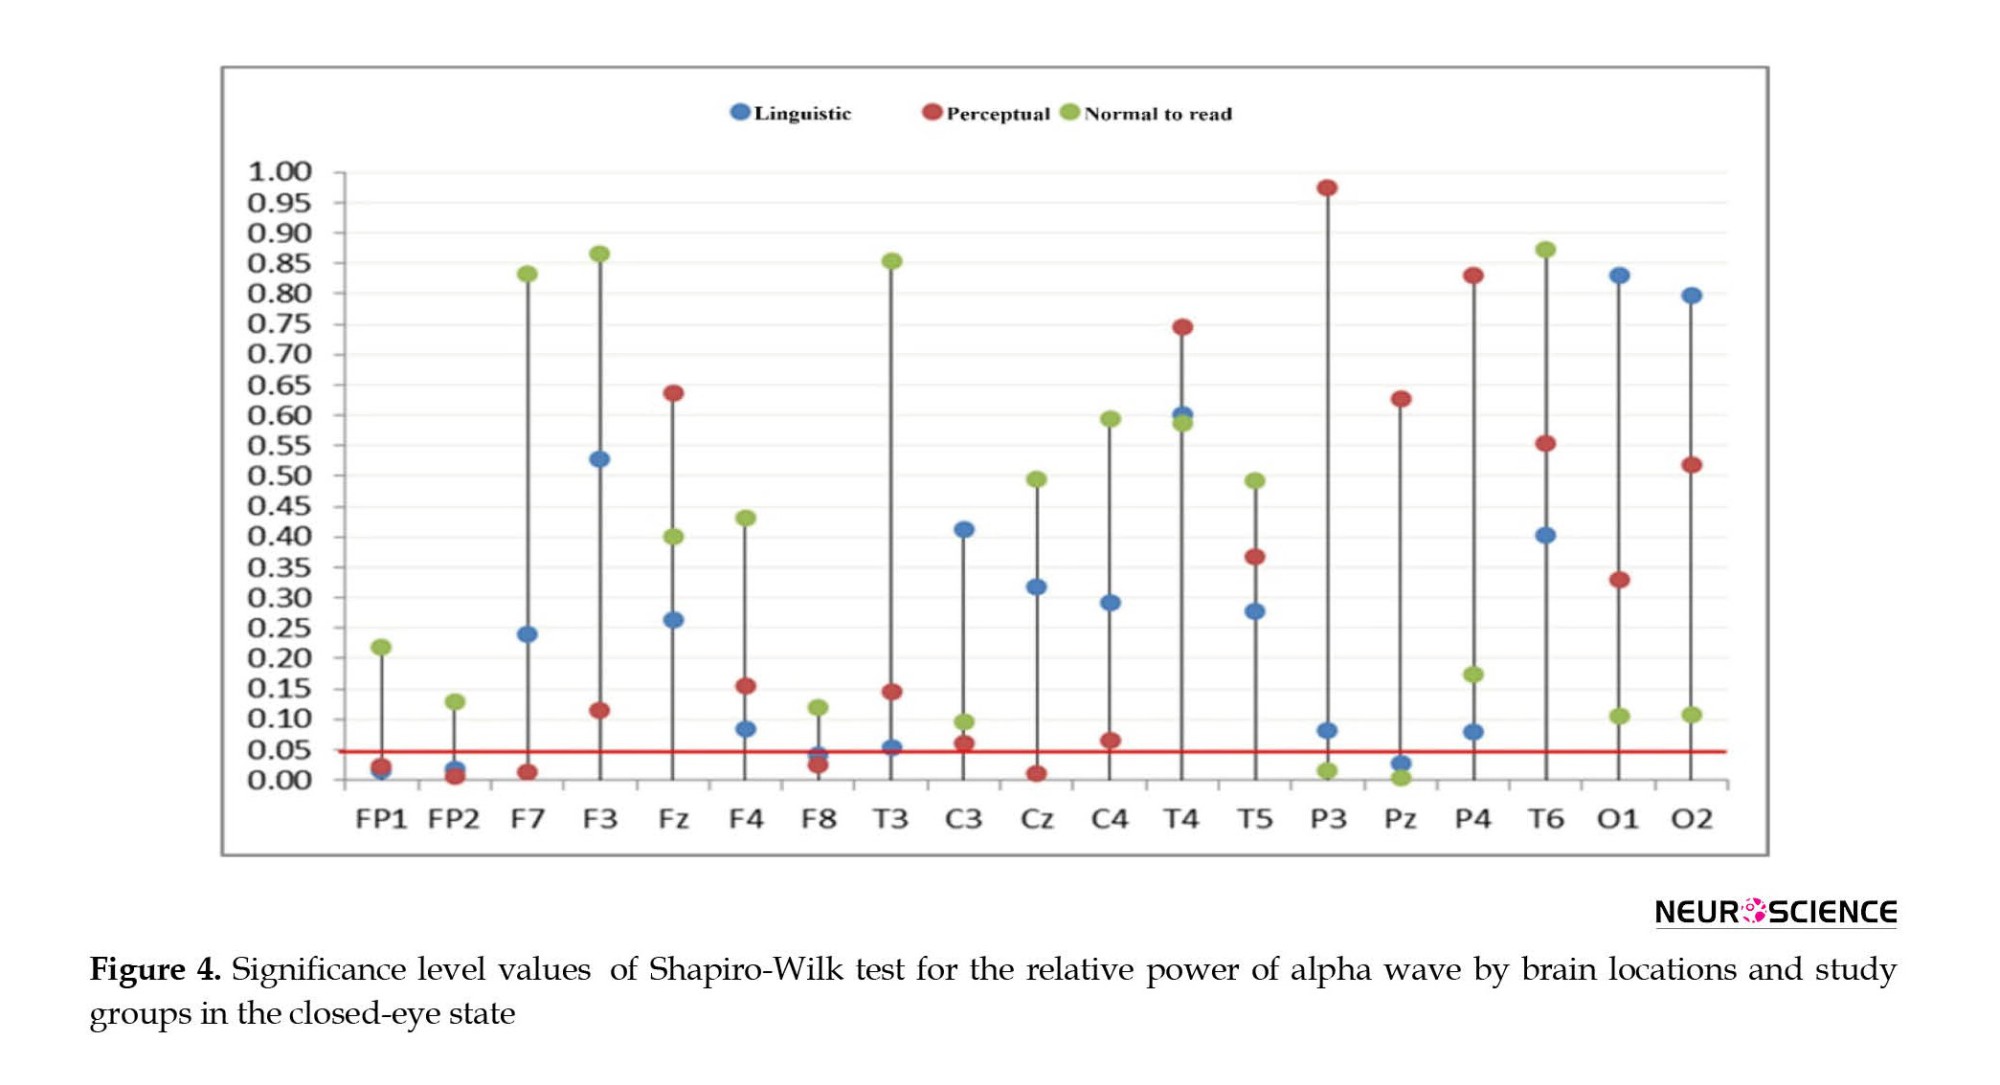
Therefore, the significance of the differences was investigated. For this purpose, first, the natural power distribution of alpha wave was investigated using the Shapiro-Wilk test. In order to facilitate the study of significant values obtained from Shapiro-Wilk tests, these values are plotted in Figure 4.
According to the findings of Figure 4, it was observed that for the FP1 brain location, the assumption of the natural distribution of the relative power of the alpha wave in the linguistic (SW(10)=0.802, P=0.015) and perceptual (SW(8)=0.790, P=0.022) groups was rejected. For FP2 brain location, the assumption of normal distribution of alpha wave relative power in linguistic (SW(10)=0.808, p=0.018<0.05) and perceptual (SW(8)=0.736, p=0.008<0.05) groups became significant. Also, for F7 (SW(8)=0.768, p=0.013) and CZ (SW(8)=0.763, p=0.011) brain locations in the perceptual group, the hypothesis of normal distribution of alpha wave relative power was rejected. In addition, for the P3 sites in the normal reading group (SW(9)=0.790, p=0.016), the PZ in the linguistic (SW(10)=0.822, p=0.027) and normal reading groups (SW(9)=0.745, p=0.005) were assumed the medical distribution of the relative strength of the alpha wave. For F8 brain location in the groups, the assumption of the natural distribution of the relative power of the alpha wave in the linguistic (SW(10)=0.839, p=0.042) and perceptual (SW(8)=0.796, p=0.026) groups was significant.
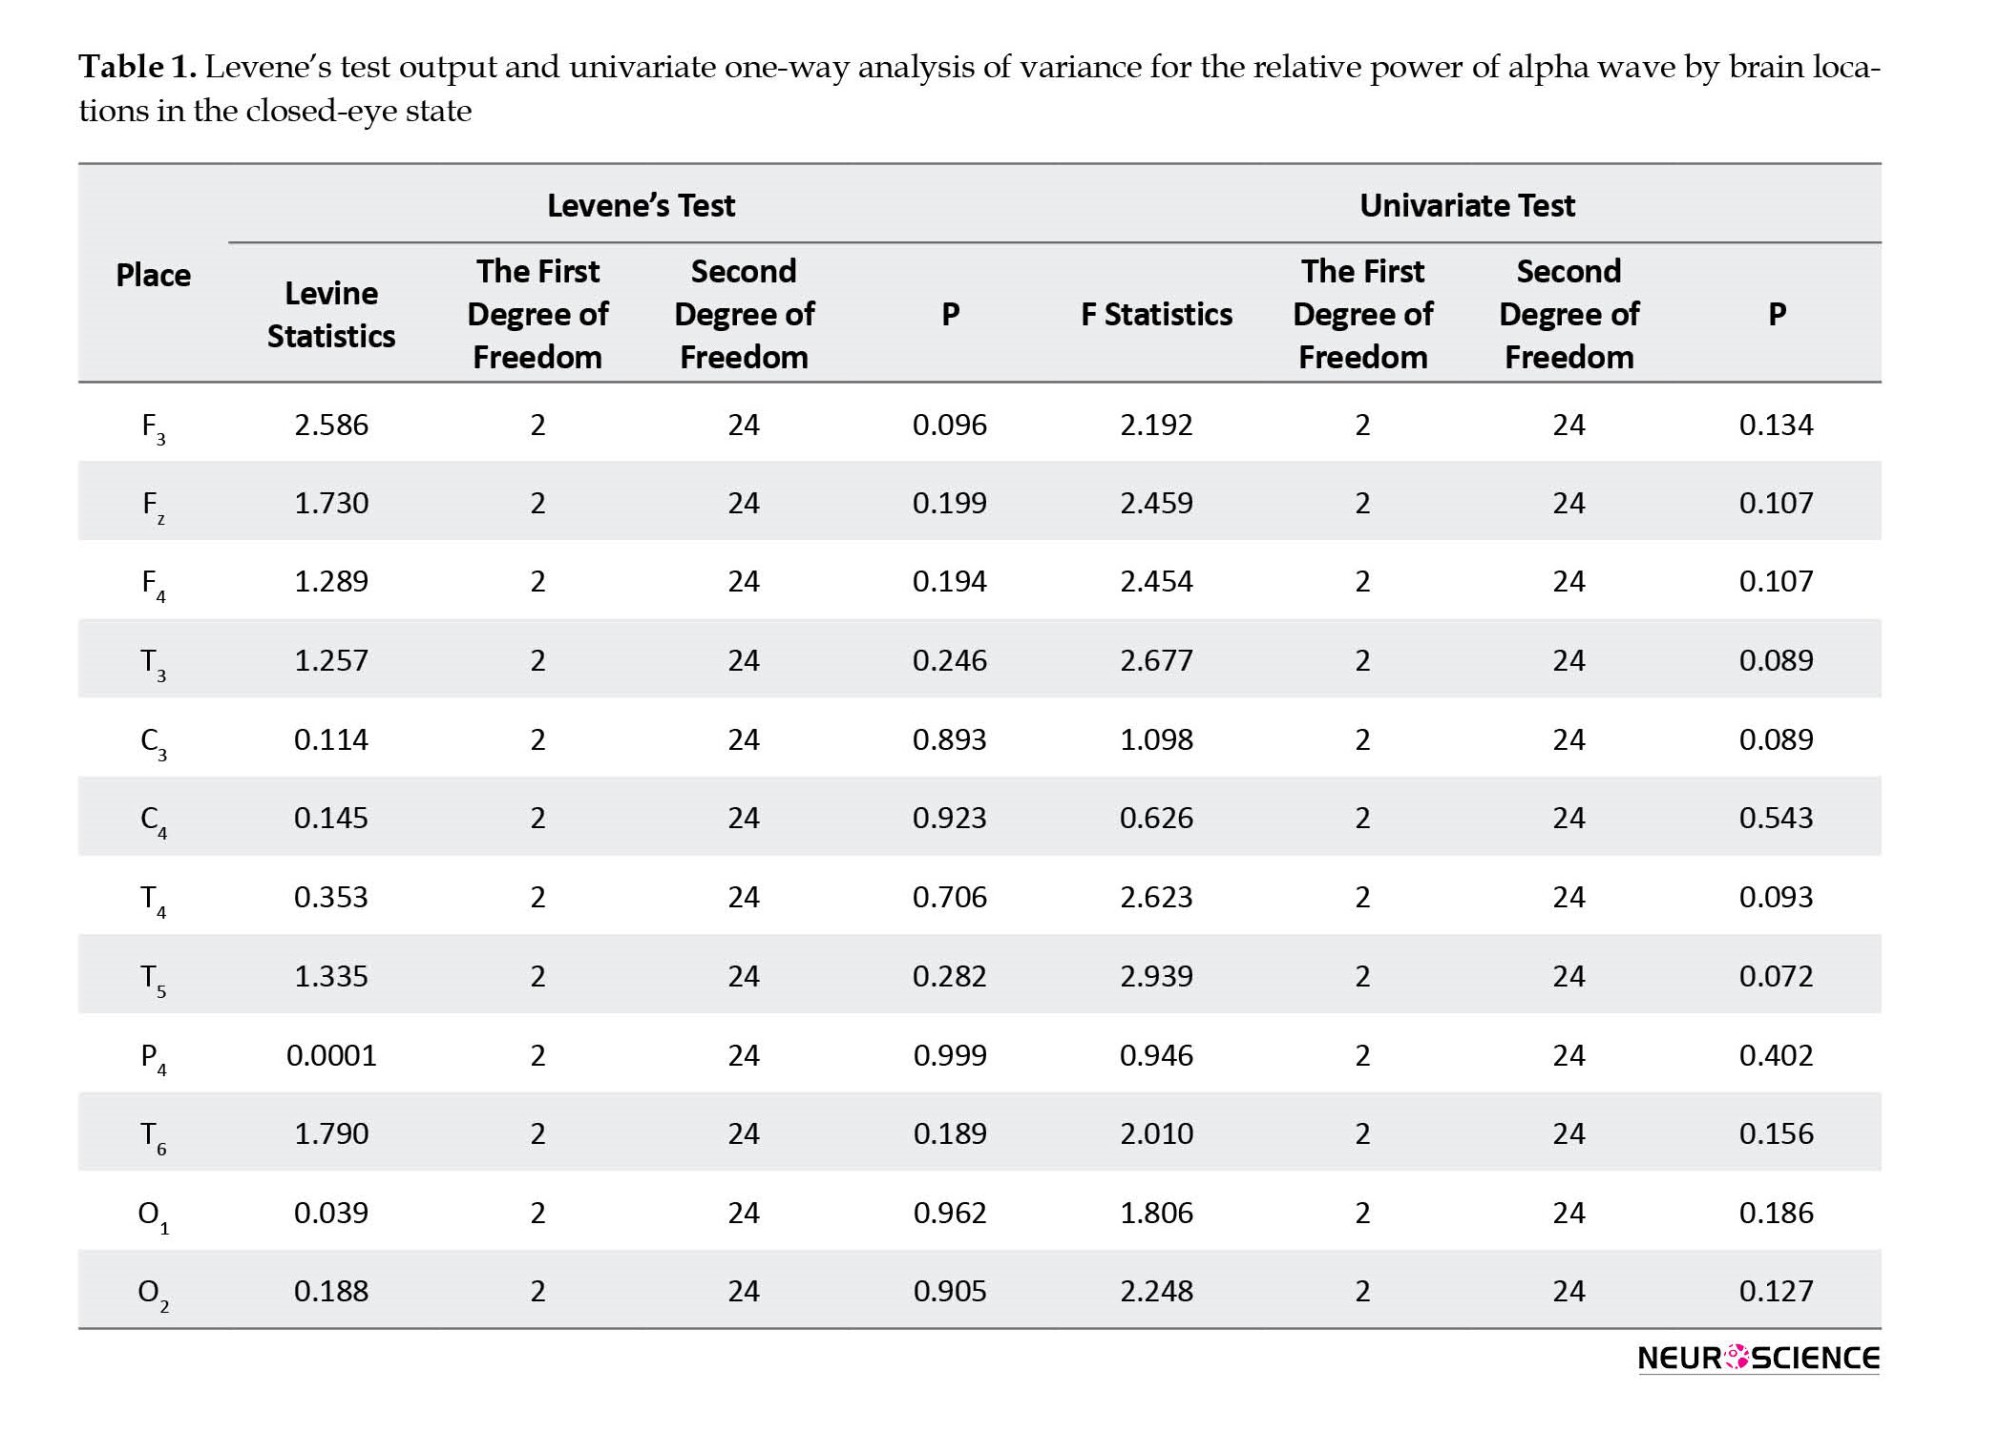
Then, for each of the brain locations where all study groups had normal distribution, univariate ANOVA and for other locations, the non-parametric Kruskal-Wallis test was used to compare the relative powers of alpha wave in the closed eye state. The specific output of Levene’s test and univariate ANOVA is separated by brain locations.
According to the findings of Levene’s test, in all considered brain locations, there were not enough reasons to reject the assumption of homogeneity of the alpha wave relative power variances in the three study groups at the level of P<0.05. In addition, based on the output of univariate one-way ANOVA and regardless of the Bonferroni test, no significant difference was found at the level of P<0.05 for each of the brain locations between study groups in terms of the relative power of an alpha wave in the blindfold. The output of the Kruskal-Wallis non-parametric test for brain locations was Cz, F8, F7, FP2, FP1, P3, and Pz.
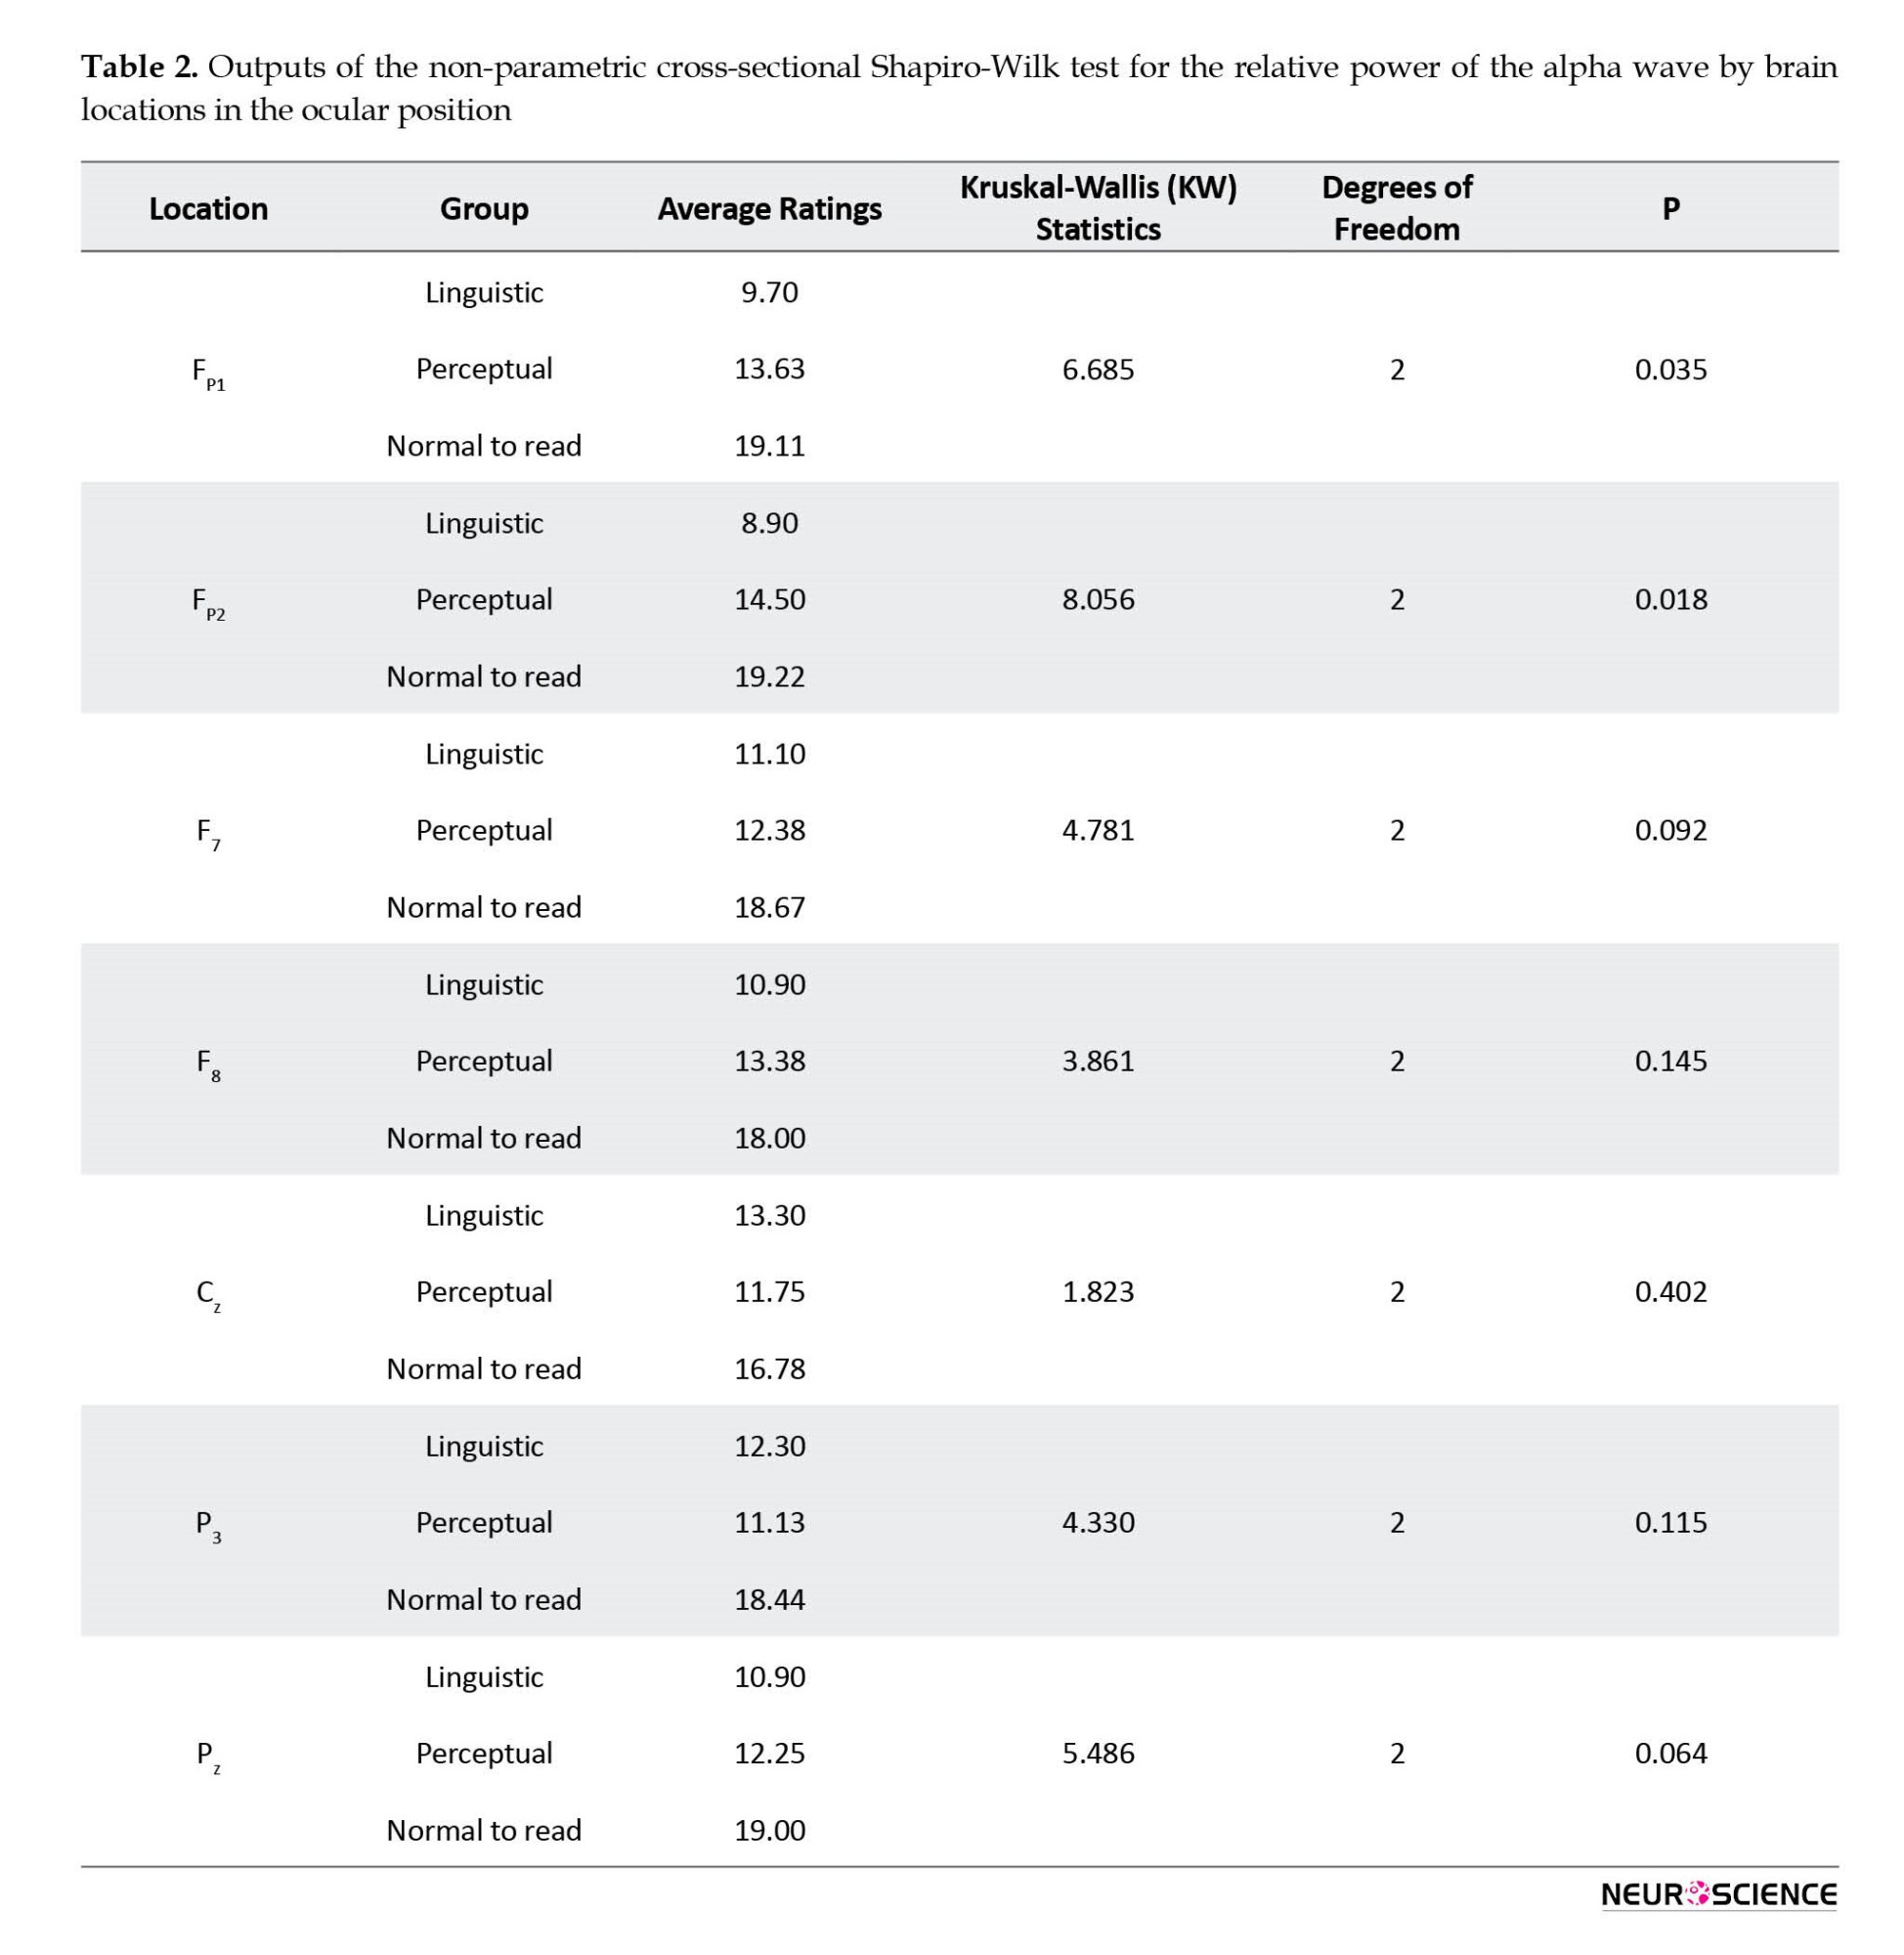
According to Table 2, it was observed that in each of the FP1 (SW(2)=6.685, P=0.035) and FP2 (SW(2)=8.056, P=0.018) brain locations, the assumption of the same alpha wave power distribution in the study groups was rejected. Nonparametric pairwise comparisons were used to identify groups with different distributions. It should be noted that in this table, in order to control a type I error of 0.05, adjusted significant values were used.
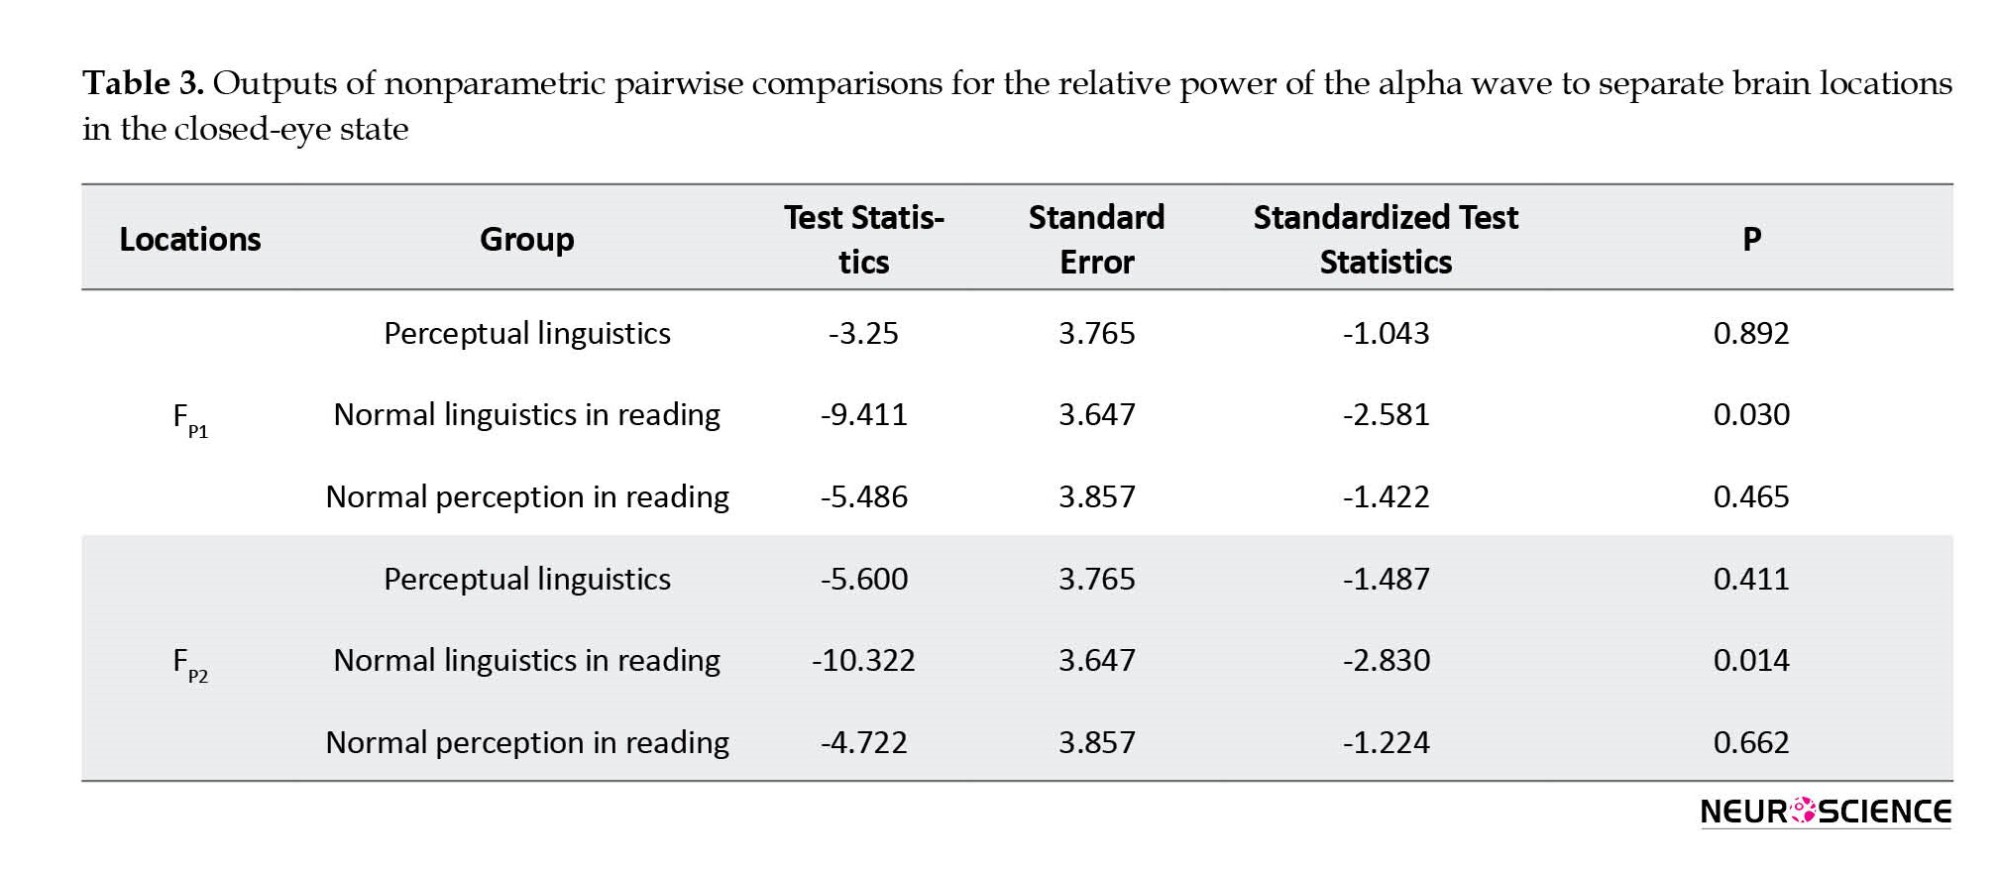
According to Table 3 for the FP1 location, there was a significant difference in the relative power distribution of the alpha wave in the closed state between the linguistic and normal reading groups (P=0.030). Similarly, for the FP2 locus, the assumption that the relative power distribution of the alpha wave was the same in the closed-eye state between the linguistic and normal reading groups was rejected (P=0.014). According to the mean scores provided, it was observed that in each of the brain locations FP1 and FP2, the relative power of the alpha wave in the blindfold mode for the normal group in reading was higher than the linguistic group.
4. Discussion
The aim of this study was to compare the brain wave patterns of dyslexic students in perceptual type, language type, and normal reading. In this study, no significant difference was observed in the two states of closed and open eyes in absolute power, but a significant difference was observed in the relative power of an alpha wave in two channels Fp1 and Fp2. Thus, in the FP1 and FP2 brain locations, the relative power of the alpha wave in the blindfold mode was higher for the normal reading group than for the linguistic group.
Arns et al. (2007) compared the pattern of brain wave activity in the two groups of dyslexic and normal non-adult years. For this reason, their results were compared with the present study and showed the differences and similarities, in which accuracy can lead to valuable points.
Difference
According to the research by Arns et al. (2007) in the delta wave of F7, Fp2, Fp1, and T6 regions and theta wave of Fp2, Fp1 and F7 regions, there was a difference in dyslexic and normal students, but in the present study, there was a difference in absolute wave power. Different age groups in the two studies may play a role in the difference in results. While in the study of Arns et al. (2007), the age range of the sample was between 8 and 16 years, in the present study, the age of the subjects was between 7 and 11 years.
Similarities
According to the research by Arns et al. (2007), Fp1 and Fp2 are two areas, in which dyslexics and normal people in reading show differences in the activity of waves (delta and theta). The importance of these two areas of the brain was also shown in the present research. The results of the present study showed that the relative power of the alpha wave in the closed state in the two channels Fp1 and Fp2 for the linguistic group was less than the normal group in reading. Before discussing the findings of the study, it is necessary to explain the alpha wave and the function of the prefrontal cortex.
In the study conducted by Çiçek and Nalçacı (2001) on right-handed subjects, they concluded that the alpha wavelength increased at rest and the left frontal lip alpha decreased significantly during cognitive tasks. In justification of this finding, it was stated that with an increasing alpha wave, the amount of cortical arousal decreases, thus reducing the processing of data related to unnecessary external stimuli, and such a strategy makes the subject focused on the main test and thus performance optimally increases.
An important part of the frontal lobe is the “prefrontal cortex”, which is located in front of the motor cortex (Santrak, 2003). From the perspective of neuropsychology (Brocki & Bohlin, 2004; Thorell, et al., 2009) executive functions are associated with the prefrontal cortex of the brain and include the highest cognitive functions necessary for purposeful behavior. Some neuroscientists consider the prefrontal cortex to be an executive function because it is involved in reviewing and organizing thinking (Owen, 1997, quoted in Santrak, 2003). Neurological executive functions are important structures that are related to the psychological processes responsible for controlling consciousness and thinking in action. These functions regulate behavioral outputs and usually include inhibition and control of stimuli, working memory, sustained attention, planning, and organization (Denckla, 2003). As mentioned, one of the most important executive functions is response deterrence and sustained attention. Response inhibition is the ability to think before acting. This skill provides the ability to assess posture and behavior before surgery (Dawson & Guare, 2004). Students whose frontal lobe (the area that plays a key role in attention and inhibition) is damaged are easily distracted by unrelated stimuli and therefore often cannot follow certain instructions (Santrak, 2003).
Based on the Barclay Barkley (1997) inhibition model, it is assumed that the proper functioning of executive functions depends on the proper functioning of inhibition in the frontal lobe and forehead (Alizadeh & Zahedipour, 2004). Behavioral inhibition patterns involved in the impairment of function affect the four basic executive functions, including working memory, internal speech, reconstruction, and self-regulation of motivation and excitement, resulting in impaired self-control function (Barkley, 1997).
5. Conclusion
Executive functions have been at the heart of recent theories of the neuropsychological risk of children at risk of disability; especially for students with learning disabilities (reading, dictation, and math) and students with ADHD. Impairment of behavioral inhibition and poor control can impede effective self-management, and impulsive behaviors are a manifestation of such a situation (Alizadeh & Zahedipour, 2004).
An important point in the present study is the existence of common characteristics between dyslexic and hyperactive students; one of the common features of these two groups is weakness in executive functions (Masterpasqua & Healey, 2003). Will Cut et al. (2000; quoted by Moradi, et al., 2014) stated that dyslexia is widely associated with ADHD. According to research by Clarke et al. (2002), students with ADHD have more theta ratio and lower alpha lineage in brain waves. Therefore, dyslexic students with hyperactivity may be part of the linguistic subgroup; this statement needs to be further researched in this field.
This study was associated with limitations, such as the low number of dyslexic girls and the age limit of subjects. Therefore, it is recommended that brain scans be performed on girls at different age intervals. Research suggestions include conducting similar studies using larger samples for higher reproducibility, using task reading during EEG recording of dyslexic students, and evaluating the effectiveness of neurofeedback in forearm areas (FP1 and FP2) to increase executive performance and thus improve language dysfunction.
Ethical Considerations
Compliance with ethical guidelines
All ethical principles were considered in this article.
Funding
This research did not receive any grant from funding agencies in the public, commercial, or non-profit sectors.
Authors' contributions
All authors equally contributed to preparing all parts of the research.
Conflict of interest
The authors declare no conflict of interest.
Acknowledgments
We would like thank the Vice Chancellor of Research of Birjand University.
Reference
Abdeldayem, H., & Selim, O. (2005). Neuropsychological assessment and EEG evaluation of dyslexic children. The International Journal of Child Neuropsychiatry, 2(2), 155-162. [Link]
Alizadeh, H., & Zahedipour, M. (2004). [Executive functions in children with and without developmental coordination disorder (Persian)]. Advances in Cognitive Science, 6(3), 49-56. [Link]
Arns, M., Peters, S., Breteler, R., & Verhoeven, L. (2007). Different brain activation patterns in dyslexic children: Evidence from EEG power and coherence patterns for the double-deficit theory of dyslexia. Journal of Integrative Neuroscience, 6(01), 175-190. [DOI:10.1142/S0219635207001404] [PMID]
American Psychiatric Association. (2013). Diagnostic and statistical manual of mental disorders (DSM-5®). Virginia : American Psychiatric Association. [DOI:10.1176/appi.books.9780890425596]
Bakker, D. J. (1992). Neuropsychological classification and treatment of dyslexia. Journal of Learning Disabilities, 25(2), 102-109. [DOI:10.1177/002221949202500203] [PMID]
Barkley, R. A. (1997). ADHD and the nature of self-control. New York: The Guilford Press. [Link]
Barkley, R. A. (2011). The important role of executive functioning and self-regulation in ADHD. Journal of Child Neuropsy, 113(21), 41-56. [Link]
Breteler, M. H., Arns, M., Peters, S., Giepmans, I., & Verhoeven, L. (2010). Improvements in spelling after QEEG-based neurofeedback in dyslexia: A randomized controlled treatment study. Applied Psychophysiology and Biofeedback, 35(1), 5-11. [DOI:10.1007/s10484-009-9105-2] [PMID] [PMCID]
Brocki, K. C., & Bohlin, G. (2004). Executive functions in children aged 6 to 13: A dimensional and developmental study. Developmental Neuropsychology, 26(2), 571-593. [DOI:10.1207/s15326942dn2602_3] [PMID]
Casanova, M. F., Araque, J., Giedd, J., & Rumsey, J. M. (2004). Reduced brain size and gyrification in the brains of dyslexic patients. Journal of Child Neurology, 19(4), 275-281. [DOI:10.1177/088307380401900407] [PMID]
Çiçek, M., & Nalçacı, E. (2001). Interhemispheric asymmetry of EEG alpha activity at rest and during the Wisconsin Card Sorting Test: Relations with performance. Biological Psychology, 58(1), 75-88. [DOI:10.1016/S0301-0511(01)00103-X] [PMID]
Clarke, A. R., Barry, R. J., McCarthy, R., & Selikowitz, M. (2002). EEG analysis of children with attention-deficit/hyperactivity disorder and comorbid reading disabilities. Journal of Learning Disabilities, 35(3), 276-285. [DOI:10.1177/002221940203500309] [PMID]
Dawson, P., & Guare, R. (2018). Executive skills in children and adolescents: A practical guide to assessment and intervention. New York City: Guilford Publications. [Link]
Denckla M. (2003). ADHD: Topic update. Brain and Development, 25(6), 383-389. [DOI:10.1016/S0387-7604(03)00057-3] [PMID]
Dryer, R., Beale, I. L., & Lambert, A. J. (1999). The balance model of dyslexia and remedial training: An evaluative study. Journal of Learning Disabilities, 32(2), 174-186. [DOI:10.1177/002221949903200207] [PMID]
Eckert, M. A., Leonard, C. M., Richards, T. L., Aylward, E. H., Thomson, J., & Berninger, V. W. (2003). Anatomical correlates of dyslexia: Frontal and cerebellar findings. Brain, 126(Pt 2), 482–494. [DOI:10.1093/brain/awg026] [PMID]
Fadzal, C. C. W., Mansor, W., Lee, K. Y., Mohamad, S., Mohamad, N., & Amirin, S. (2012). Comparison between characteristics of EEG signal generated from dyslexic and normal children. Paper presented at: 2012 IEEE-EMBS Conference on Biomedical Engineering and Sciences, Langkawi, Malaysia, 17-19 December 2012. [DOI:10.1109/IECBES.2012.6498210]
Ferrer, E., Shaywitz, B. A., Holahan, J. M., Marchione, K., & Shaywitz, S. E. (2010). Uncoupling of reading and IQ over time: Empirical evidence for a definition of dyslexia. Psychological Science, 21(1), 93-101. [DOI:10.1177/0956797609354084] [PMID]
Galaburda, A. M., Sherman, G. F., Rosen, G. D., Aboitiz, F., & Geschwind, N. (1985). Developmental dyslexia: Four consecutive patients with cortical anomalies. Annals of Neurology, 18(2), 222-233. [DOI:10.1002/ana.410180210] [PMID]
Hallahan, D. P. (2005). Learning disabilities foundations, characteristics, and effective teaching. London: Pearson. [Link]
Habib, M. (2000). The neurological basis of developmental dyslexia: An overview and working hypothesis. Brain, 123(Pt 12), 2373-2399. [DOI:10.1093/brain/123.12.2373] [PMID]
Hill, J. B., & Fiurlo, K. A. (1961). Psychological neurosis in school. Tehran: Arjmand Publications.
Hosseinilor, F., Pouretemad, H., & Heidari, M. (2005). [Comparison of phonological skills in two subgroups of perceptual and linguistic (Persian)]. Advances in Cognitive Science, 7(3), 25-35. [Link]
Lavidor, M., Johnston, R., & Snowling, M. J. (2006). When phonology fails: Orthographic neighbourhood effects in dyslexia. Brain and Language, 96(3), 318-329. [DOI:10.1016/j.bandl.2005.06.009] [PMID]
Lyon, G. R., Shaywitz, S. E., & Shaywitz, B. A. (2003). A definition of dyslexia. Annals of Dyslexia, 53(1), 1-14. [DOI:10.1007/s11881-003-0001-9]
Masterpasqua, F., & Healey, K. N. (2003). Neurofeedback in Psychological Practice. Professional Psychology: Research and Practice, 34(6), 652-656. [DOI:10.1037/0735-7028.34.6.652]
Meyler, A., Keller, T. A., Cherkassky, V. L., Lee, D., Hoeft, F., & Whitfield-Gabrieli, S., et al. (2007). Brain activation during sentence comprehension among good and poor readers. Cerebral Cortex, 17(12), 2780-2787. [PMID] [PMCID]
Moradi, M. R., Faramarzi, S., & Abedi, A. (2014). The effectiveness of phonological games on reading performance of dyslexic male students. Knowledge and Research in Applied Psychology, 15(1), 44-51. [Link]
Papagiannopoulou, E. A., & Lagopoulos, J. (2016). Resting state EEG hemispheric power asymmetry in children with dyslexia. Frontiers in Pediatrics, 4, 11. [PMID] [PMCID]
Penolazzi, B., Spironelli, C., & Angrilli, A. (2008). Delta EEG activity as a marker of dysfunctional linguistic processing in developmental dyslexia. Psychophysiology, 45(6), 1025-1033. [DOI:10.1111/j.1469-8986.2008.00709.x] [PMID]
Plante, E., Boliek, C., Binkiewicz, A., & Erly, W. K. (1996). Elevated androgen, brain development and language/learning disabilities in children with congenital adrenal hyperplasia. Developmental Medicine & Child Neurology, 38(5), 423-437. [DOI:10.1111/j.1469-8749.1996.tb15100.x] [PMID]
Rumsey, J. M., Andreason, P., Zametkin, A. J., Aquino, T., King, A. C., & Hamburger, S. D., et al. (1994). Failure to activate the left temporoparietal cortex in dyslexia: An oxygen 15 positron emission tomographic study. Archives of Neurology, 49(5), 527-534. [Link]
Santrak, J. W. (2003). Psychology. New York: McGraw-Hill. [Link]
Schlaggar, B. L., & McCandliss, B. D. (2007). Development of neural systems for reading. Annual Review of Neuroscience, 30, 475–503. [DOI:10.1146/annurev.neuro.28.061604.135645] [PMID]
Shahim, S. (1994). Application of Wechsler Intelligence Scale for Children in Iran. Journal of Psychological Research, 1(3-4), 32.
Shaywitz, B. A., Shaywitz, S. E., Blachman, B. A., Pugh, K. R., Fulbright, R. K., & Skudlarski, P., et al. (2004). Development of left occipitotemporal systems for skilled reading in children after a phonologically-based intervention. Biological Psychiatry, 55(9), 926-933. [DOI:10.1016/j.biopsych.2003.12.019] [PMID]
Shaywitz, B. A., Shaywitz, S. E., Pugh, K. R., Mencl, W. E., Fulbright, R. K., & Skudlarski, P., et al. (2002). Disruption of posterior brain systems for reading in children with developmental dyslexia. Biological Psychiatry, 52(2), 101-110. [DOI:10.1016/s0006-3223(02)01365-3] [PMID]
Shaywitz, S. E., & Shaywitz, B. A. (2007). The neurobiology of reading and dyslexia. The ASHA Leader, 12(12), 20-21. [DOI:10.1044/leader.FTR7.12122007.20]
Shaywitz, S. E., & Shaywitz, B. A. (2005). Dyslexia (specific reading disability). Biological Psychiatry, 57(11), 1301-1309. [DOI:10.1016/j.biopsych.2005.01.043] [PMID]
Spironelli, C., Penolazzi, B., & Angrilli, A. (2008). Dysfunctional hemispheric asymmetry of theta and beta EEG activity during linguistic tasks in developmental dyslexia. Biological Psychology, 77(2), 123-131. [DOI:10.1016/j.biopsycho.2007.09.009] [PMID]
Tabrizi, M. (2010). [Treatment of reading disorders (Persian)]. Tehran: Faravan Publications.
Temple, E. (2002). Brain mechanisms in normal and dyslexic readers. Current Opinion in Neurobiology, 12(2), 178-183. [DOI:10.1016/S0959-4388(02)00303-3] [PMID]
Thorell, L. B., Lindqvist, S., Bergman Nutley, S., Bohlin, G., & Klingberg, T. (2009). Training and transfer effects of executive functions in preschool children. Developmental Science, 12(1), 106-113. [DOI:10.1111/j.1467-7687.2008.00745.x] [PMID]
Vandermosten, M., Boets, B., Wouters, J., & Ghesquière, P. (2012). A qualitative and quantitative review of diffusion tensor imaging studies in reading and dyslexia. Neuroscience & Biobehavioral Reviews, 36(6), 1532-1552. [DOI:10.1016/j.neubiorev.2012.04.002] [PMID]
Walker, J. E., & Norman, C. A. (2006). The neurophysiology of dyslexia: A selective review with implications for neurofeedback remediation and results of treatment in twelve consecutive patients. Journal of Neurotherapy: Investigations in Neuromodulation, Neurofeedback and Applied Neuroscience, 10(1), 45-55. [DOI:10.1300/J184v10n01_04]
Vellutino, F. R., Fletcher, J. M., Snowling, M. J., & Scanlon, D. M. (2004). Specific reading disability (dyslexia): What have we learned in the past four decades? Journal of Child Psychology and Psychiatry, 45(1), 2-40. [PMID]
Ziegler, J. C. (2006). Do differences in brain activation challenge universal theories of dyslexia? Brain and Language, 98(3), 341-343. [DOI:10.1016/j.bandl.2005.05.002] [PMID]
Reading is a complex cognitive skill that serves a wide range of language and vision-related areas. Disruption of communication in this network is associated with evolutionary dyslexia (Hallahan, et al., 2005). Dyslexia is a term used mainly by neurologists; but teachers call it reading problems (Walker & Norman, 2006). There are several definitions of dyslexia; according to the definition of the fifth diagnostic and statistical classification (Association, 2013), dyslexia is a pattern of learning disorder characterized by poor speech recognition, poor coding, and poor spelling, which is not due to sensory impairment, low intelligence, or inadequate educational experience. Dyslexia occurs in all groups of children regardless of gender, social group, mental level, and geographical area (Schlaggar & McCandliss, 2007). Papagiannopoulou and Lagopoulos (2016) believed that dyslexia is a neurodevelopmental disorder with an unknown cause that affects 4-7% of the population.
“Causation” is one of the most important challenges in the field of learning disabilities. Over the past three decades, the neurological approach has taken more seriously the weaknesses of children with dyslexia. According to this approach, the occurrence of this disorder is due to the malfunctions of the nervous system, especially the central nervous system (Temple, 2002).
Due to recent advances in imaging (magnetic resonance imaging, positron emission neurosurgery, functional magnetic resonance imaging, and regional blood flow) as well as neurophysiology (recall potentials, quantitative electroencephalogram (QEEG), coherence studies, and magnetic resonance imaging), today, researchers are able to look at the normal circuits involved in reading and the differences between people who have difficulty learning to read (Abdeldayem & Selim, 2005). The results of several studies on dyslexics (Casanova, et al., 2004; Meyler et al., 2007; Shaywitz et al., 2004) have shown that these individuals have poor performance in the temporomandibular region. There is a positive linear relationship between reading ability and brain activity in the left temporal lobes and lower parietal areas in the right lobe, which means that the activity of these areas also increases following the ability to read. On the other hand, other studies (Ferrer, et al., 2010; Shaywitz et al., 2002) have shown that children with dyslexia have problems with their nervous systems; it is associated with dysfunction in the anterior cerebral cortex, parietal temporal lobes, and posterior parietal cortex. Also, the dysfunction of the left temporal lobe of the left temporal forehead was associated with impaired phonological awareness, speech perception, and direct access to speech (Vandermosten, Boets, et al., 2012). Based on evidence (Galaburda, Sherman, et al., 1985; Plante, et al, 1996; Rumsey, et al., 1994) on functional imaging in the field of reading development, defects in specific areas of the brain, such as planimetric symmetry or poor functional angular torture, are associated with dyslexia. Based on neurological studies (Lyon, et al., 2003; Meyler et al., 2007; Shaywitz & Shaywitz, 2007; Spironelli, et al., 2008) forehead areas, parietal forehead, temporal forehead, cortex hippocampus and right hemisphere thalamus, left angular gyrus, and left temporal lobe are some of the areas that have dysfunction in dyslexic people.
One of the tools for measuring the level of brain activity is the recording of brain waves by an electroencephalographic device invented to examine the function of the brain (not the structure of the banana). So far, several studies have been done to identify the pattern of brain waves in dyslexic people. Scarlar et al. (1995, Cited in Abdeldayem & Selim, 2005) found that the EEG activity of dyslexic individuals had a significant difference in the higher power of tetanus band activity in dyslexics. Arns et al. (Arns, et al., 2007) also confirmed this result. The results showed that in the dyslexic group, more slow wave activity (delta and theta) was observed in temporal and cerebral regions of the brain and beta 1 activity increased, especially in the F7 region., Coherence (EEG correlation) in the anterior, central, and temporal regions also increased for all frequency bands. The weakening of beta strength in the central and bilateral areas in children with dyslexia has also been reported by Gallin et al. (1986; cited in Papagiannopoulou and Lagopoulos, 2016). The difference between the beta and delta waves has been confirmed in at least two studies (Lavidor, et al., 2006; Ziegler, 2006). In one study, Fadzal et al. (2012) identified the EEG signals of dyslexic and normal children in two modes: rest and writing words and processed, analyzed, and compared them. Four electrodes C3, C4, P3, and P4 were used to record EEG signals. The recorded EEG signals were filtered using a bandwidth filter with a frequency range of 8 Hz. Analysis of EEG signals showed that the frequency range of EEG signals during writing at each electrode position at a lower beta band frequency is much larger for dyslexic children than for normal reading children. The frequency range of EEG signals was 20 to 28 Hz for dyslexic children and 14 to 22 Hz for normal children. It is also reported an increase in alpha strength in the left hemisphere of temporal areas as well as the left ventricular areas of dyslexics (Breteler, et al., 2010). On the other hand, Butler et al. (2010) stated that a significant increase in alpha coherence may be indicative of attention processes that improve reading (Breteler, et al., 2010).
There are anatomical studies (Galaburda, et al.,2000), which have shown the absence of the usual left-right hemisphere asymmetry of the planum temporale in dyslexia or suggested a possible role of the left inferior frontal gyrus in speech perception and rapid auditory processing, as well as in phonological aspects of reading (Habib, 2000), although no strong effects have been reported (Habib, 2000). Eckert et al. (2003) found anatomical anomalies underlying the double-deficit subtype of dyslexia. Their findings suggest that impairments in a frontal-cerebellar network may play a role in delayed reading development in dyslexia.
To study the neural factors of dyslexia, functional neuroimaging has been used. However, there is not much evidence with respect to developmental dyslexia since this research has focused on (young) adults (Habib, 2000). Only Shaywitz and Shaywitz (Shaywitz & et al., 2002; Shaywitz & Shaywitz, 2005) used children in their neuroimaging studies in order to examine the neural systems for reading during the acquisition of literacy. These reports show a failure of the left hemisphere posterior brain systems to function properly during reading (Shaywitz & Shaywitz, 2002; Shaywitz & Shaywitz, 2005). The majority of studies show increased activation in the basal surface of the temporal lobe, the posterior portion of the superior and middle temporal gyri, extending into temporoparietal areas and the inferior frontal lobe during tasks requiring reading and phonological processing (Vellutino,2004). Shaywitz et al. (2002) supported these findings; however, they show evidence of right hemisphere activation in the posterior temporal parietal regions. This could reflect compensatory processes or indicate that other nonlinguistic factors are related to reading disability (Shaywitz & Shaywitz, 2002; Shaywitz & Shaywitz, 2005; Vellutino,2004).
Undoubtedly, the researcher’s efforts have paved the way for the identification of the neuropsychological foundations of dyslexia. But most of this research seems to have neglected attention to dyslexia as a heterogeneous disability. As Sophie and Rico (2002, cited by Hill & Fiurlo, 1961) have suggested, the notion of these children as a “common group by reading” may inadvertently lead to a lack of recognition of learning disabilities, possibly due to referral biases. Different diagnoses result from the tools used. These necessitate more detailed work to identify the relationships of the neuroscientific, physiological, and functional nerves between the types of dyslexia that can lead to more effective interventions for these children ( Spring, 2001, quoted in Hill & Fiurlo, 1961). Significance of the Attention Deficit Hyperactivity Disorder (ADHD) was emphasized by Walker and Norman (2006), Breteler, et al. (2010), Penolazzi et al. (2008), Arns, et al. (2007), Papagiannopoulou and Lagopoulos (2016), and Fadzal et al. (2012).
Accordingly, the present study aimed to identify the pattern of brain waves in dyslexic subgroups. For this purpose, one of the known divisions, namely the division of dyslexics into two subconscious and linguistic subgroups, has been used. This classification is provided by Bakker (1992) and his model Brasan for normal reading growth as well as an explanation of dyslexia. According to this model, known as the Treadmill Baker Model, primary learning is created primarily by the right hemisphere of the brain, while final reading should normally be controlled by the left hemisphere of the brain (Bakker, 1992). According to the equilibrium model, reading disorders occur when a hemisphere change occurs to control reading deviations (Dryer, et al., 1999).
Baker classified dyslexic readers into two categories: type P or perceptual, type L, or linguistic. Type P or perceptual dyslexia occurs when a person in the dominant use of the right hemisphere reading strategy is unable to shift to the production of left-wing strategies in the advanced reading stages. Accordingly, the reader continues to focus on the perceptual features of the text, leading to a precise but relatively slow and divided reading; these types of people make a lot of time-consuming mistakes, such as repetition and self-correction. Another subcategory, language type or L-type dyslexia, occurs when a person relies largely on the language strategies of the left hemisphere in the early stages of reading development. Model L has malfunctions and is used by fast readers, but incorrect, and also has many nominal errors, such as deletion, addition, and replacement (Dryer, et al., 1999).
In the present study, in order to identify the neural dysfunction pattern in the mentioned subgroups of dyslexia (only type L and type P), quantitative electroencephalography (QEEG) dyslexia was used to answer what is the difference between the three groups of dyslexic, perceptual, and normal students in reading each other to examine the pattern of cerebral waves?
2. Materials and Methods
Sample
The present study is a comparative cause in terms of the data collection method. The statistical population included all students in grades one to five who were illiterate in special centers for learning disabilities and normal students who were studying at Birjand primary school in the academic year 2018-19. Targeted sampling was used to select perceptual (P) and language (L) dyslexic students. In this study, of the 27 subjects studied, 24 cases (equivalent to 9.88%) were boys and three cases (equivalent to 1.11%) were girls. According to the information obtained from the educational level, six people (equivalent to 3.22%) in the first grade, eight people (equivalent to 6.29%) in the second grade, ten people (equivalent to 37%) in the third grade, two people (equivalent to 4.7%) in The fourth grade, and one person (equivalent to 7.3%) were studying in the fifth grade.
Instrument
To collect information about the physical and mental condition of students, the Questionnaire developed by Tabrizi in 2012 was used (Tabrizi, 2010). This questionnaire contains 11 paragraphs that include the following information: general information, birth, pregnancy, neurodevelopmental stages, physical health, family, child behavioral problems, educational problems, and the child’s self-concept. This questionnaire is completed by the mother.
The Wechsler test of this scale was developed by Wechsler (1969) to measure children’s intelligence. The Wechsler Intelligence Test is one of the most authoritative and widely used tests for assessing children’s intelligence (Marnat, 1996). The validity of this test has been reported through the two-half method to be 0.97 for general intelligence, 0.97 for verbal intelligence, and 0.93 for practical intelligence Tabrizi, 2010. In this study, its Persian form by Shahim (1994) was used to measure the intelligence of normalized children aged 6 to 13 years. The validity of this test has been reported through the two-factor model to be 0.94 for general intelligence and 0.96 for non-verbal intelligence. Also, the correlation of the test with academic achievement and retraining rate was reported to be 0.88 and 0.85, respectively (Shahim, 1994).
Disorders in reading and reading comprehension tests were used to identify and isolate dyslexic students. This test includes 11 Persian texts, each written on a card. Card number one is a practice card and the results are not taken into account in the calculations. Two to 11 cards are the main cards and both cards belong to the same base. In this way, the ability to read, understand, and read the speed of students in each grade is measured by two texts.
The validity of the structure of the test in reading accuracy for pair cards (story text at the relevant basic level) was between 0.6 and 0.9, and for individual cards (text of the relevant grade textbook) between 0.7 and 0.9, comprehension. Content for even cards is between 0.3 and 0.6 and for individual cards is between 0.3 and 0.5. The reading speed for even and odd cards fluctuated between 0.8 and 0.9 separately. All coefficients were significant at the P<0.100 level. In order to calculate the reliability of the test, two methods of Cronbach’s alpha and parallel were used. Cronbach’s alpha for reading accuracy in pair cards was 0.9 and in individual cards was 0.8. The reading comprehension score was 0.8 for even cards, 0.7 for individual cards, 0.9 for reading speed for even cards, and 0.8 for individual cards. Parallel validity in couple and individual cards in reading accuracy, comprehension, and reading speed was 0.9 for all (Hosseinilor, et al., 2005).
A small amount of electroencephalography was used in this study to record the brain waves of the target groups using the Mitsar amplifier, during which a special cap was placed on the patient’s head. From 19 head area F3, F7, Fp2, Fp1, O2, O1, T6, P4, PZ, P3, T5, T4, C4, CZ, C3, T3, F8, F4, and FZ waves were recorded.
The power was calculated in the following frequency bands: delta (1-4 Hz), theta (4-8 Hz), alpha (8-12 Hz), and beta (12-25 Hz).
The brain waves were recorded in a quiet room in both open and closed-eye conditions for 6 minutes at a sampling rate of 500 Hz. The mean left and right ear electrodes (E1 and E2) were used as reference electrodes. Vienna EEG software was used to record brain waves and NeuroGuide™ software was used to analyze brain waves.
To process brain signals, first, the brain signals in NeuroGuide software were filtered by a 1-40 Hz midpoint filter. Then, in NeuroGuide software, parts of the signal with a motion artifact, the noise of eye movements, and the noise of nerve stimulation of the muscle were manually deleted. Then, the power was calculated in the following frequency bands: delta (1-4 Hz), theta (4-8 Hz), alpha (8-12 Hz), and beta (12-25 Hz), and extracted and analyzed with the help of this software.
Design
Using this method, the city center of learning disorders was first referred to. Then, a list of students with reading disorders from first to fifth grade was provided to the researcher. In the next step, the parents of each of these students were contacted and invited to participate in the research. Poor-e-Etemad test was performed on dyslexic students who were willing to cooperate. According to the analysis of errors in this test, students whose basic errors were of the type of deletion and addition of the word, inversion, displacement, etc. under the linguistic group and students whose basic errors were mainly self-correction, repetition and pause were placed in the perceptual group. Since the study group in the present study was normal students in reading, an available sampling method was used to select this sample. For this purpose, a boys’ school willing to cooperate was selected. Then, ten students in the first to fifth grade were selected who, according to their teachers, were normal in reading, and in addition were willing to cooperate with the research. The criteria for entering this group other than (obtaining a low score on the diagnostic test) were similar to the criteria for dyslexic students. The mentioned groups were age equivalent. Inclusion criteria in this study included normal IQ (95-110), the age range of 7-11 years, primary school education, lack of history of mental disorders, brain injury, neurological, sensory and motor problems, and reading problems related to emotional disorders.
The subjects were asked first to stare at a fixed point, while they were in a calm condition and minimize blinking and extra movements of their head, hands, and feet, and recording was done when the eyes were open for 6 minutes. After 3 to 5 minutes of break, the students were asked to return to the previously mentioned conditions and close their eyes. In closed-eye mode, the recording time was 6 minutes for each child. Then, all the encrypted information was stored separately in a folder for each person. Due to the small number of dependent variables (absolute and relative power of the waves) and the structure of the hypotheses and questions considered in the research, multivariate analysis of variance (MANOVA) and one-way analysis of variance (ANOVA) were used. It should be noted that data analysis was performed using NeuroGuide, SPSS software, version 25, STATA software, version 16, MATLAB software, and Excel version 2010.
3. Results
Comparison of the absolute power of brain waves of study groups in closed-eye mode
Based on the findings of one-way ANOVA and the Bonferroni test, a correction (0.05÷4=0.0125) was observed in all the brain locations considered; the difference in the absolute average power of the brain wave in the three study groups was not significant at P<0.05. It should be noted that if the Bonfroni test was ignored, in the FP2 brain location, the assumption of the equality of the absolute power averages of the delta wave was rejected (F(2, 13.679)=4.502, P=0.031). According to the Hughes Games follow-up test, the difference in the mean of the absolute power of the linguistic and normal groups in reading was significant (P=0.023).
In order to confirm the previous content, according to Figure 1, it is clear that considering the Bonferroni test, p-values resulting from the univariate ANOVA for all locations and brain waves were above the line 0.125 (blue line). Ignoring the univariate correction, it is observed that in the FP2 brain location, a significant value corresponding to the delta wave was below the 0.05 line (red line).
Comparison of the absolute power of brain waves of study groups in open-eye mode
Based on the findings of the univariate ANOVA and considering the Bonferroni test (0.05÷0.04=0.0125), in all brain locations considered, sufficient reasons were found to reject the assumption of the equality of absolute brain power averages in three study groups at P<0.05. According to Figure 2, it is clear that by considering the buffering correction, the P obtained from the one-way ANOVA for all locations and brain waves are above the line of 0.125 (blue line).
Comparison of the relative power of brain waves in study groups
In the open and closed eye modes for each of the delta, theta, and beta waves, there was no significant difference between the study groups in terms of relative power. Also, based on the results obtained for the relative powers of the alpha wave in open and closed eyes, in the open-eye mode, there was no significant difference between the study groups, but in the closed-eye mode, there was a significant difference for some brain locations between study groups. Therefore, the output and tables related to delta, theta, and beta waves in open-eye and closed-eye modes and alpha wave in the open-eye mode were omitted, and only the details related to alpha wave in the closed-eye mode were expressed.
According to Figure 3, for all brain locations, the mean relative power of the alpha wave in the normal reading group was higher than in other study groups.
Therefore, the significance of the differences was investigated. For this purpose, first, the natural power distribution of alpha wave was investigated using the Shapiro-Wilk test. In order to facilitate the study of significant values obtained from Shapiro-Wilk tests, these values are plotted in Figure 4.
According to the findings of Figure 4, it was observed that for the FP1 brain location, the assumption of the natural distribution of the relative power of the alpha wave in the linguistic (SW(10)=0.802, P=0.015) and perceptual (SW(8)=0.790, P=0.022) groups was rejected. For FP2 brain location, the assumption of normal distribution of alpha wave relative power in linguistic (SW(10)=0.808, p=0.018<0.05) and perceptual (SW(8)=0.736, p=0.008<0.05) groups became significant. Also, for F7 (SW(8)=0.768, p=0.013) and CZ (SW(8)=0.763, p=0.011) brain locations in the perceptual group, the hypothesis of normal distribution of alpha wave relative power was rejected. In addition, for the P3 sites in the normal reading group (SW(9)=0.790, p=0.016), the PZ in the linguistic (SW(10)=0.822, p=0.027) and normal reading groups (SW(9)=0.745, p=0.005) were assumed the medical distribution of the relative strength of the alpha wave. For F8 brain location in the groups, the assumption of the natural distribution of the relative power of the alpha wave in the linguistic (SW(10)=0.839, p=0.042) and perceptual (SW(8)=0.796, p=0.026) groups was significant.
Then, for each of the brain locations where all study groups had normal distribution, univariate ANOVA and for other locations, the non-parametric Kruskal-Wallis test was used to compare the relative powers of alpha wave in the closed eye state. The specific output of Levene’s test and univariate ANOVA is separated by brain locations.
According to the findings of Levene’s test, in all considered brain locations, there were not enough reasons to reject the assumption of homogeneity of the alpha wave relative power variances in the three study groups at the level of P<0.05. In addition, based on the output of univariate one-way ANOVA and regardless of the Bonferroni test, no significant difference was found at the level of P<0.05 for each of the brain locations between study groups in terms of the relative power of an alpha wave in the blindfold. The output of the Kruskal-Wallis non-parametric test for brain locations was Cz, F8, F7, FP2, FP1, P3, and Pz.
According to Table 2, it was observed that in each of the FP1 (SW(2)=6.685, P=0.035) and FP2 (SW(2)=8.056, P=0.018) brain locations, the assumption of the same alpha wave power distribution in the study groups was rejected. Nonparametric pairwise comparisons were used to identify groups with different distributions. It should be noted that in this table, in order to control a type I error of 0.05, adjusted significant values were used.
According to Table 3 for the FP1 location, there was a significant difference in the relative power distribution of the alpha wave in the closed state between the linguistic and normal reading groups (P=0.030). Similarly, for the FP2 locus, the assumption that the relative power distribution of the alpha wave was the same in the closed-eye state between the linguistic and normal reading groups was rejected (P=0.014). According to the mean scores provided, it was observed that in each of the brain locations FP1 and FP2, the relative power of the alpha wave in the blindfold mode for the normal group in reading was higher than the linguistic group.
4. Discussion
The aim of this study was to compare the brain wave patterns of dyslexic students in perceptual type, language type, and normal reading. In this study, no significant difference was observed in the two states of closed and open eyes in absolute power, but a significant difference was observed in the relative power of an alpha wave in two channels Fp1 and Fp2. Thus, in the FP1 and FP2 brain locations, the relative power of the alpha wave in the blindfold mode was higher for the normal reading group than for the linguistic group.
Arns et al. (2007) compared the pattern of brain wave activity in the two groups of dyslexic and normal non-adult years. For this reason, their results were compared with the present study and showed the differences and similarities, in which accuracy can lead to valuable points.
Difference
According to the research by Arns et al. (2007) in the delta wave of F7, Fp2, Fp1, and T6 regions and theta wave of Fp2, Fp1 and F7 regions, there was a difference in dyslexic and normal students, but in the present study, there was a difference in absolute wave power. Different age groups in the two studies may play a role in the difference in results. While in the study of Arns et al. (2007), the age range of the sample was between 8 and 16 years, in the present study, the age of the subjects was between 7 and 11 years.
Similarities
According to the research by Arns et al. (2007), Fp1 and Fp2 are two areas, in which dyslexics and normal people in reading show differences in the activity of waves (delta and theta). The importance of these two areas of the brain was also shown in the present research. The results of the present study showed that the relative power of the alpha wave in the closed state in the two channels Fp1 and Fp2 for the linguistic group was less than the normal group in reading. Before discussing the findings of the study, it is necessary to explain the alpha wave and the function of the prefrontal cortex.
In the study conducted by Çiçek and Nalçacı (2001) on right-handed subjects, they concluded that the alpha wavelength increased at rest and the left frontal lip alpha decreased significantly during cognitive tasks. In justification of this finding, it was stated that with an increasing alpha wave, the amount of cortical arousal decreases, thus reducing the processing of data related to unnecessary external stimuli, and such a strategy makes the subject focused on the main test and thus performance optimally increases.
An important part of the frontal lobe is the “prefrontal cortex”, which is located in front of the motor cortex (Santrak, 2003). From the perspective of neuropsychology (Brocki & Bohlin, 2004; Thorell, et al., 2009) executive functions are associated with the prefrontal cortex of the brain and include the highest cognitive functions necessary for purposeful behavior. Some neuroscientists consider the prefrontal cortex to be an executive function because it is involved in reviewing and organizing thinking (Owen, 1997, quoted in Santrak, 2003). Neurological executive functions are important structures that are related to the psychological processes responsible for controlling consciousness and thinking in action. These functions regulate behavioral outputs and usually include inhibition and control of stimuli, working memory, sustained attention, planning, and organization (Denckla, 2003). As mentioned, one of the most important executive functions is response deterrence and sustained attention. Response inhibition is the ability to think before acting. This skill provides the ability to assess posture and behavior before surgery (Dawson & Guare, 2004). Students whose frontal lobe (the area that plays a key role in attention and inhibition) is damaged are easily distracted by unrelated stimuli and therefore often cannot follow certain instructions (Santrak, 2003).
Based on the Barclay Barkley (1997) inhibition model, it is assumed that the proper functioning of executive functions depends on the proper functioning of inhibition in the frontal lobe and forehead (Alizadeh & Zahedipour, 2004). Behavioral inhibition patterns involved in the impairment of function affect the four basic executive functions, including working memory, internal speech, reconstruction, and self-regulation of motivation and excitement, resulting in impaired self-control function (Barkley, 1997).
5. Conclusion
Executive functions have been at the heart of recent theories of the neuropsychological risk of children at risk of disability; especially for students with learning disabilities (reading, dictation, and math) and students with ADHD. Impairment of behavioral inhibition and poor control can impede effective self-management, and impulsive behaviors are a manifestation of such a situation (Alizadeh & Zahedipour, 2004).
An important point in the present study is the existence of common characteristics between dyslexic and hyperactive students; one of the common features of these two groups is weakness in executive functions (Masterpasqua & Healey, 2003). Will Cut et al. (2000; quoted by Moradi, et al., 2014) stated that dyslexia is widely associated with ADHD. According to research by Clarke et al. (2002), students with ADHD have more theta ratio and lower alpha lineage in brain waves. Therefore, dyslexic students with hyperactivity may be part of the linguistic subgroup; this statement needs to be further researched in this field.
This study was associated with limitations, such as the low number of dyslexic girls and the age limit of subjects. Therefore, it is recommended that brain scans be performed on girls at different age intervals. Research suggestions include conducting similar studies using larger samples for higher reproducibility, using task reading during EEG recording of dyslexic students, and evaluating the effectiveness of neurofeedback in forearm areas (FP1 and FP2) to increase executive performance and thus improve language dysfunction.
Ethical Considerations
Compliance with ethical guidelines
All ethical principles were considered in this article.
Funding
This research did not receive any grant from funding agencies in the public, commercial, or non-profit sectors.
Authors' contributions
All authors equally contributed to preparing all parts of the research.
Conflict of interest
The authors declare no conflict of interest.
Acknowledgments
We would like thank the Vice Chancellor of Research of Birjand University.
Reference
Abdeldayem, H., & Selim, O. (2005). Neuropsychological assessment and EEG evaluation of dyslexic children. The International Journal of Child Neuropsychiatry, 2(2), 155-162. [Link]
Alizadeh, H., & Zahedipour, M. (2004). [Executive functions in children with and without developmental coordination disorder (Persian)]. Advances in Cognitive Science, 6(3), 49-56. [Link]
Arns, M., Peters, S., Breteler, R., & Verhoeven, L. (2007). Different brain activation patterns in dyslexic children: Evidence from EEG power and coherence patterns for the double-deficit theory of dyslexia. Journal of Integrative Neuroscience, 6(01), 175-190. [DOI:10.1142/S0219635207001404] [PMID]
American Psychiatric Association. (2013). Diagnostic and statistical manual of mental disorders (DSM-5®). Virginia : American Psychiatric Association. [DOI:10.1176/appi.books.9780890425596]
Bakker, D. J. (1992). Neuropsychological classification and treatment of dyslexia. Journal of Learning Disabilities, 25(2), 102-109. [DOI:10.1177/002221949202500203] [PMID]
Barkley, R. A. (1997). ADHD and the nature of self-control. New York: The Guilford Press. [Link]
Barkley, R. A. (2011). The important role of executive functioning and self-regulation in ADHD. Journal of Child Neuropsy, 113(21), 41-56. [Link]
Breteler, M. H., Arns, M., Peters, S., Giepmans, I., & Verhoeven, L. (2010). Improvements in spelling after QEEG-based neurofeedback in dyslexia: A randomized controlled treatment study. Applied Psychophysiology and Biofeedback, 35(1), 5-11. [DOI:10.1007/s10484-009-9105-2] [PMID] [PMCID]
Brocki, K. C., & Bohlin, G. (2004). Executive functions in children aged 6 to 13: A dimensional and developmental study. Developmental Neuropsychology, 26(2), 571-593. [DOI:10.1207/s15326942dn2602_3] [PMID]
Casanova, M. F., Araque, J., Giedd, J., & Rumsey, J. M. (2004). Reduced brain size and gyrification in the brains of dyslexic patients. Journal of Child Neurology, 19(4), 275-281. [DOI:10.1177/088307380401900407] [PMID]
Çiçek, M., & Nalçacı, E. (2001). Interhemispheric asymmetry of EEG alpha activity at rest and during the Wisconsin Card Sorting Test: Relations with performance. Biological Psychology, 58(1), 75-88. [DOI:10.1016/S0301-0511(01)00103-X] [PMID]
Clarke, A. R., Barry, R. J., McCarthy, R., & Selikowitz, M. (2002). EEG analysis of children with attention-deficit/hyperactivity disorder and comorbid reading disabilities. Journal of Learning Disabilities, 35(3), 276-285. [DOI:10.1177/002221940203500309] [PMID]
Dawson, P., & Guare, R. (2018). Executive skills in children and adolescents: A practical guide to assessment and intervention. New York City: Guilford Publications. [Link]
Denckla M. (2003). ADHD: Topic update. Brain and Development, 25(6), 383-389. [DOI:10.1016/S0387-7604(03)00057-3] [PMID]
Dryer, R., Beale, I. L., & Lambert, A. J. (1999). The balance model of dyslexia and remedial training: An evaluative study. Journal of Learning Disabilities, 32(2), 174-186. [DOI:10.1177/002221949903200207] [PMID]
Eckert, M. A., Leonard, C. M., Richards, T. L., Aylward, E. H., Thomson, J., & Berninger, V. W. (2003). Anatomical correlates of dyslexia: Frontal and cerebellar findings. Brain, 126(Pt 2), 482–494. [DOI:10.1093/brain/awg026] [PMID]
Fadzal, C. C. W., Mansor, W., Lee, K. Y., Mohamad, S., Mohamad, N., & Amirin, S. (2012). Comparison between characteristics of EEG signal generated from dyslexic and normal children. Paper presented at: 2012 IEEE-EMBS Conference on Biomedical Engineering and Sciences, Langkawi, Malaysia, 17-19 December 2012. [DOI:10.1109/IECBES.2012.6498210]
Ferrer, E., Shaywitz, B. A., Holahan, J. M., Marchione, K., & Shaywitz, S. E. (2010). Uncoupling of reading and IQ over time: Empirical evidence for a definition of dyslexia. Psychological Science, 21(1), 93-101. [DOI:10.1177/0956797609354084] [PMID]
Galaburda, A. M., Sherman, G. F., Rosen, G. D., Aboitiz, F., & Geschwind, N. (1985). Developmental dyslexia: Four consecutive patients with cortical anomalies. Annals of Neurology, 18(2), 222-233. [DOI:10.1002/ana.410180210] [PMID]
Hallahan, D. P. (2005). Learning disabilities foundations, characteristics, and effective teaching. London: Pearson. [Link]
Habib, M. (2000). The neurological basis of developmental dyslexia: An overview and working hypothesis. Brain, 123(Pt 12), 2373-2399. [DOI:10.1093/brain/123.12.2373] [PMID]
Hill, J. B., & Fiurlo, K. A. (1961). Psychological neurosis in school. Tehran: Arjmand Publications.
Hosseinilor, F., Pouretemad, H., & Heidari, M. (2005). [Comparison of phonological skills in two subgroups of perceptual and linguistic (Persian)]. Advances in Cognitive Science, 7(3), 25-35. [Link]
Lavidor, M., Johnston, R., & Snowling, M. J. (2006). When phonology fails: Orthographic neighbourhood effects in dyslexia. Brain and Language, 96(3), 318-329. [DOI:10.1016/j.bandl.2005.06.009] [PMID]
Lyon, G. R., Shaywitz, S. E., & Shaywitz, B. A. (2003). A definition of dyslexia. Annals of Dyslexia, 53(1), 1-14. [DOI:10.1007/s11881-003-0001-9]
Masterpasqua, F., & Healey, K. N. (2003). Neurofeedback in Psychological Practice. Professional Psychology: Research and Practice, 34(6), 652-656. [DOI:10.1037/0735-7028.34.6.652]
Meyler, A., Keller, T. A., Cherkassky, V. L., Lee, D., Hoeft, F., & Whitfield-Gabrieli, S., et al. (2007). Brain activation during sentence comprehension among good and poor readers. Cerebral Cortex, 17(12), 2780-2787. [PMID] [PMCID]
Moradi, M. R., Faramarzi, S., & Abedi, A. (2014). The effectiveness of phonological games on reading performance of dyslexic male students. Knowledge and Research in Applied Psychology, 15(1), 44-51. [Link]
Papagiannopoulou, E. A., & Lagopoulos, J. (2016). Resting state EEG hemispheric power asymmetry in children with dyslexia. Frontiers in Pediatrics, 4, 11. [PMID] [PMCID]
Penolazzi, B., Spironelli, C., & Angrilli, A. (2008). Delta EEG activity as a marker of dysfunctional linguistic processing in developmental dyslexia. Psychophysiology, 45(6), 1025-1033. [DOI:10.1111/j.1469-8986.2008.00709.x] [PMID]
Plante, E., Boliek, C., Binkiewicz, A., & Erly, W. K. (1996). Elevated androgen, brain development and language/learning disabilities in children with congenital adrenal hyperplasia. Developmental Medicine & Child Neurology, 38(5), 423-437. [DOI:10.1111/j.1469-8749.1996.tb15100.x] [PMID]
Rumsey, J. M., Andreason, P., Zametkin, A. J., Aquino, T., King, A. C., & Hamburger, S. D., et al. (1994). Failure to activate the left temporoparietal cortex in dyslexia: An oxygen 15 positron emission tomographic study. Archives of Neurology, 49(5), 527-534. [Link]
Santrak, J. W. (2003). Psychology. New York: McGraw-Hill. [Link]
Schlaggar, B. L., & McCandliss, B. D. (2007). Development of neural systems for reading. Annual Review of Neuroscience, 30, 475–503. [DOI:10.1146/annurev.neuro.28.061604.135645] [PMID]
Shahim, S. (1994). Application of Wechsler Intelligence Scale for Children in Iran. Journal of Psychological Research, 1(3-4), 32.
Shaywitz, B. A., Shaywitz, S. E., Blachman, B. A., Pugh, K. R., Fulbright, R. K., & Skudlarski, P., et al. (2004). Development of left occipitotemporal systems for skilled reading in children after a phonologically-based intervention. Biological Psychiatry, 55(9), 926-933. [DOI:10.1016/j.biopsych.2003.12.019] [PMID]
Shaywitz, B. A., Shaywitz, S. E., Pugh, K. R., Mencl, W. E., Fulbright, R. K., & Skudlarski, P., et al. (2002). Disruption of posterior brain systems for reading in children with developmental dyslexia. Biological Psychiatry, 52(2), 101-110. [DOI:10.1016/s0006-3223(02)01365-3] [PMID]
Shaywitz, S. E., & Shaywitz, B. A. (2007). The neurobiology of reading and dyslexia. The ASHA Leader, 12(12), 20-21. [DOI:10.1044/leader.FTR7.12122007.20]
Shaywitz, S. E., & Shaywitz, B. A. (2005). Dyslexia (specific reading disability). Biological Psychiatry, 57(11), 1301-1309. [DOI:10.1016/j.biopsych.2005.01.043] [PMID]
Spironelli, C., Penolazzi, B., & Angrilli, A. (2008). Dysfunctional hemispheric asymmetry of theta and beta EEG activity during linguistic tasks in developmental dyslexia. Biological Psychology, 77(2), 123-131. [DOI:10.1016/j.biopsycho.2007.09.009] [PMID]
Tabrizi, M. (2010). [Treatment of reading disorders (Persian)]. Tehran: Faravan Publications.
Temple, E. (2002). Brain mechanisms in normal and dyslexic readers. Current Opinion in Neurobiology, 12(2), 178-183. [DOI:10.1016/S0959-4388(02)00303-3] [PMID]
Thorell, L. B., Lindqvist, S., Bergman Nutley, S., Bohlin, G., & Klingberg, T. (2009). Training and transfer effects of executive functions in preschool children. Developmental Science, 12(1), 106-113. [DOI:10.1111/j.1467-7687.2008.00745.x] [PMID]
Vandermosten, M., Boets, B., Wouters, J., & Ghesquière, P. (2012). A qualitative and quantitative review of diffusion tensor imaging studies in reading and dyslexia. Neuroscience & Biobehavioral Reviews, 36(6), 1532-1552. [DOI:10.1016/j.neubiorev.2012.04.002] [PMID]
Walker, J. E., & Norman, C. A. (2006). The neurophysiology of dyslexia: A selective review with implications for neurofeedback remediation and results of treatment in twelve consecutive patients. Journal of Neurotherapy: Investigations in Neuromodulation, Neurofeedback and Applied Neuroscience, 10(1), 45-55. [DOI:10.1300/J184v10n01_04]
Vellutino, F. R., Fletcher, J. M., Snowling, M. J., & Scanlon, D. M. (2004). Specific reading disability (dyslexia): What have we learned in the past four decades? Journal of Child Psychology and Psychiatry, 45(1), 2-40. [PMID]
Ziegler, J. C. (2006). Do differences in brain activation challenge universal theories of dyslexia? Brain and Language, 98(3), 341-343. [DOI:10.1016/j.bandl.2005.05.002] [PMID]
Type of Study: Original |
Subject:
Cognitive Neuroscience
Received: 2020/12/17 | Accepted: 2021/12/1 | Published: 2023/01/12
Received: 2020/12/17 | Accepted: 2021/12/1 | Published: 2023/01/12
Send email to the article author
| Rights and permissions | |
 |
This work is licensed under a Creative Commons Attribution-NonCommercial 4.0 International License. |
![]()
Copyright © The Author(s);
This is an open access article distributed under the terms of the Creative Commons Attribution License (CC-By-NC), which permits use, distribution, and reproduction in any medium, provided the original work is properly cited and is not used for commercial purposes.
Contact Information
