

Volume 16, Issue 2 (March & April 2025)
BCN 2025, 16(2): 403-416 |
Back to browse issues page


Download citation:
BibTeX | RIS | EndNote | Medlars | ProCite | Reference Manager | RefWorks
Send citation to:


BibTeX | RIS | EndNote | Medlars | ProCite | Reference Manager | RefWorks
Send citation to:
Haddadzade Niri H, Rahbar N, Pourbakht A, Haghani H. Auditory Efferent System Influencing the Auditory Overshoot Phenomenon: An Auditory Brainstem Response Study in Guinea Pigs. BCN 2025; 16 (2) :403-416
URL: http://bcn.iums.ac.ir/article-1-1558-en.html
URL: http://bcn.iums.ac.ir/article-1-1558-en.html


1- Department of Audiology, Rehabilitation Research Center, School of Rehabilitation Sciences, Iran University of Medical Sciences, Tehran, Iran.
2- School of Management and Medical Information & Health Sciences, Iran University of Medical Sciences, Tehran, Iran.
2- School of Management and Medical Information & Health Sciences, Iran University of Medical Sciences, Tehran, Iran.
Keywords: Auditory efferent nerve (AEN), Auditory brainstem response (ABR), Overshoot, Temporal effect, Delay onset time (DOTs), Latency
Full-Text [PDF 852 kb]
| Abstract (HTML)
Full-Text:
1. Introduction
The caudal auditory efferent system, or the olivocochlear nerve bundle, is a descending pathway that originates in the brainstem and ends in the organ of Corti of the cochlea. It was identified over 70 years ago (Rasmussen, 1946). A lot of research was conducted on its anatomy and functions thereafter (Brown, 1987; Liberman, 1980; Warr et al., 1997; Warr & Guinan, 1979). The anti-masking (Liberman & Guinan, 1998), protection against loud noise (Cody & Johnstone, 1982; Handrock & Zeisberg, 1982; Liberman & Gao, 1995; Rajan, 1990), auditory and visual attention (Guinan, 2018; Igarashi et al., 1974; Oatman, 1976; Scharf et al., 1997), and auditory development are among the roles attributed to this system (Walsh et al., 1998). Despite much research on the characteristics of efferent nerves, many functional aspects of this system have remained unclear.
Several psychoacoustical studies have been carried out on the effect of perception in noise. In the last theories about the functioning of olivocochlear nerves, a phenomenon called auditory overshoot has been discussed. It is used to study the effects of background noise on everyday hearing. The investigation of auditory overshoot may help understand the ability to hear a brief sound in background noise. It is known as a temporal auditory effect (Bacon, 1990; Hicks & Bacon, 1991; Schmidt & Zwicker, 1991; von Klitzing & Kohlrausch, 1994) that depends on the timing between the onset of the signal and the masker noise, called delay onset time (DOT). When a listener must detect a brief tonal signal presented in a longer masking noise and the onset of the signal is slightly delayed from the onset of the masker, the behavioral detectability of the signal becomes easier (Chatterjee & Smith, 1993). It was shown that this phenomenon can also be recorded in the auditory brainstem (Chatterjee & Smith, 1993; Haddadzade et al., 2021). We realized overshoot in our previous study that the latencies of ABR’s waves, especially the first waves, decrease, and the amplitude increases when DOT increases. Classic firing rate adaptation and medial olivocochlear feedback (Jennings et al., 2011) are proposed physiological overshoot mechanisms. Some basic characteristics of overshoot are obligatory consequences of cochlear function, as modulated by the olivocochlear efferent system (McFadden et al., 2010). For the subjects showing overshoot, detectability remained approximately constant for at least 20-30 ms of signal delay, and then, detectability gradually improved toward its maximum (McFadden et al., 2010).
In guinea pigs, the discharge peak of the AENs in ipsilateral and contralateral neurons is 20- 40 and 25- 45 ms, respectively (Brown, 1989). It was compatible with the time course that the auditory overshoot observed. Therefore, we aimed to prove the effect of efferent systems on overshoot by extending the previous auditory brainstem response (ABR) study on different DOTs within and out of the discharge peak of AENs by dissecting the nerves. The cochlear efferent innervation in guinea pigs is carried in the inferior and superior vestibular nerves at entry into the medial bulla (Littman et al., 1991). Therefore, we sectioned both right inferior and superior vestibular nerves at the point of entry into the internal acoustic canal and then examined ABR by using the low-frequency tone burst compared to the high-frequency tone burst at 0, 30, 60, and 100 ms DOTs before and after the interruption.
A convenient tool for confirming the section of the AENs is the immunohistochemical staining for acetylcholinesterase (ACHE). Cholinesterase was confined to the spiral ganglion and organ of Corti. The efferent nerve sectioning in guinea pigs’ brainstem level significantly reduces cholinesterase-positive structures within the cochlea.
Our study aimed to investigate the effect of the AENs function on the auditory electrophysiological overshoot and introduce an objective tool to examine one of the AENs’ performances.
2. Materials and Methods
Study animals
Sixteen two-month-old male Albino guinea pigs (250-350 g) were purchased from the Pasteur Institute (Tehran, Iran). The animals were housed in cages with free access to water and food in a temperature-controlled room (20–25 °C) with a 12 h light/dark cycle. The present study used a checklist of working with laboratory animals approved by the Ministry of Health and Medical Education. Before surgery, the animals were kept for three days to adapt to the new living environment. The guinea pigs were randomly divided into two groups: The first group (cases) sectioning the AENs and the second group (control) just exposing the nerves (n=8, each).
Study procedure
ABR recording
The animals were anesthetized with an IP injection of the mixture of ketamine (40 mg/kg body weight) and xylazine (4 mg/kg body weight). Ketamine was repeated half dose during surgery if needed. The ABR was recorded using a Biologic Navigator Pro AEP (USA). The inverting needle electrode was set on the vertex, the non-inverting on the right, and the common on the left mastoid. The impedance difference between electrodes was kept at less than 3 kΩ. The animals were placed in a double-walled, sound-proofed booth throughout the ABR recording. The body temperature was measured during surgery and testing with a digital thermometer and controlled with a heating pad. The threshold was defined as the minimum level at which wave III could be repeatedly detected and disappear at 5 dB less. Subjects with a threshold within ±1 SD of the lab’s normal range were included for further data gathering. The threshold was measured again after the completion of surgical procedures. If the threshold shifted more than 10 dB, that animal was excluded from the study. To evaluate auditory overshoot, the ABR was recorded using the noise level fixed at 60 dB PeSPL (decibel Peak Equivalent Sound Pressure Level) and the signal level modulated for the 5 SNRs (0, +5, +10, +15, +20 dB) and the four DOTs (0, 30, 60, 100 ms) at 8 and 16 kHz. The stimuli (noise and signal) were combined by Cool Edit Pro (version 2.1) and presented to the right ear at 45° to the head of the animal by the speaker (ONKYO DWASK001, Korea). The other ear was blocked. To control the effect of noise, the waves achieved by noise and signal were subtracted from those with noise alone; then, the absolute latencies of waves I and III for the four DOTs and each SNRs at two different frequencies were determined pre-surgery and post-surgery.
Surgery approach
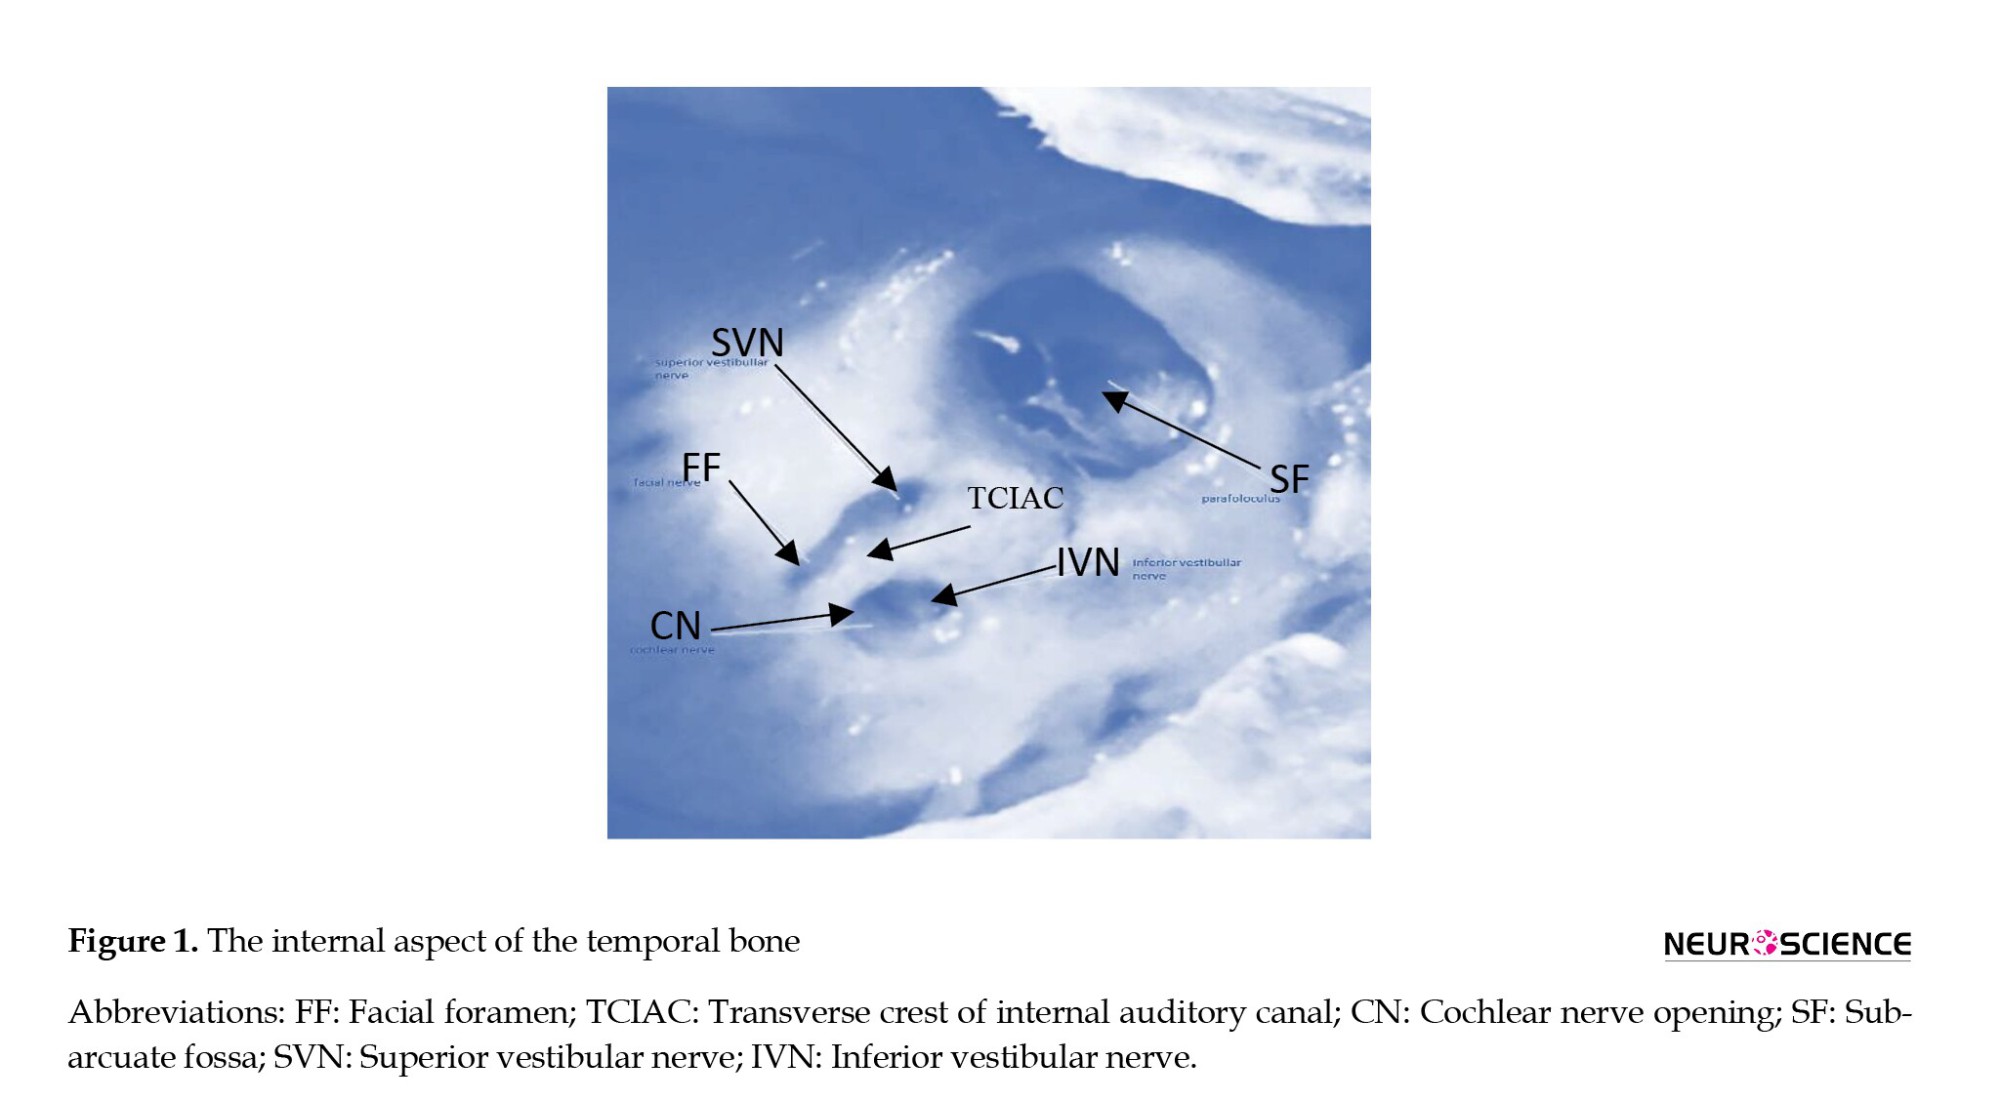
In the case group, AENs were sectioned. In the control group, the nerves were exposed; however, they were kept healthy. A tracheotomy was performed, and the animal was ventilated with room air. Epinephrine is administered to reduce blood pressure at the point of surgery in the skull. A posterior craniotomy was performed by drilling a tinny hole into the skull at the intraparietal triangle on the right side. The bone was removed from the parietal crest and moved to the right temporal line using a small clamp. The dura was opened, the cerebellum was retracted medially using small pieces of moistened cotton, and para-flocculus was aspirated. The brain stem was then retracted medially, and the cochlear vestibular and facial nerves were exposed at the medial aspect of the right bulla. The inferior and posterior vestibular nerves were transected by a stapes hook, and the cochlear and facial nerves and arteries were maintained. Figure 1 schematically illustrates the relative location of the nerves of interest. Animals underwent the surgical procedure up to exposure of the nerves without transection (control). After surgery, the dura was closed using small pieces of moistened cotton, and the scalp incision was sutured. The animal was monitored for 3 to 6 hours and allowed to recover. Once awake, pain was controlled with acetaminophen (10 mg/kg). Tetracycline was given orally (415 mg/L) via drinking water for 5 to 7 days following surgery.
Immunohistochemical staining
Twenty days after the surgery, the animals were sacrificed. Both bullae were removed and fixed with 10% formalin, and the cochleae were stained for cholinesterase using the envision immunohistochemical (IHC) staining technique. The primary antibody for IHC was anti-acetylcholinesterase antibody ab31276 (Santa Cruz production). Slides were prepared from the first and second turns of the guinea pig cochlea because of the higher density of efferent innervation in this region (Smith, 1961; Smith & Rasmussen, 1965; Wright & Preston, 1973). The changes in staining after vestibular nerve transection were observed via light microscopy.
Stimuli and recording parameters
Specific parameters were adopted to record the overshoot electro-physiologically. We applied a 16 and 8 kHz tone burst stimulus and wideband noise for the signal and noise, respectively. The signals with different DOTs were compared to the noise. The signal (the ABR stimulus) was presented simultaneously with the noise onset, 30 ms and 60 ms after noise onset and immediately after the completion of the noise. The signal included five tone burst complexes with a 5 ms duration and a 1 ms rise/fall time. For each tone burst at 16 and 8 kHz, 11 ms interstimulus intervals were considered to overcome the minimal nerve response recovery time. The duration of the noise was 100 ms (0.1-8 kHz). The signal and noise intensity level was set at 60 dB PeSPL.
The gain to ABR recordings was set as 100000, and 250 stimuli were used for averaging. The high-pass and low-pass filters were 100-3000 Hz, and the time window was 10 ms. The stimuli intensity (signal and noise) was calibrated with a 2250 L sound level meter (B&K) at 5 cm from the speaker. The speaker covered high-frequency sounds of up to 20 kHz.
Statistical analysis
Statistical analysis was performed in SPSS software, version 19 (USA). All data had a normal distribution (P>0.05). The statistical significance was tested using global linear models. Tukey one-way analysis of variance (ANOVA) analysis was conducted for each ABR to analyze the calculated latency of waves I and III to the subtracted waves across the factors of time delay (4 conditions) and SNR (5 conditions) as within-subject variables. A pairwise comparison was conducted using Bonferroni analysis of the significant effects. The significance level was 0.05 for all statistical analyses.
3. Results
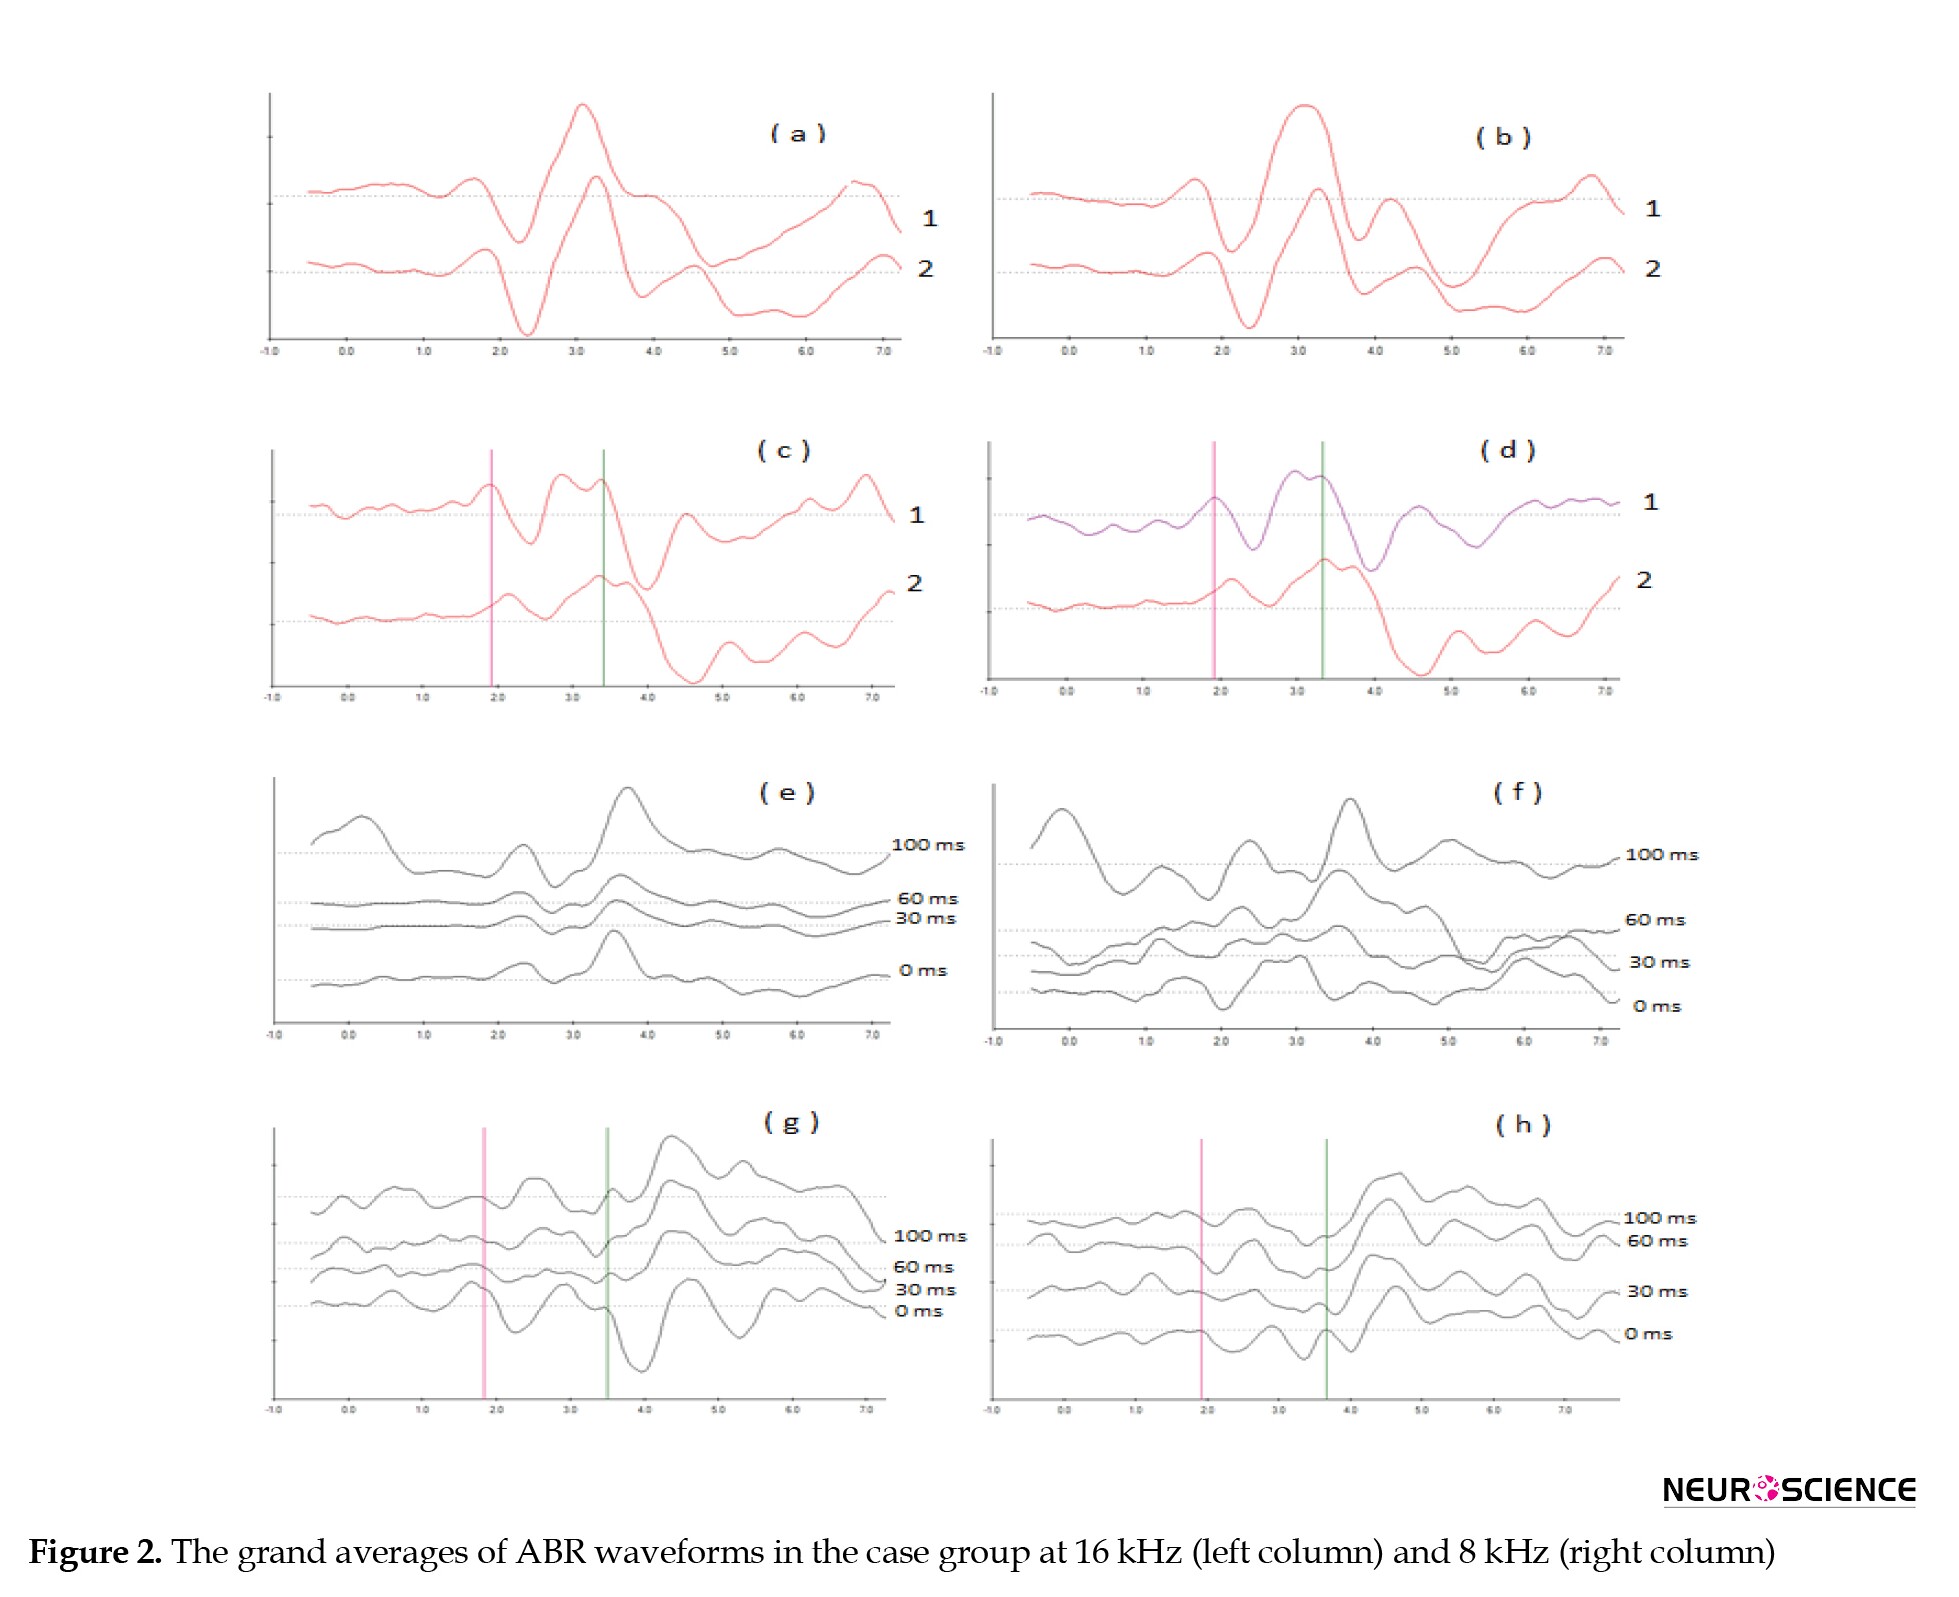
In our previous study on the electrophysiological overshoot, changes in latency of subtracted ABR waves, especially at the first waves, showed an overshoot phenomenon. Therefore, we measured and compared the latencies of subtracted waves I and III in both groups before and after surgery for both stimuli separately under the different stimuli conditions. Figure 2 shows the grand averages of ABR waveforms in the case group at 16 kHz (left column) and 8 kHz (right column).
Since data displayed a normal distribution, we compared the latency waves I and III before and after the surgery at both groups and stimuli using Tukey one-way ANOVA statistical analysis. There were no significant changes between the control group before and after surgery and the case group before surgery (P>0.05). There were significant changes after surgery in the case group. Therefore, we reported the variables in the case group for both stimuli separately before and after the surgery.
Electrophysiological result (case group)
16-kHz stimulus
Data analysis in the case group showed significant changes between the latency waves I and III at 16 kHz before and after surgery (P<0.05).
Repeated measures analysis for absolute latency of subtracted wave I before and after the surgery separately showed a significant main effect for DOT (F3.0, 21.00=10.252; P<0.001; η2=0.893) and no significant main effect for SNR (F1.889, 13.226=0.08; P>0.05; η2=0.106) before surgery. There was also a significant interaction effect for DOT and SNR (F12.00, 84.00=0.174; P<0.05; η2=0.532) before surgery.
The main effect of Bonferroni analysis at absolute latency of subtracted wave I before surgery showed significant changes between the 0 ms and (30, 60) ms DOTs and the (30, 60) ms with 100 ms DOTS, respectively for 0, 5, and 10 dB SNRs (P<0.05). For the other SNRs (15, 20 dB), there were significant changes between the 0 ms and other DOTs (30, 60, and 100 ms) and between the (30, 60) ms and 100 ms, respectively (P<0.05). No significant changes between the 30 and 60 ms and between the 0 and 100 ms were observed for all SNRs (P>0.05).
Analysis of data with repeated measures for absolute latency of subtracted wave I before and after surgery separately showed a significant main effect for DOT (F3.0, 21.00=13.491; P<0.001; η2=0.927) and no significant main effect for SNR (F2.353, 16.471=0.025; P>0.05; η2=0.409) after surgery. There was also a significant interaction effect for DOT and SNR (F12.00, 84.00=0.302; P<0.05; η2=0.477) after the surgery.
The main effect (Bonferroni analysis) at absolute latency of subtracted wave I after surgery showed significant changes between the 0 ms and other DOTs for all of the SNRs (P<0.05), and there were no significant changes between the 30 ms and the (60, 100) ms DOTs separately (P>0.05).
Analysis of data with repeated measures for absolute latency of subtracted wave III before and after the surgery separately showed a significant main effect for DOT (F2.186, 15.304=6.522; P>0.005; η2=0.839) and a significant main effect for SNR (F4.00, 28.00=0.042; P>0.05; η2=0.512) before the surgery. There was also a significant interaction effect for DOT and SNR (F12.00, 84.00=0.333; P<0.05; η2=0.767) before the surgery.
The main effect (Bonferroni analysis) at absolute latency of subtracted wave III before the surgery showed no significant changes between the 0 ms and three other DOTs and between the 30 and 60 ms for the 0, 5, and 10 dB SNRs (P>0.05). There were significant changes between the (30, 60) ms and 100 ms DOTs (P<0.05). Significant changes between the 0 ms and (30, 60) ms DOT and the (30, 60) ms and 100 ms DOT were noticed (P<0.05). Also, there were no significant changes between the 0 ms and 100 ms DOT for the 15 and 20 dB SNRs (P>0.05).
Analysis of data with repeated measures for absolute latency of subtracted wave III before and after the surgery separately showed no significant main effect for DOT (F2.019, 21.00=16.484; P<0.001; η2=0.918) and not a significant main effect for SNR (F4.00, 24.00=0.020; P> 0.05; η2=0.148) after the surgery. There was also a significant interaction effect for DOT and SNR (F12.00, 84.0=0.388; P<0.05; η2=0.567) after the surgery.
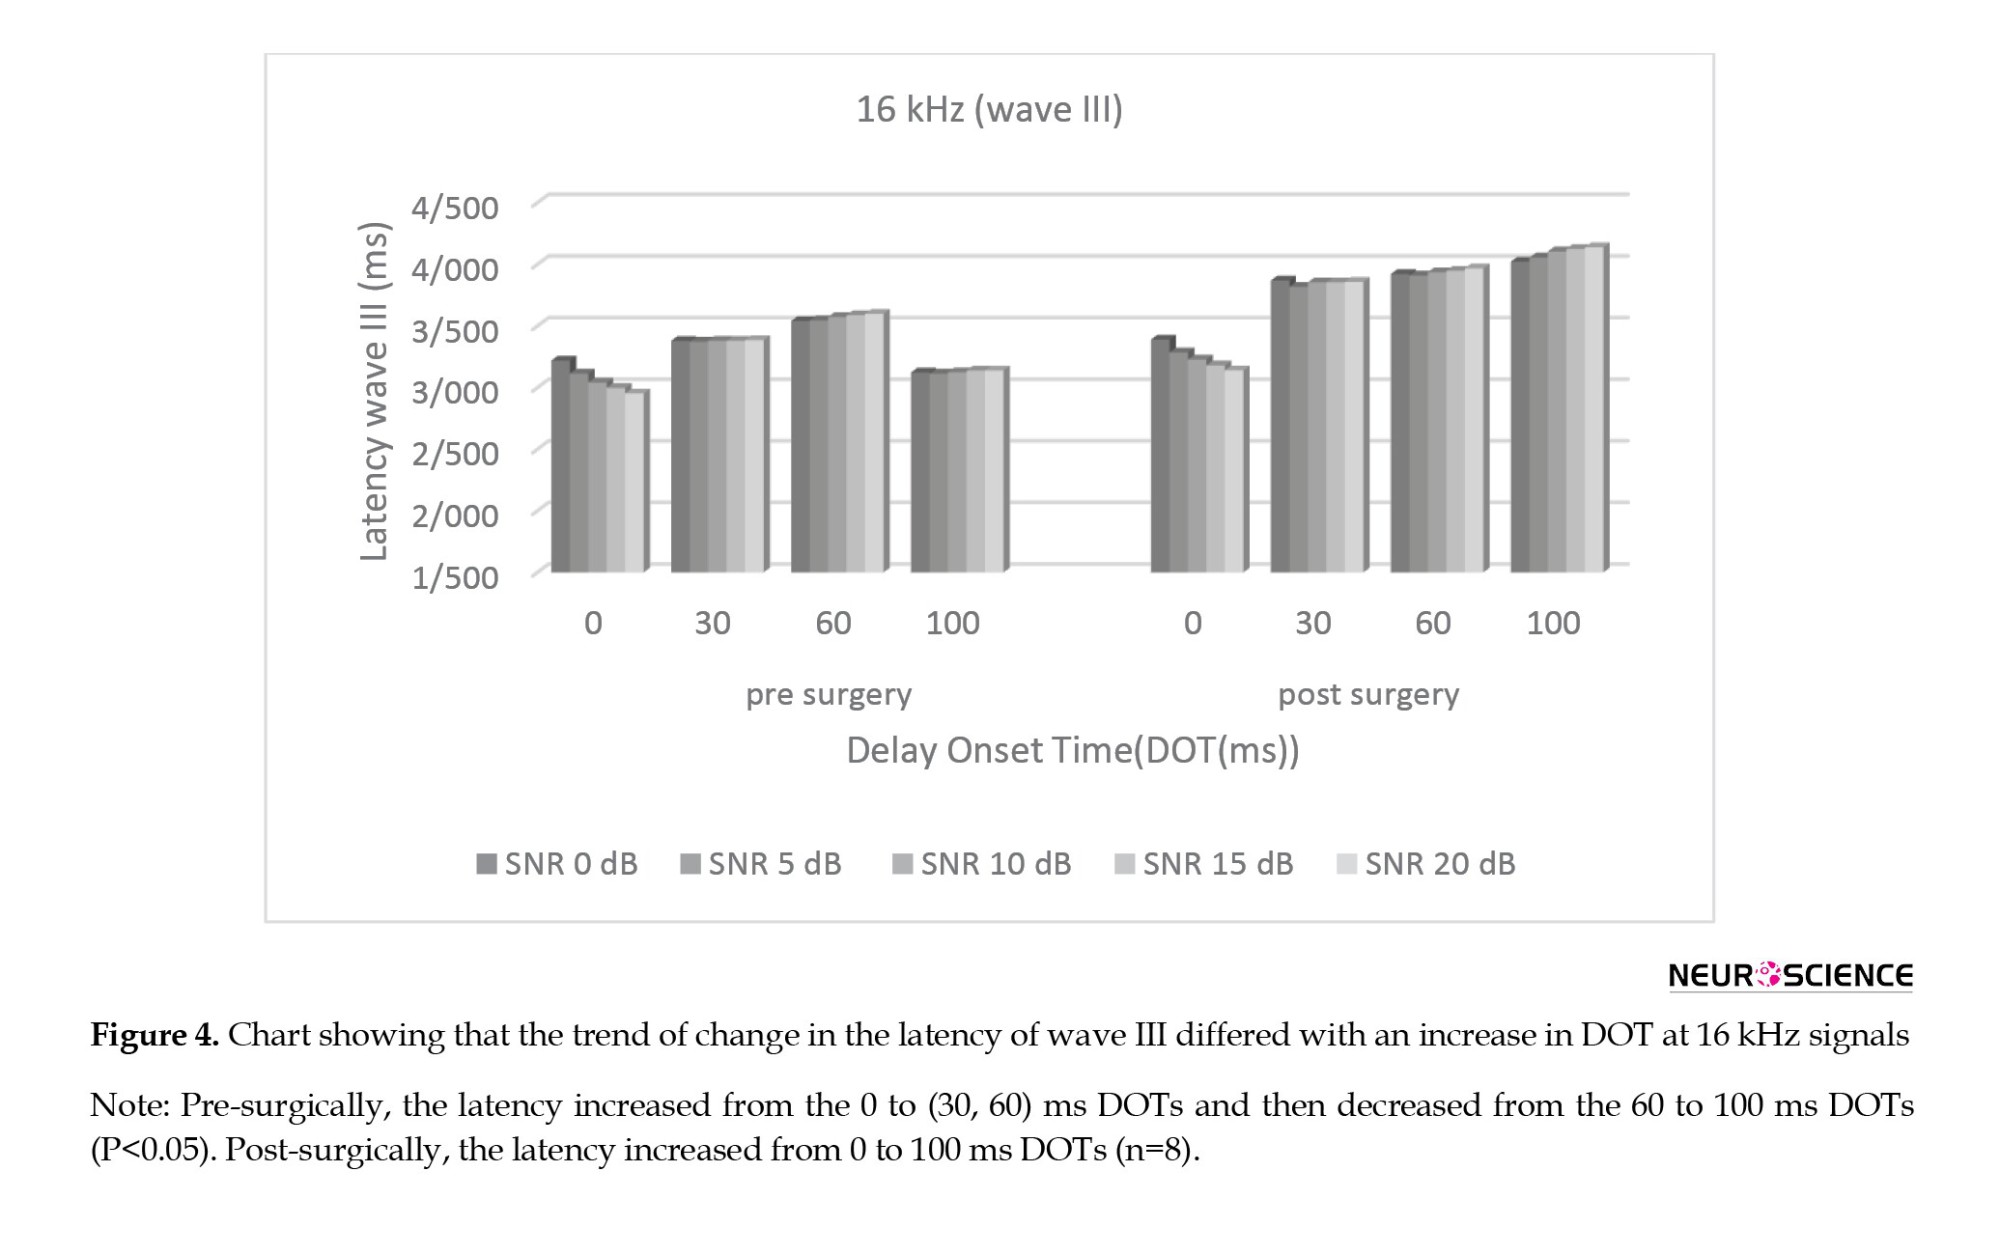
The main effect (Bonferroni analysis) at absolute latency of subtracted wave III after surgery showed that for all of the SNRs, there were significant changes between the 0 ms and other DOTs (P<0.05) and no significant changes between the 30 ms and the (60, 100) ms DOTs separately (P>0.05). Figure 4 shows the trend of change in the latency of wave III differed with an increase in DOT at 16 kHz signals
8-kHz stimulus
There were significant changes between the latency waves I and III at 8 kHz before and after the surgery in the case group (P<0.05). Analysis of data with repeated measures for absolute latency of subtracted wave I before and after the surgery separately showed a significant main effect for DOT (F3.0, 21.00=15.895; P<0.001; η2=0.827) and a significant main effect for SNR (F4.00, 28.00=0.214; P< 0.01; η2=0.411) before the surgery. There was also a significant interaction effect for DOT and SNR (F12.00, 84.00=0.764; P<0.05; η2=0.419) before the surgery.
The main effect (Bonferroni analysis) at absolute latency of subtracted wave I before the surgery showed significant changes between the 0 ms and other DOTs (P<0.05) for all of the SNRs. No significant changes between the 30 and 60 ms (P>0.05) and also no significant changes between the (30, 60 ms) and 100 ms DOTS, respectively (P>0.05) were found.
Analysis of data with repeated measures for absolute latency of subtracted wave I before and after the surgery showed a significant main effect for DOT
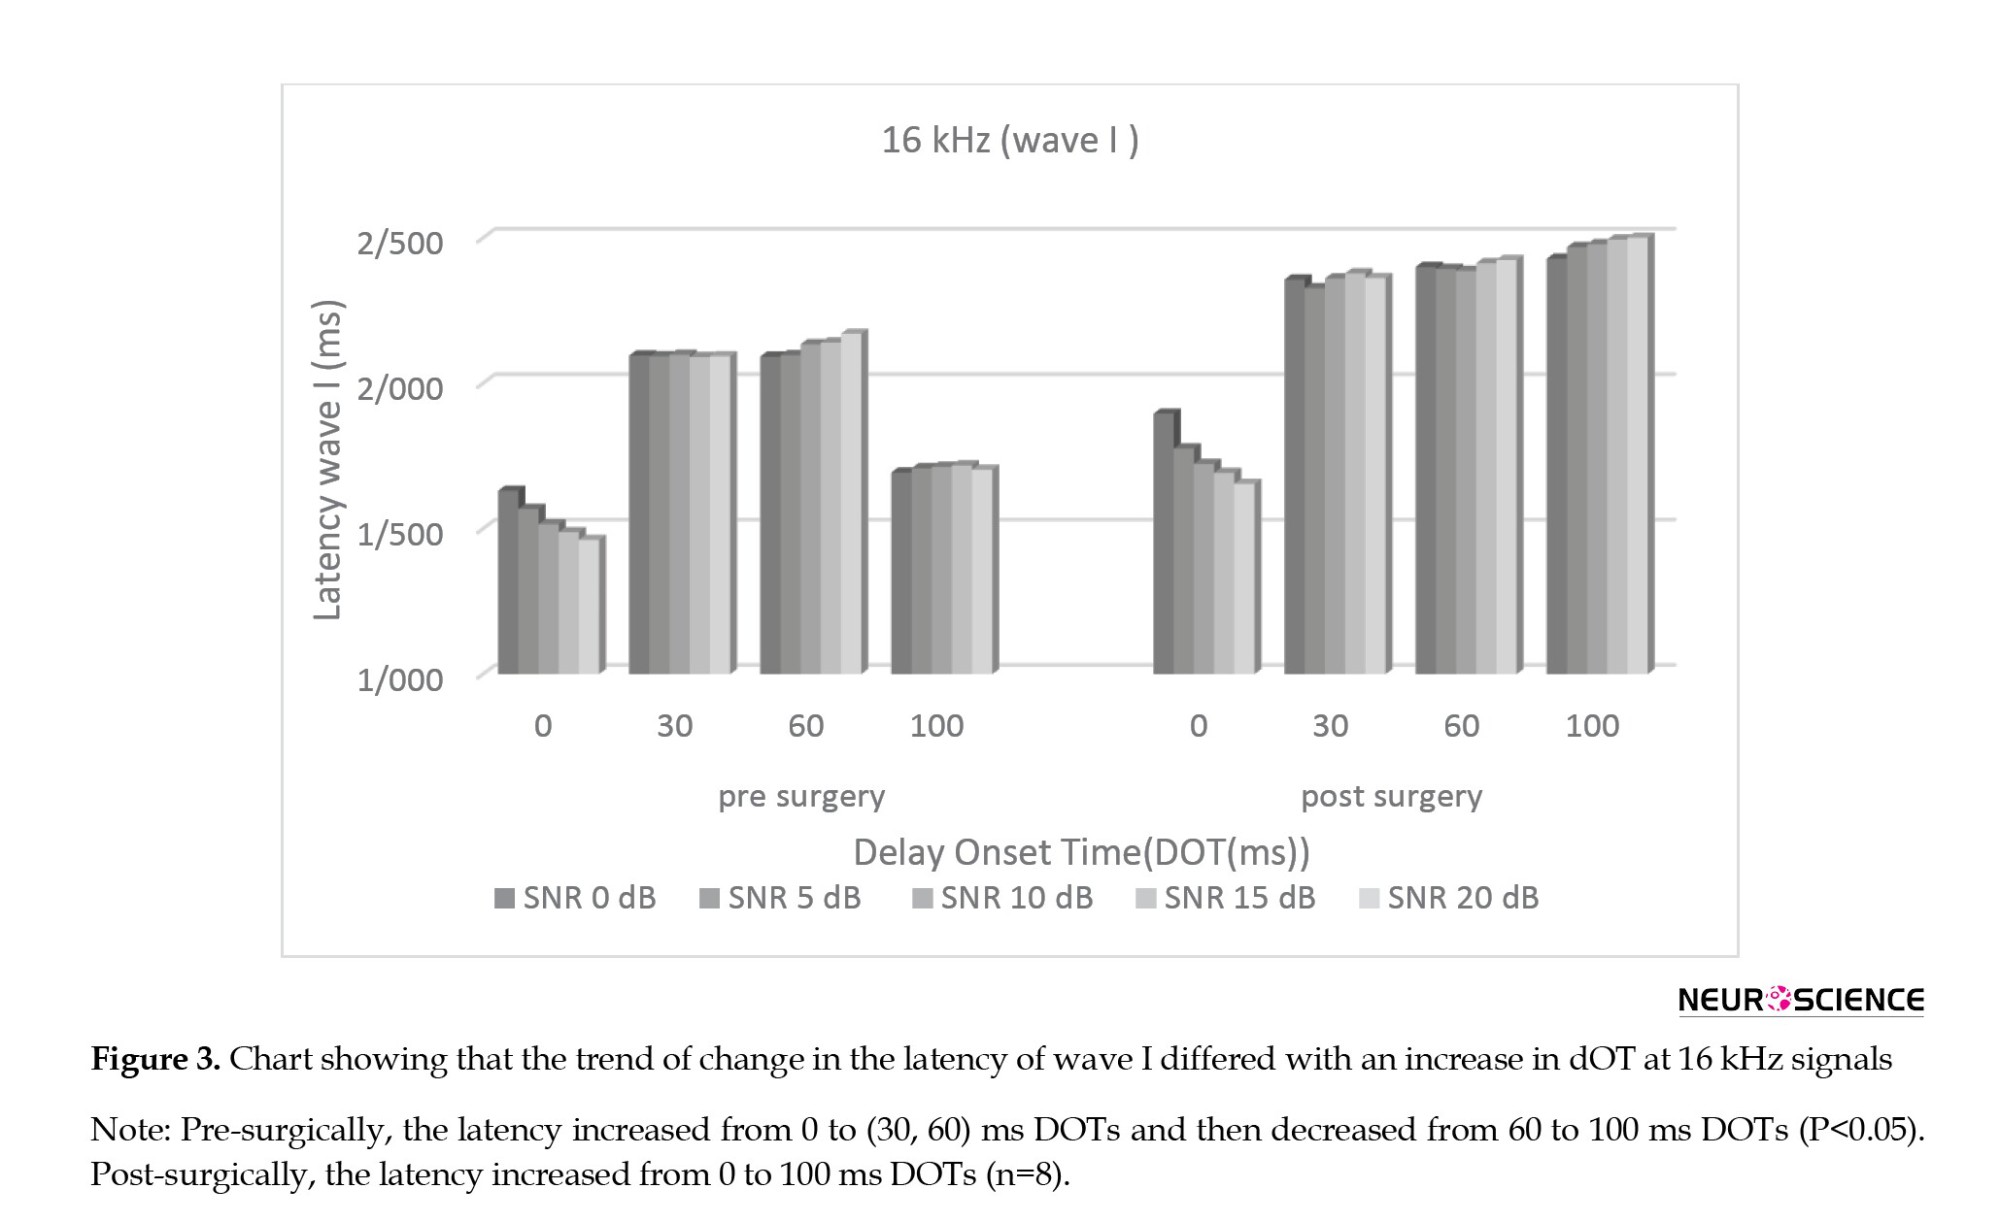
(F2.255, 21.00=13.737; P<0.001; η2=0.885) and no significant main effect for SNR (F1.916, 28.00=0.003; P>0.05; η2=0.026) after surgery. There was also a significant interaction effect for DOT and SNR (F12.00, 84.00=0.173; P<0.05; η2=0.292) after the surgery. Figure 3 shows the trend of change in the latency of wave I differed with an increase in dOT at 16 kHz signals.
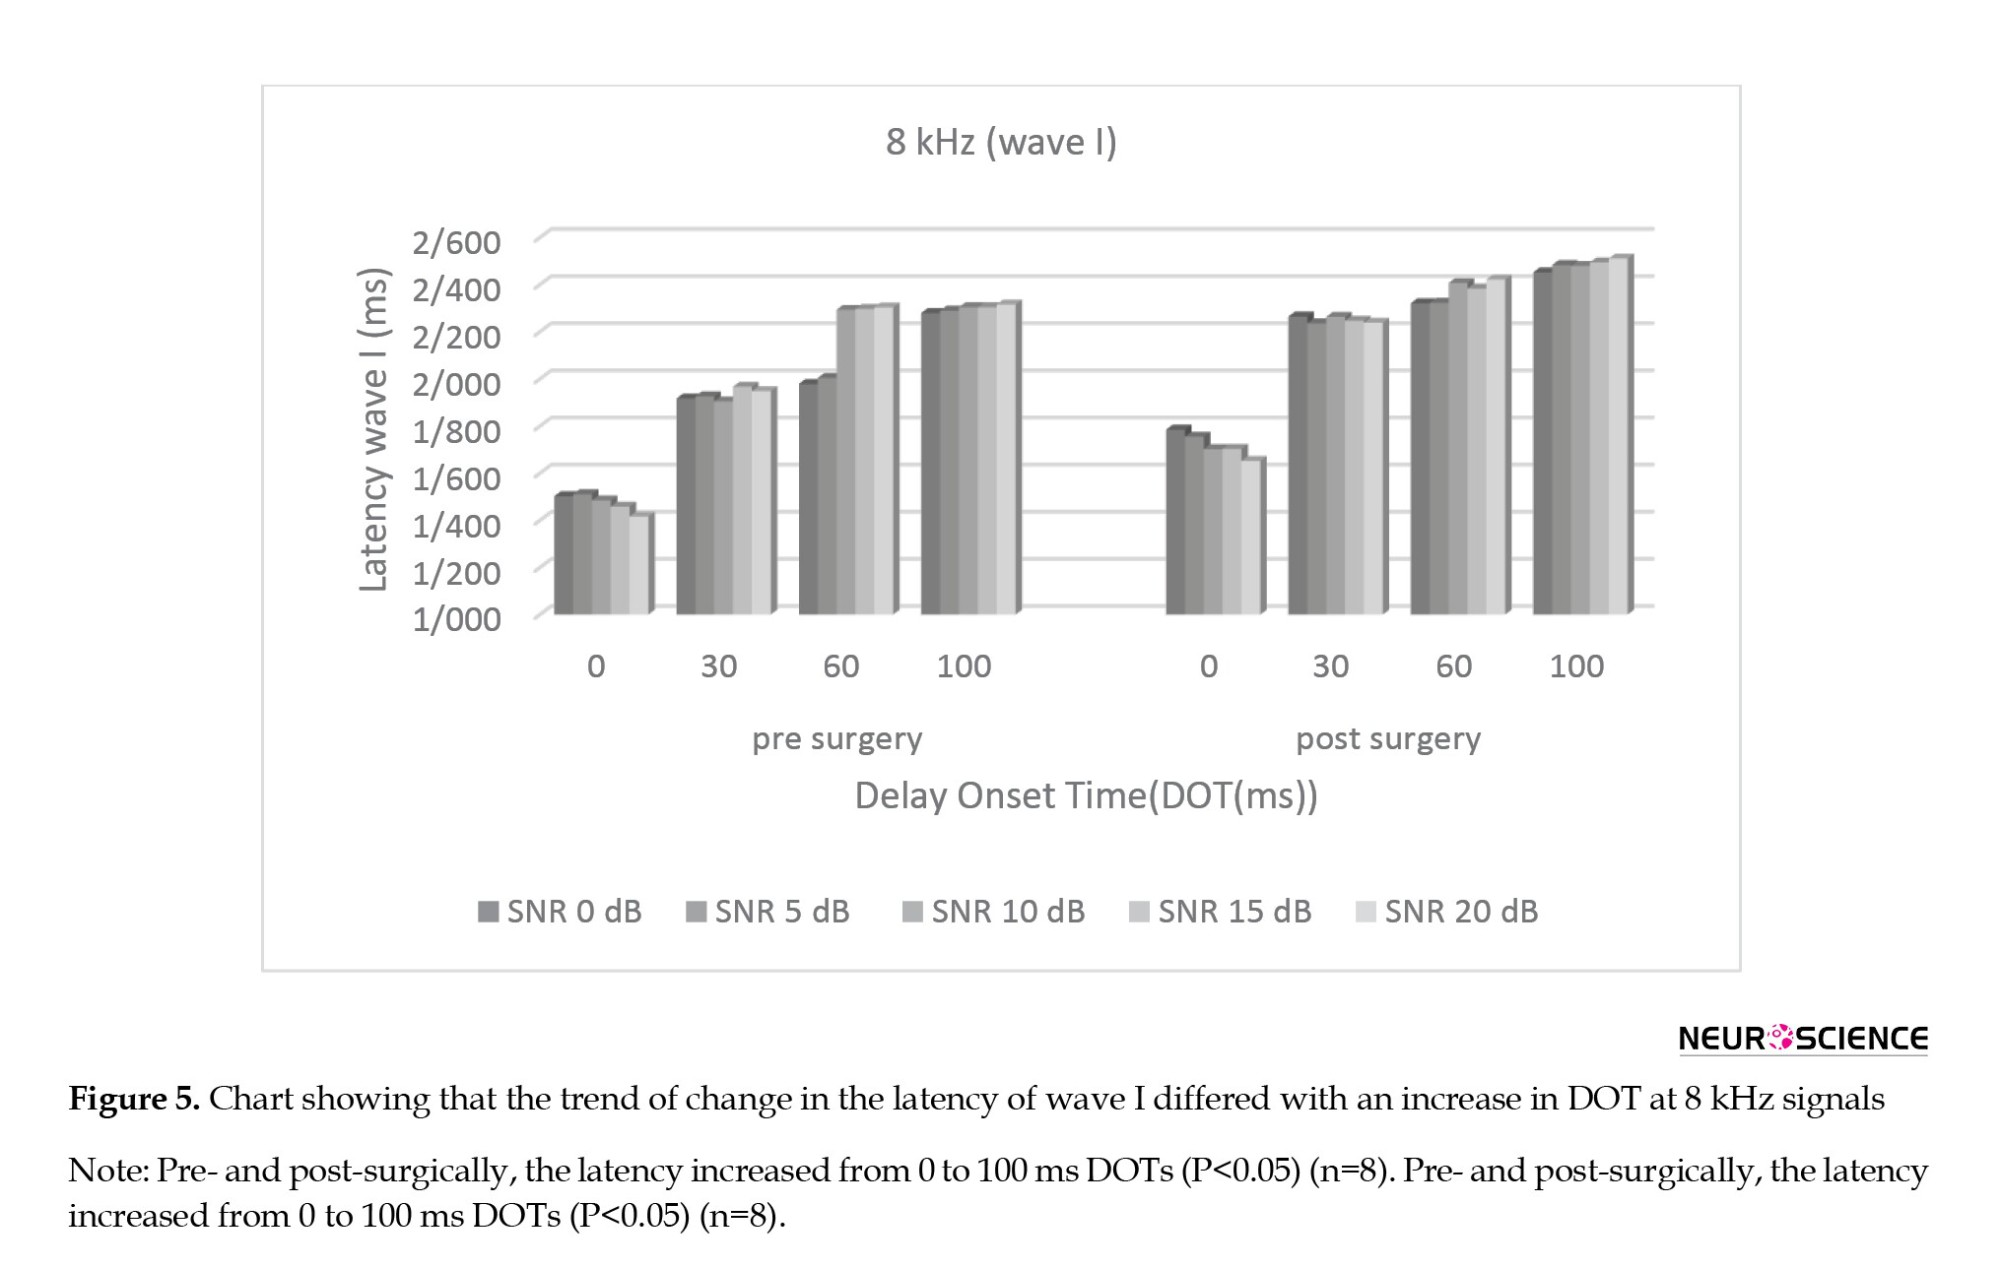
The main effect (Bonferroni analysis) at absolute latency of subtracted wave I after the surgery showed that for all SNRs, there were significant changes between the 0 ms and other DOTs (P<0.05) and no significant changes between the 30 ms and the (60, 100) ms DOTs, separately (P>0.05). Figure 5 shows the trend of change in the latency of wave I differed with an increase in DOT at 8 kHz signals
Repeated measures analysis for absolute latency of subtracted wave III before and after surgery separately revealed a significant main effect for DOT (F 3.00,21.00=14.754; P<0.001; η2=0.739) and no significant main effect for SNR (F2.179, 15.250=0.011; P>0.05; η2=0.180) before the surgery. There was also a significant interaction effect for DOT and SNR (F12.00, 84.00=0.229; P<0.05; η2=0.452) before the surgery.
The main effect (Bonferroni analysis) at absolute latency of subtracted wave III before the surgery determined that for the 0 dB SNR, there were no significant changes between the 0 ms and (30, 60 ms) DOTs (P>0.05) and significant changes between the 0 and 100 ms DOTs and between the (30, 60 ms) and 100 ms DOTs (P<0.05). No significant changes existed between the 0 and 30 ms DOTs for 5 dB SNR (P>0.05). For the other SNRs, there were significant changes between the 0 ms and other DOTs and also between the (30, 60 ms) and 100 ms DOTs (P<0.05). No significant changes occurred between the 30 and 60 ms DOT for all SNRs (P>0.05).
Analysis of data with repeated measures for absolute latency of subtracted wave III before and after the surgery separately showed no significant main effect for DOT (F3.00, 21.00=17.596; P<0.001; η2=0.860) and not a significant main effect for SNR (F4.00, 28.00=0.065; P>0.05; η2=0.129) after the surgery. DOT and SNR also had a significant interaction effect (F12.00, 84.00=0.446; P<0.05; η2=0.258) after the surgery.
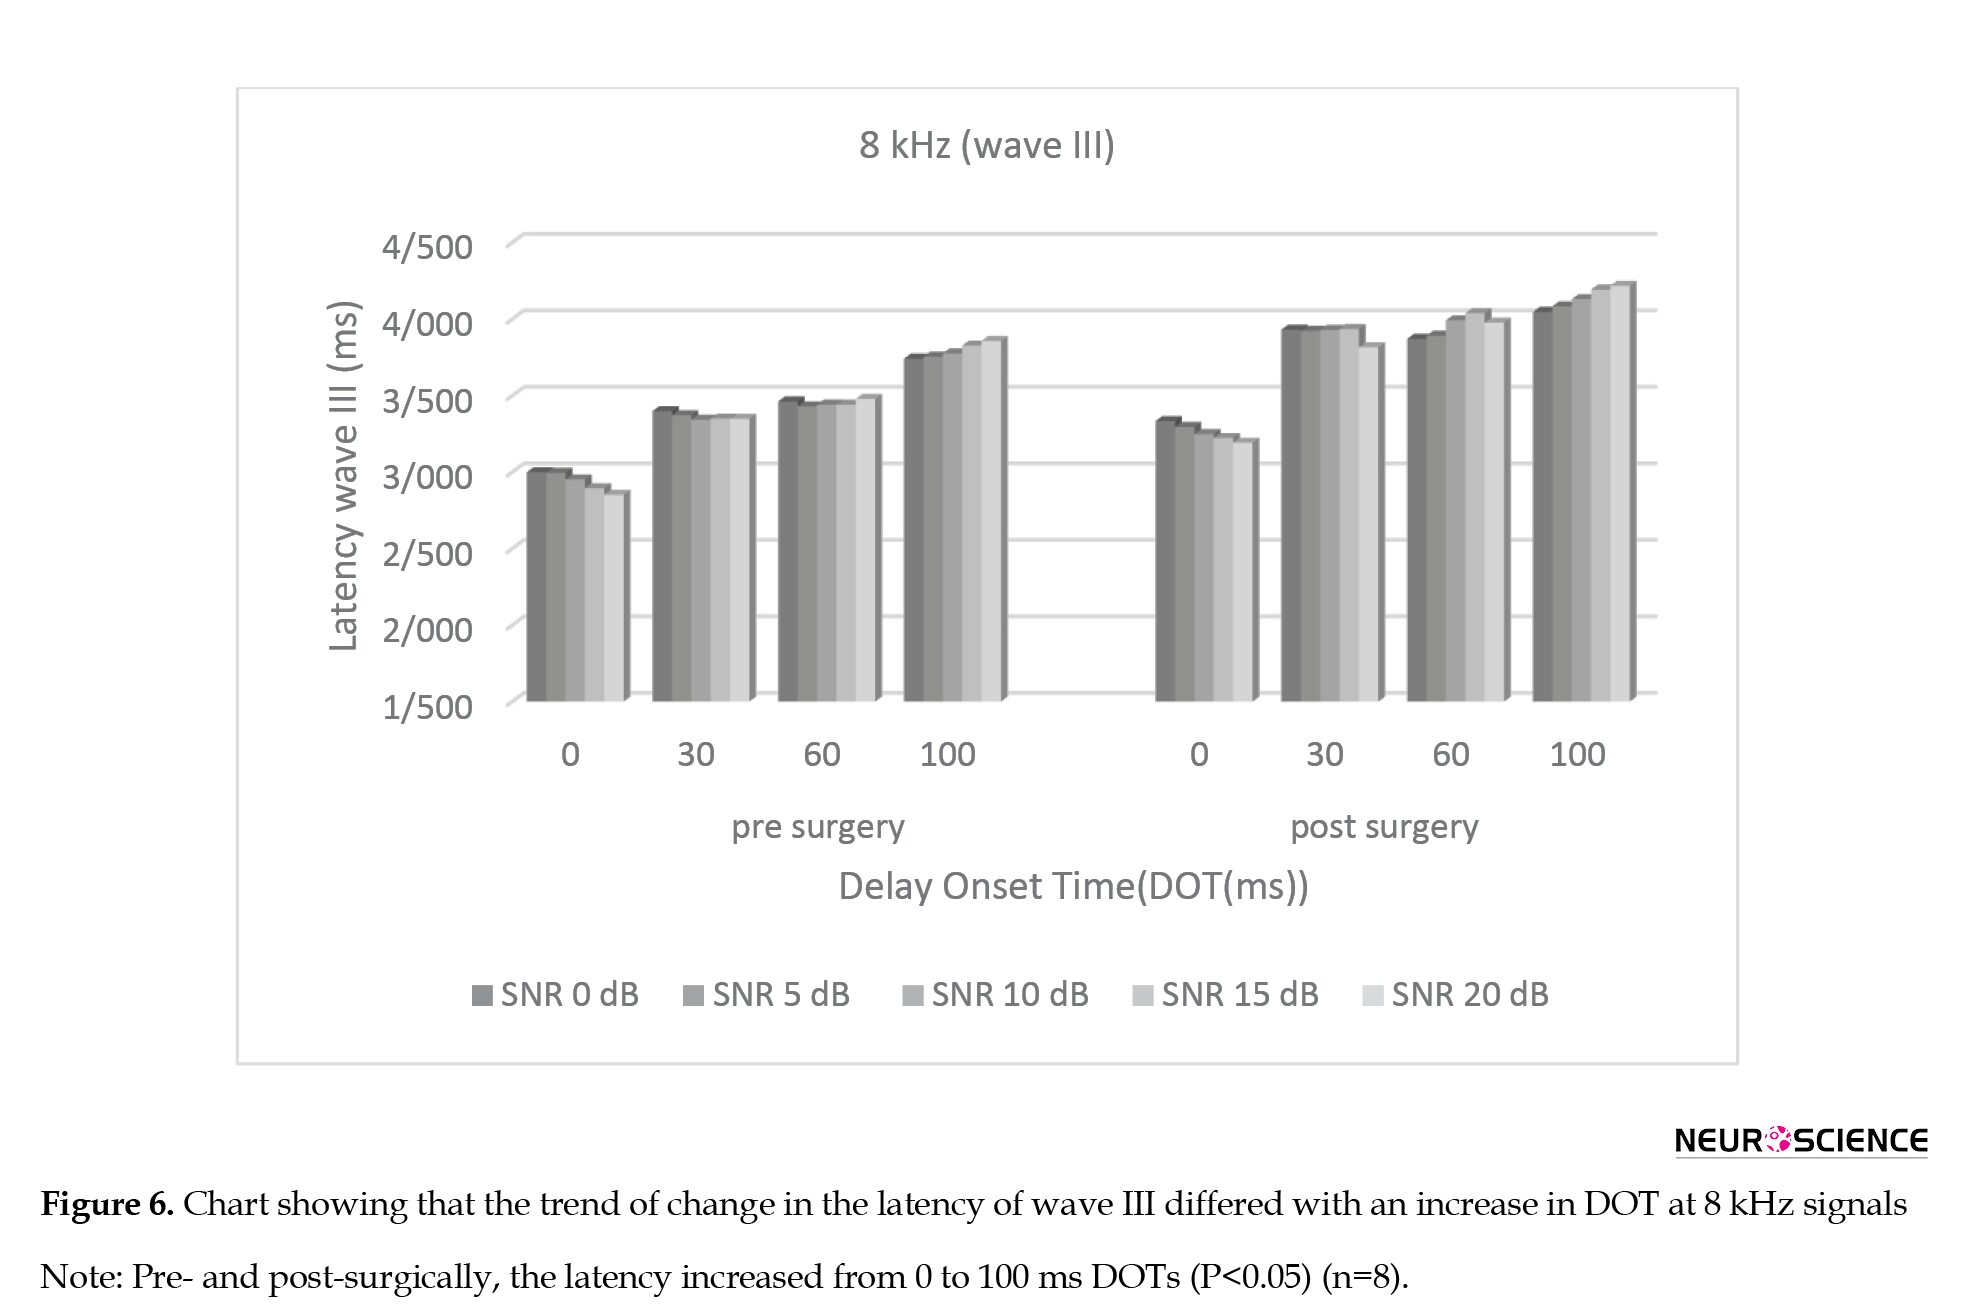
The main effect (Bonferroni analysis) at absolute latency of subtracted wave III after surgery showed that for all SNRs, there were significant changes between the 0 ms and other DOTs (P<0.05) and no significant changes between the 30 ms and the (60, 100) ms DOTs separately (P>0.05). Figure 6 shows the trend of change in the latency of wave III differed with an increase in DOT at 8 kHz signals.
Immunohistochemical staining
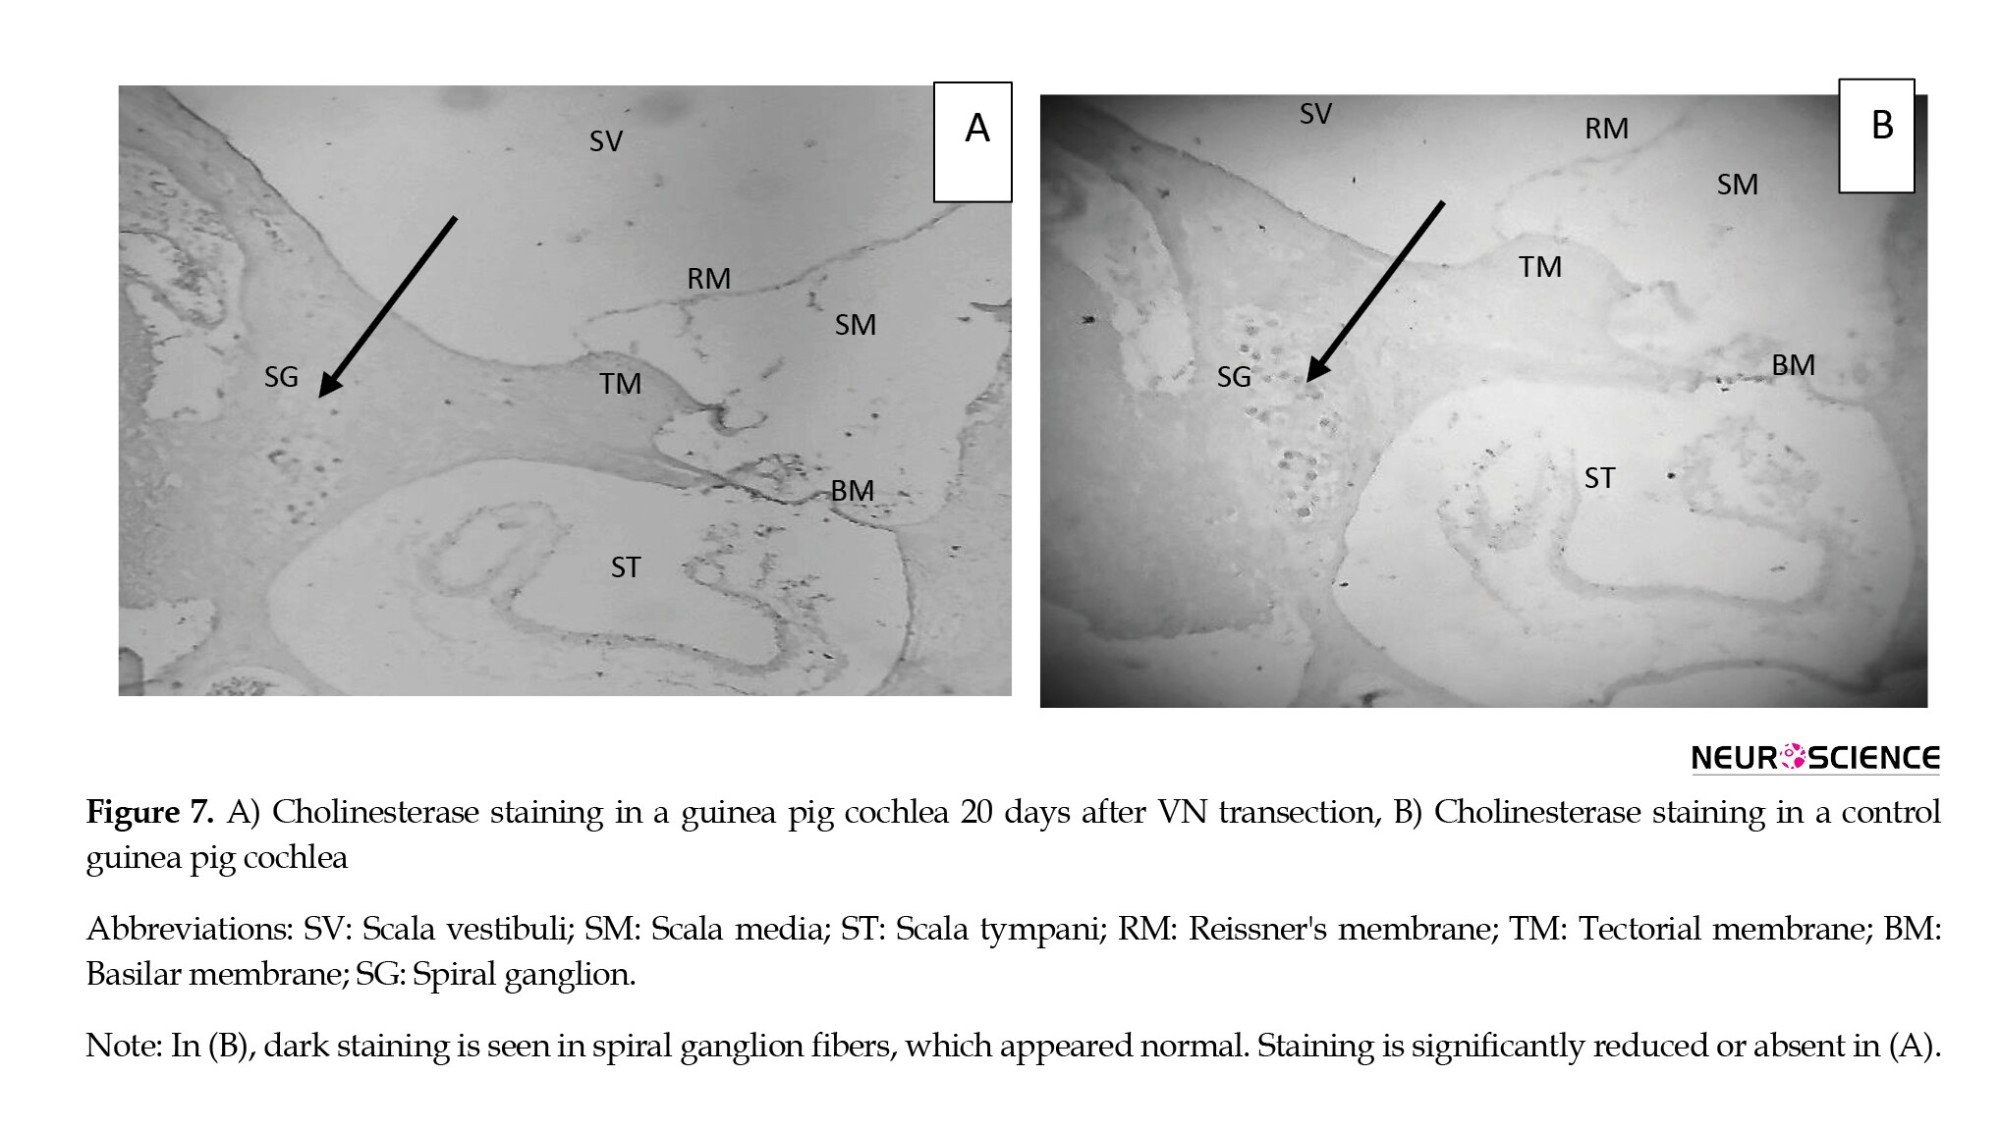
We used immunohistochemical staining for acetylcholinesterase (ACHE) to confirm the interruption of the AENs. Figure 7, parts a and b, demonstrates the significant decrease in cochlear cholinesterase staining after IVN and SVN transection compared to a normal, control cochlea. Transection of the VN consequently reduced the cholinesterase in the right cochlea of the case group. The density of spiral ganglion fibers (arrow) was significantly reduced, although not eliminated. No decrease in cholinesterase staining was detected in the right cochleae of the control group (B).
4. Discussion
Our study aimed to investigate the effect of AENs’ functions on the auditory electrophysiological overshoot and then introduce an objective tool for examining one of the AENs’ performances. Therefore, we studied the effect of low- and high-frequency stimuli on electrophysiological overshoot and the trend of ABR changes in different DOTs in a guinea pig model of auditory de-efferentation. The model was developed when the AENs were sectioned at the entry point into the internal acoustic canal from the cerebellum side. Then, the absolute latencies of waves I and III obtained by subtraction of the waveform generated by the noise and signal together from that by noise alone were compared before and after the interruption of the nerves. ABR was measured at two different frequencies (16 and 8 kHz), separately with DOTs of 0, 30, 60, and 100 ms between the noise and signal for the five SNRs.
Considering different DOTs at 16 kHz before the surgery, the latency of waves increased from 0 to 30 ms, unchanged from 30 to 60 ms, and decreased from 60 to 100 ms, but at 8 kHz increased significantly from 0 to 100 ms. After the surgery, the trend of changes at 16 kHz was different and increased from 0 to 100 ms. However, there was no change in the course of changes at 8 kHz. As shown in our previous study, the trend of changes was more evident in the latency of wave I compared to the latency of wave III. Therefore, ABR, especially primary waves (wave I) at different DOTs, showed the expected overshoot-like effect. This means that the detectability of the signal (decrease of wave’s latency) was better when the DOT was increased, as seen in our previous study.
In psychoacoustic studies, it has been said that with increasing DOT over a certain period of noise onset, changes in signal detectability are almost constant, and then it will be better. McFadden et al. (2010) reported that detectability remained constant for at least 20–30 ms of signal delay and gradually improved toward its maximum. Thus, there was a “hesitation” before detectability began to improve, and its duration was similar to that seen in physiological measurements of the medial olivocochlear function. In other words, the time histograms of auditory ipsilateral and contralateral efferent nerve function indicated a peak of 20 to 45 ms (Brown, 1989; Robertson & Gummer, 1985). In the present study, the absence of changes in the latency of waves before the surgery and changes after the surgery at a time interval between 30 to 60 ms at 16 kHz stimulus (high-frequency) could be related to the probable effect of the AENs. However, wave (I and III) latencies between 30 to 60 ms DOT were changed at 8 kHz. As shown in previous psychoacoustic studies, the magnitude of overshoot is greater at high-frequency and is lesser at low-frequency stimuli.
To investigate the probable effect of the efferent system on auditory overshoot, transection of the entire efferent bundle as it enters the medial aspect of the internal auditory canal was considered. A convenient and valuable tool for confirming the location of the efferent pathway between the brainstem and the cochlea is immunohistochemical staining for ACHE, which is consistently identified and traced in and around cochlear structures associated with efferent innervation. Cholinesterase staining in a de-efferented cochlea 20 days after transection was significantly reduced or absent, but it was normal in the control guinea pig’s cochlea. So, the transection procedure and de-efferented model were confirmed. It can be concluded that the AENs were affected and destroyed in the case group, and those in the control group were intact and healthy.
After the surgery, with transection of the AENs, the trend of changes differed: The latency of waves I and III increased from 0 to 100 ms DOTs at 16 kHz stimulus. There was no “hesitation” before detectability improved at 30 to 60 ms. As mentioned, the hesitation has been related to the AENs’ performance; thus, the absence of a plateau in our post-surgery data between 30 and 60 ms DOT could be explained. This means that the auditory efferent increases SNR when a signal is masked by noise, thereby enhancing the encoding of the signals in the noise (Nieder & Nieder, 1970; Tomchik & Lu, 2006). With a greater DOT, the effect of efferent nerves decreases, and the detectability of the ABR waves increases, reducing the latency and increasing the amplitude, especially for earlier waves such as wave I. It can be concluded that increasing the latency of waves from 0 to (30- 60) ms and the plateau between 30 to 60 ms DOT, which was abolished after AENs transection, is explained by AEN function.
At the 8 kHz stimulus, the course of changes was similar before and after the surgery: The latency of waves I and III increased from 0 to 100 ms DOT, and the overshoot phenomenon was not evident. Our previous study also reported that an increase in DOT would decrease the latencies of the waves and increase their amplitudes. In the current study, by comparing the changes in the variables mentioned between the 16 kHz and 8 kHz stimuli, the overshoot phenomenon could be observed at 16 kHz and, to a lesser extent, at 8 kHz stimuli. It showed that the auditory overshoot is frequency-dependent. As in another study, the magnitude of the overshoot was influenced by the frequency of the signal; the higher the frequency, the magnitude of variation (Liberman & Gao, 1995; Liberman & Guinan, 1998; Walsh et al., 2010). As for psychoacoustic overshoot, the effect of the noise on the signal decreases, and signal detection becomes easier (Fletcher et al., 2013). The detectability of the signal in our study reflecting the neural activity became much easier.
As mentioned, the proposed factors or mechanisms that influence overshoot are peripheral and central (Keefe et al., 2009; Lichtenhan et al., 2016; Walsh et al., 2010). The role of attention and efferent nerve function as central factors has been linked to overshoot (Guinan, 2018). In psychoacoustic overshoot studies, the listener is alert and attends to the task. As a result, attention attenuates irrelevant auditory stimuli through the function of the caudal efferent system (Overson et al., 1996; Schmidt & Zwicker, 1991). In our study, the guinea pigs were anesthetized. It is thought that anesthesia diminishes the effect of attention and the medial olivocochlear reflex. To reduce the impact of the noise, we subtracted waves due to noise alone from waves produced by the combination of signal and noise. Subtraction of the waves lessened the effect of noise on the signal, and essential features were extracted.
Moreover, in the case of anesthesia, the functioning of the AENs is reduced but not eliminated. Therefore, comparing the magnitude of the overshoot phenomenon in psychoacoustic studies (attending subjects) with electrophysiological studies (anesthetized animals) is difficult. Thus, the present study only tracks this phenomenon as an electrophysiologic tool and the effects of the AENs’ function on them. Even though the efferent nerve function decreased, it did not disappear completely (Chambers et al., 2012); therefore, the magnitude of electrophysiological overshoot was somewhat lower.
In examining the post-intervention changes due to DOTs, as shown in Figures 3, 4, 5 and 6, the latency of the waves relative to the pre-intervention period slightly increases despite the lack of change in hearing threshold. It can be attributed to the effect of AENs function on the performance of the afferent system (Zheng et al., 1999). In our study, the noise was broadband, while the signal was a tone burst and transient. It is known that the medial olivocochlear reflex minimizes the steady response to the noise by auditory nerve fibers, thereby maximizing the response to a transient signal and making the signal easier to detect. To reach the extent of the changes related to the phenomenon of overshooting compared with psychoacoustic studies and to evaluate the magnitude of the overshoot phenomenon, we used different SNRs. We studied the amplitude of the waves by conveying the changes due to the increase in the signal intensity compared with the noise. Concerning the variability of wave amplitude and the effect of subtracting the waves from each other, we did not achieve significant results in using this parameter, so our focus was on the changes created at the latency of the waves.
5. Conclusion
Comparing the trend of changes in latency of waves at different DOTs, especially the lack of changes at 30-60 ms, speculate that the efferent system influenced the auditory electrophysiological overshoot. By transection of AENs, the overshoot phenomenon using the ABR paradigm disappeared, and the effect of the efferent system on the overshoot was confirmed.
In the present study, the overshoot phenomenon was observed at 16 kHz and not at 8 kHz, so we can claim that the detected overshoot is frequency-dependent.
The findings of this study relate only to the study itself and cannot be generalized. Further understanding of changes in waves occurring due to changes in the other DOTs and different frequencies in un-anesthetized conditions is required.
Ethical Considerations
Compliance with ethical guidelines
The present study was conducted in the Animal Hearing Research Laboratory at the School of Rehabilitation Science of Iran University of Medical Sciences, Tehran, Iran (Code: IR.IUMS.REC-1396.9311303001; 01/20/2018).
Funding
This work was supported by a research grant from the Iran University of Medical Sciences, Tehran, Iran.
Authors' contributions
Conceptualization, study design, investigation, data collection, data interpretation, writing and final approval: All authors; Data analysis: Hamid Haghani.
Conflict of interest
The authors declared no conflict of interest.
Acknowledgments
The authors are grateful to Samer Mohsen at the Faculty of Health Sciences, Damascus University, for his generous contribution to data collection.
References
The caudal auditory efferent system, or the olivocochlear nerve bundle, is a descending pathway that originates in the brainstem and ends in the organ of Corti of the cochlea. It was identified over 70 years ago (Rasmussen, 1946). A lot of research was conducted on its anatomy and functions thereafter (Brown, 1987; Liberman, 1980; Warr et al., 1997; Warr & Guinan, 1979). The anti-masking (Liberman & Guinan, 1998), protection against loud noise (Cody & Johnstone, 1982; Handrock & Zeisberg, 1982; Liberman & Gao, 1995; Rajan, 1990), auditory and visual attention (Guinan, 2018; Igarashi et al., 1974; Oatman, 1976; Scharf et al., 1997), and auditory development are among the roles attributed to this system (Walsh et al., 1998). Despite much research on the characteristics of efferent nerves, many functional aspects of this system have remained unclear.
Several psychoacoustical studies have been carried out on the effect of perception in noise. In the last theories about the functioning of olivocochlear nerves, a phenomenon called auditory overshoot has been discussed. It is used to study the effects of background noise on everyday hearing. The investigation of auditory overshoot may help understand the ability to hear a brief sound in background noise. It is known as a temporal auditory effect (Bacon, 1990; Hicks & Bacon, 1991; Schmidt & Zwicker, 1991; von Klitzing & Kohlrausch, 1994) that depends on the timing between the onset of the signal and the masker noise, called delay onset time (DOT). When a listener must detect a brief tonal signal presented in a longer masking noise and the onset of the signal is slightly delayed from the onset of the masker, the behavioral detectability of the signal becomes easier (Chatterjee & Smith, 1993). It was shown that this phenomenon can also be recorded in the auditory brainstem (Chatterjee & Smith, 1993; Haddadzade et al., 2021). We realized overshoot in our previous study that the latencies of ABR’s waves, especially the first waves, decrease, and the amplitude increases when DOT increases. Classic firing rate adaptation and medial olivocochlear feedback (Jennings et al., 2011) are proposed physiological overshoot mechanisms. Some basic characteristics of overshoot are obligatory consequences of cochlear function, as modulated by the olivocochlear efferent system (McFadden et al., 2010). For the subjects showing overshoot, detectability remained approximately constant for at least 20-30 ms of signal delay, and then, detectability gradually improved toward its maximum (McFadden et al., 2010).
In guinea pigs, the discharge peak of the AENs in ipsilateral and contralateral neurons is 20- 40 and 25- 45 ms, respectively (Brown, 1989). It was compatible with the time course that the auditory overshoot observed. Therefore, we aimed to prove the effect of efferent systems on overshoot by extending the previous auditory brainstem response (ABR) study on different DOTs within and out of the discharge peak of AENs by dissecting the nerves. The cochlear efferent innervation in guinea pigs is carried in the inferior and superior vestibular nerves at entry into the medial bulla (Littman et al., 1991). Therefore, we sectioned both right inferior and superior vestibular nerves at the point of entry into the internal acoustic canal and then examined ABR by using the low-frequency tone burst compared to the high-frequency tone burst at 0, 30, 60, and 100 ms DOTs before and after the interruption.
A convenient tool for confirming the section of the AENs is the immunohistochemical staining for acetylcholinesterase (ACHE). Cholinesterase was confined to the spiral ganglion and organ of Corti. The efferent nerve sectioning in guinea pigs’ brainstem level significantly reduces cholinesterase-positive structures within the cochlea.
Our study aimed to investigate the effect of the AENs function on the auditory electrophysiological overshoot and introduce an objective tool to examine one of the AENs’ performances.
2. Materials and Methods
Study animals
Sixteen two-month-old male Albino guinea pigs (250-350 g) were purchased from the Pasteur Institute (Tehran, Iran). The animals were housed in cages with free access to water and food in a temperature-controlled room (20–25 °C) with a 12 h light/dark cycle. The present study used a checklist of working with laboratory animals approved by the Ministry of Health and Medical Education. Before surgery, the animals were kept for three days to adapt to the new living environment. The guinea pigs were randomly divided into two groups: The first group (cases) sectioning the AENs and the second group (control) just exposing the nerves (n=8, each).
Study procedure
ABR recording
The animals were anesthetized with an IP injection of the mixture of ketamine (40 mg/kg body weight) and xylazine (4 mg/kg body weight). Ketamine was repeated half dose during surgery if needed. The ABR was recorded using a Biologic Navigator Pro AEP (USA). The inverting needle electrode was set on the vertex, the non-inverting on the right, and the common on the left mastoid. The impedance difference between electrodes was kept at less than 3 kΩ. The animals were placed in a double-walled, sound-proofed booth throughout the ABR recording. The body temperature was measured during surgery and testing with a digital thermometer and controlled with a heating pad. The threshold was defined as the minimum level at which wave III could be repeatedly detected and disappear at 5 dB less. Subjects with a threshold within ±1 SD of the lab’s normal range were included for further data gathering. The threshold was measured again after the completion of surgical procedures. If the threshold shifted more than 10 dB, that animal was excluded from the study. To evaluate auditory overshoot, the ABR was recorded using the noise level fixed at 60 dB PeSPL (decibel Peak Equivalent Sound Pressure Level) and the signal level modulated for the 5 SNRs (0, +5, +10, +15, +20 dB) and the four DOTs (0, 30, 60, 100 ms) at 8 and 16 kHz. The stimuli (noise and signal) were combined by Cool Edit Pro (version 2.1) and presented to the right ear at 45° to the head of the animal by the speaker (ONKYO DWASK001, Korea). The other ear was blocked. To control the effect of noise, the waves achieved by noise and signal were subtracted from those with noise alone; then, the absolute latencies of waves I and III for the four DOTs and each SNRs at two different frequencies were determined pre-surgery and post-surgery.
Surgery approach
In the case group, AENs were sectioned. In the control group, the nerves were exposed; however, they were kept healthy. A tracheotomy was performed, and the animal was ventilated with room air. Epinephrine is administered to reduce blood pressure at the point of surgery in the skull. A posterior craniotomy was performed by drilling a tinny hole into the skull at the intraparietal triangle on the right side. The bone was removed from the parietal crest and moved to the right temporal line using a small clamp. The dura was opened, the cerebellum was retracted medially using small pieces of moistened cotton, and para-flocculus was aspirated. The brain stem was then retracted medially, and the cochlear vestibular and facial nerves were exposed at the medial aspect of the right bulla. The inferior and posterior vestibular nerves were transected by a stapes hook, and the cochlear and facial nerves and arteries were maintained. Figure 1 schematically illustrates the relative location of the nerves of interest. Animals underwent the surgical procedure up to exposure of the nerves without transection (control). After surgery, the dura was closed using small pieces of moistened cotton, and the scalp incision was sutured. The animal was monitored for 3 to 6 hours and allowed to recover. Once awake, pain was controlled with acetaminophen (10 mg/kg). Tetracycline was given orally (415 mg/L) via drinking water for 5 to 7 days following surgery.
Immunohistochemical staining
Twenty days after the surgery, the animals were sacrificed. Both bullae were removed and fixed with 10% formalin, and the cochleae were stained for cholinesterase using the envision immunohistochemical (IHC) staining technique. The primary antibody for IHC was anti-acetylcholinesterase antibody ab31276 (Santa Cruz production). Slides were prepared from the first and second turns of the guinea pig cochlea because of the higher density of efferent innervation in this region (Smith, 1961; Smith & Rasmussen, 1965; Wright & Preston, 1973). The changes in staining after vestibular nerve transection were observed via light microscopy.
Stimuli and recording parameters
Specific parameters were adopted to record the overshoot electro-physiologically. We applied a 16 and 8 kHz tone burst stimulus and wideband noise for the signal and noise, respectively. The signals with different DOTs were compared to the noise. The signal (the ABR stimulus) was presented simultaneously with the noise onset, 30 ms and 60 ms after noise onset and immediately after the completion of the noise. The signal included five tone burst complexes with a 5 ms duration and a 1 ms rise/fall time. For each tone burst at 16 and 8 kHz, 11 ms interstimulus intervals were considered to overcome the minimal nerve response recovery time. The duration of the noise was 100 ms (0.1-8 kHz). The signal and noise intensity level was set at 60 dB PeSPL.
The gain to ABR recordings was set as 100000, and 250 stimuli were used for averaging. The high-pass and low-pass filters were 100-3000 Hz, and the time window was 10 ms. The stimuli intensity (signal and noise) was calibrated with a 2250 L sound level meter (B&K) at 5 cm from the speaker. The speaker covered high-frequency sounds of up to 20 kHz.
Statistical analysis
Statistical analysis was performed in SPSS software, version 19 (USA). All data had a normal distribution (P>0.05). The statistical significance was tested using global linear models. Tukey one-way analysis of variance (ANOVA) analysis was conducted for each ABR to analyze the calculated latency of waves I and III to the subtracted waves across the factors of time delay (4 conditions) and SNR (5 conditions) as within-subject variables. A pairwise comparison was conducted using Bonferroni analysis of the significant effects. The significance level was 0.05 for all statistical analyses.
3. Results
In our previous study on the electrophysiological overshoot, changes in latency of subtracted ABR waves, especially at the first waves, showed an overshoot phenomenon. Therefore, we measured and compared the latencies of subtracted waves I and III in both groups before and after surgery for both stimuli separately under the different stimuli conditions. Figure 2 shows the grand averages of ABR waveforms in the case group at 16 kHz (left column) and 8 kHz (right column).
Since data displayed a normal distribution, we compared the latency waves I and III before and after the surgery at both groups and stimuli using Tukey one-way ANOVA statistical analysis. There were no significant changes between the control group before and after surgery and the case group before surgery (P>0.05). There were significant changes after surgery in the case group. Therefore, we reported the variables in the case group for both stimuli separately before and after the surgery.
Electrophysiological result (case group)
16-kHz stimulus
Data analysis in the case group showed significant changes between the latency waves I and III at 16 kHz before and after surgery (P<0.05).
Repeated measures analysis for absolute latency of subtracted wave I before and after the surgery separately showed a significant main effect for DOT (F3.0, 21.00=10.252; P<0.001; η2=0.893) and no significant main effect for SNR (F1.889, 13.226=0.08; P>0.05; η2=0.106) before surgery. There was also a significant interaction effect for DOT and SNR (F12.00, 84.00=0.174; P<0.05; η2=0.532) before surgery.
The main effect of Bonferroni analysis at absolute latency of subtracted wave I before surgery showed significant changes between the 0 ms and (30, 60) ms DOTs and the (30, 60) ms with 100 ms DOTS, respectively for 0, 5, and 10 dB SNRs (P<0.05). For the other SNRs (15, 20 dB), there were significant changes between the 0 ms and other DOTs (30, 60, and 100 ms) and between the (30, 60) ms and 100 ms, respectively (P<0.05). No significant changes between the 30 and 60 ms and between the 0 and 100 ms were observed for all SNRs (P>0.05).
Analysis of data with repeated measures for absolute latency of subtracted wave I before and after surgery separately showed a significant main effect for DOT (F3.0, 21.00=13.491; P<0.001; η2=0.927) and no significant main effect for SNR (F2.353, 16.471=0.025; P>0.05; η2=0.409) after surgery. There was also a significant interaction effect for DOT and SNR (F12.00, 84.00=0.302; P<0.05; η2=0.477) after the surgery.
The main effect (Bonferroni analysis) at absolute latency of subtracted wave I after surgery showed significant changes between the 0 ms and other DOTs for all of the SNRs (P<0.05), and there were no significant changes between the 30 ms and the (60, 100) ms DOTs separately (P>0.05).
Analysis of data with repeated measures for absolute latency of subtracted wave III before and after the surgery separately showed a significant main effect for DOT (F2.186, 15.304=6.522; P>0.005; η2=0.839) and a significant main effect for SNR (F4.00, 28.00=0.042; P>0.05; η2=0.512) before the surgery. There was also a significant interaction effect for DOT and SNR (F12.00, 84.00=0.333; P<0.05; η2=0.767) before the surgery.
The main effect (Bonferroni analysis) at absolute latency of subtracted wave III before the surgery showed no significant changes between the 0 ms and three other DOTs and between the 30 and 60 ms for the 0, 5, and 10 dB SNRs (P>0.05). There were significant changes between the (30, 60) ms and 100 ms DOTs (P<0.05). Significant changes between the 0 ms and (30, 60) ms DOT and the (30, 60) ms and 100 ms DOT were noticed (P<0.05). Also, there were no significant changes between the 0 ms and 100 ms DOT for the 15 and 20 dB SNRs (P>0.05).
Analysis of data with repeated measures for absolute latency of subtracted wave III before and after the surgery separately showed no significant main effect for DOT (F2.019, 21.00=16.484; P<0.001; η2=0.918) and not a significant main effect for SNR (F4.00, 24.00=0.020; P> 0.05; η2=0.148) after the surgery. There was also a significant interaction effect for DOT and SNR (F12.00, 84.0=0.388; P<0.05; η2=0.567) after the surgery.
The main effect (Bonferroni analysis) at absolute latency of subtracted wave III after surgery showed that for all of the SNRs, there were significant changes between the 0 ms and other DOTs (P<0.05) and no significant changes between the 30 ms and the (60, 100) ms DOTs separately (P>0.05). Figure 4 shows the trend of change in the latency of wave III differed with an increase in DOT at 16 kHz signals
8-kHz stimulus
There were significant changes between the latency waves I and III at 8 kHz before and after the surgery in the case group (P<0.05). Analysis of data with repeated measures for absolute latency of subtracted wave I before and after the surgery separately showed a significant main effect for DOT (F3.0, 21.00=15.895; P<0.001; η2=0.827) and a significant main effect for SNR (F4.00, 28.00=0.214; P< 0.01; η2=0.411) before the surgery. There was also a significant interaction effect for DOT and SNR (F12.00, 84.00=0.764; P<0.05; η2=0.419) before the surgery.
The main effect (Bonferroni analysis) at absolute latency of subtracted wave I before the surgery showed significant changes between the 0 ms and other DOTs (P<0.05) for all of the SNRs. No significant changes between the 30 and 60 ms (P>0.05) and also no significant changes between the (30, 60 ms) and 100 ms DOTS, respectively (P>0.05) were found.
Analysis of data with repeated measures for absolute latency of subtracted wave I before and after the surgery showed a significant main effect for DOT
(F2.255, 21.00=13.737; P<0.001; η2=0.885) and no significant main effect for SNR (F1.916, 28.00=0.003; P>0.05; η2=0.026) after surgery. There was also a significant interaction effect for DOT and SNR (F12.00, 84.00=0.173; P<0.05; η2=0.292) after the surgery. Figure 3 shows the trend of change in the latency of wave I differed with an increase in dOT at 16 kHz signals.
The main effect (Bonferroni analysis) at absolute latency of subtracted wave I after the surgery showed that for all SNRs, there were significant changes between the 0 ms and other DOTs (P<0.05) and no significant changes between the 30 ms and the (60, 100) ms DOTs, separately (P>0.05). Figure 5 shows the trend of change in the latency of wave I differed with an increase in DOT at 8 kHz signals
Repeated measures analysis for absolute latency of subtracted wave III before and after surgery separately revealed a significant main effect for DOT (F 3.00,21.00=14.754; P<0.001; η2=0.739) and no significant main effect for SNR (F2.179, 15.250=0.011; P>0.05; η2=0.180) before the surgery. There was also a significant interaction effect for DOT and SNR (F12.00, 84.00=0.229; P<0.05; η2=0.452) before the surgery.
The main effect (Bonferroni analysis) at absolute latency of subtracted wave III before the surgery determined that for the 0 dB SNR, there were no significant changes between the 0 ms and (30, 60 ms) DOTs (P>0.05) and significant changes between the 0 and 100 ms DOTs and between the (30, 60 ms) and 100 ms DOTs (P<0.05). No significant changes existed between the 0 and 30 ms DOTs for 5 dB SNR (P>0.05). For the other SNRs, there were significant changes between the 0 ms and other DOTs and also between the (30, 60 ms) and 100 ms DOTs (P<0.05). No significant changes occurred between the 30 and 60 ms DOT for all SNRs (P>0.05).
Analysis of data with repeated measures for absolute latency of subtracted wave III before and after the surgery separately showed no significant main effect for DOT (F3.00, 21.00=17.596; P<0.001; η2=0.860) and not a significant main effect for SNR (F4.00, 28.00=0.065; P>0.05; η2=0.129) after the surgery. DOT and SNR also had a significant interaction effect (F12.00, 84.00=0.446; P<0.05; η2=0.258) after the surgery.
The main effect (Bonferroni analysis) at absolute latency of subtracted wave III after surgery showed that for all SNRs, there were significant changes between the 0 ms and other DOTs (P<0.05) and no significant changes between the 30 ms and the (60, 100) ms DOTs separately (P>0.05). Figure 6 shows the trend of change in the latency of wave III differed with an increase in DOT at 8 kHz signals.
Immunohistochemical staining
We used immunohistochemical staining for acetylcholinesterase (ACHE) to confirm the interruption of the AENs. Figure 7, parts a and b, demonstrates the significant decrease in cochlear cholinesterase staining after IVN and SVN transection compared to a normal, control cochlea. Transection of the VN consequently reduced the cholinesterase in the right cochlea of the case group. The density of spiral ganglion fibers (arrow) was significantly reduced, although not eliminated. No decrease in cholinesterase staining was detected in the right cochleae of the control group (B).
4. Discussion
Our study aimed to investigate the effect of AENs’ functions on the auditory electrophysiological overshoot and then introduce an objective tool for examining one of the AENs’ performances. Therefore, we studied the effect of low- and high-frequency stimuli on electrophysiological overshoot and the trend of ABR changes in different DOTs in a guinea pig model of auditory de-efferentation. The model was developed when the AENs were sectioned at the entry point into the internal acoustic canal from the cerebellum side. Then, the absolute latencies of waves I and III obtained by subtraction of the waveform generated by the noise and signal together from that by noise alone were compared before and after the interruption of the nerves. ABR was measured at two different frequencies (16 and 8 kHz), separately with DOTs of 0, 30, 60, and 100 ms between the noise and signal for the five SNRs.
Considering different DOTs at 16 kHz before the surgery, the latency of waves increased from 0 to 30 ms, unchanged from 30 to 60 ms, and decreased from 60 to 100 ms, but at 8 kHz increased significantly from 0 to 100 ms. After the surgery, the trend of changes at 16 kHz was different and increased from 0 to 100 ms. However, there was no change in the course of changes at 8 kHz. As shown in our previous study, the trend of changes was more evident in the latency of wave I compared to the latency of wave III. Therefore, ABR, especially primary waves (wave I) at different DOTs, showed the expected overshoot-like effect. This means that the detectability of the signal (decrease of wave’s latency) was better when the DOT was increased, as seen in our previous study.
In psychoacoustic studies, it has been said that with increasing DOT over a certain period of noise onset, changes in signal detectability are almost constant, and then it will be better. McFadden et al. (2010) reported that detectability remained constant for at least 20–30 ms of signal delay and gradually improved toward its maximum. Thus, there was a “hesitation” before detectability began to improve, and its duration was similar to that seen in physiological measurements of the medial olivocochlear function. In other words, the time histograms of auditory ipsilateral and contralateral efferent nerve function indicated a peak of 20 to 45 ms (Brown, 1989; Robertson & Gummer, 1985). In the present study, the absence of changes in the latency of waves before the surgery and changes after the surgery at a time interval between 30 to 60 ms at 16 kHz stimulus (high-frequency) could be related to the probable effect of the AENs. However, wave (I and III) latencies between 30 to 60 ms DOT were changed at 8 kHz. As shown in previous psychoacoustic studies, the magnitude of overshoot is greater at high-frequency and is lesser at low-frequency stimuli.
To investigate the probable effect of the efferent system on auditory overshoot, transection of the entire efferent bundle as it enters the medial aspect of the internal auditory canal was considered. A convenient and valuable tool for confirming the location of the efferent pathway between the brainstem and the cochlea is immunohistochemical staining for ACHE, which is consistently identified and traced in and around cochlear structures associated with efferent innervation. Cholinesterase staining in a de-efferented cochlea 20 days after transection was significantly reduced or absent, but it was normal in the control guinea pig’s cochlea. So, the transection procedure and de-efferented model were confirmed. It can be concluded that the AENs were affected and destroyed in the case group, and those in the control group were intact and healthy.
After the surgery, with transection of the AENs, the trend of changes differed: The latency of waves I and III increased from 0 to 100 ms DOTs at 16 kHz stimulus. There was no “hesitation” before detectability improved at 30 to 60 ms. As mentioned, the hesitation has been related to the AENs’ performance; thus, the absence of a plateau in our post-surgery data between 30 and 60 ms DOT could be explained. This means that the auditory efferent increases SNR when a signal is masked by noise, thereby enhancing the encoding of the signals in the noise (Nieder & Nieder, 1970; Tomchik & Lu, 2006). With a greater DOT, the effect of efferent nerves decreases, and the detectability of the ABR waves increases, reducing the latency and increasing the amplitude, especially for earlier waves such as wave I. It can be concluded that increasing the latency of waves from 0 to (30- 60) ms and the plateau between 30 to 60 ms DOT, which was abolished after AENs transection, is explained by AEN function.
At the 8 kHz stimulus, the course of changes was similar before and after the surgery: The latency of waves I and III increased from 0 to 100 ms DOT, and the overshoot phenomenon was not evident. Our previous study also reported that an increase in DOT would decrease the latencies of the waves and increase their amplitudes. In the current study, by comparing the changes in the variables mentioned between the 16 kHz and 8 kHz stimuli, the overshoot phenomenon could be observed at 16 kHz and, to a lesser extent, at 8 kHz stimuli. It showed that the auditory overshoot is frequency-dependent. As in another study, the magnitude of the overshoot was influenced by the frequency of the signal; the higher the frequency, the magnitude of variation (Liberman & Gao, 1995; Liberman & Guinan, 1998; Walsh et al., 2010). As for psychoacoustic overshoot, the effect of the noise on the signal decreases, and signal detection becomes easier (Fletcher et al., 2013). The detectability of the signal in our study reflecting the neural activity became much easier.
As mentioned, the proposed factors or mechanisms that influence overshoot are peripheral and central (Keefe et al., 2009; Lichtenhan et al., 2016; Walsh et al., 2010). The role of attention and efferent nerve function as central factors has been linked to overshoot (Guinan, 2018). In psychoacoustic overshoot studies, the listener is alert and attends to the task. As a result, attention attenuates irrelevant auditory stimuli through the function of the caudal efferent system (Overson et al., 1996; Schmidt & Zwicker, 1991). In our study, the guinea pigs were anesthetized. It is thought that anesthesia diminishes the effect of attention and the medial olivocochlear reflex. To reduce the impact of the noise, we subtracted waves due to noise alone from waves produced by the combination of signal and noise. Subtraction of the waves lessened the effect of noise on the signal, and essential features were extracted.
Moreover, in the case of anesthesia, the functioning of the AENs is reduced but not eliminated. Therefore, comparing the magnitude of the overshoot phenomenon in psychoacoustic studies (attending subjects) with electrophysiological studies (anesthetized animals) is difficult. Thus, the present study only tracks this phenomenon as an electrophysiologic tool and the effects of the AENs’ function on them. Even though the efferent nerve function decreased, it did not disappear completely (Chambers et al., 2012); therefore, the magnitude of electrophysiological overshoot was somewhat lower.
In examining the post-intervention changes due to DOTs, as shown in Figures 3, 4, 5 and 6, the latency of the waves relative to the pre-intervention period slightly increases despite the lack of change in hearing threshold. It can be attributed to the effect of AENs function on the performance of the afferent system (Zheng et al., 1999). In our study, the noise was broadband, while the signal was a tone burst and transient. It is known that the medial olivocochlear reflex minimizes the steady response to the noise by auditory nerve fibers, thereby maximizing the response to a transient signal and making the signal easier to detect. To reach the extent of the changes related to the phenomenon of overshooting compared with psychoacoustic studies and to evaluate the magnitude of the overshoot phenomenon, we used different SNRs. We studied the amplitude of the waves by conveying the changes due to the increase in the signal intensity compared with the noise. Concerning the variability of wave amplitude and the effect of subtracting the waves from each other, we did not achieve significant results in using this parameter, so our focus was on the changes created at the latency of the waves.
5. Conclusion
Comparing the trend of changes in latency of waves at different DOTs, especially the lack of changes at 30-60 ms, speculate that the efferent system influenced the auditory electrophysiological overshoot. By transection of AENs, the overshoot phenomenon using the ABR paradigm disappeared, and the effect of the efferent system on the overshoot was confirmed.
In the present study, the overshoot phenomenon was observed at 16 kHz and not at 8 kHz, so we can claim that the detected overshoot is frequency-dependent.
The findings of this study relate only to the study itself and cannot be generalized. Further understanding of changes in waves occurring due to changes in the other DOTs and different frequencies in un-anesthetized conditions is required.
Ethical Considerations
Compliance with ethical guidelines
The present study was conducted in the Animal Hearing Research Laboratory at the School of Rehabilitation Science of Iran University of Medical Sciences, Tehran, Iran (Code: IR.IUMS.REC-1396.9311303001; 01/20/2018).
Funding
This work was supported by a research grant from the Iran University of Medical Sciences, Tehran, Iran.
Authors' contributions
Conceptualization, study design, investigation, data collection, data interpretation, writing and final approval: All authors; Data analysis: Hamid Haghani.
Conflict of interest
The authors declared no conflict of interest.
Acknowledgments
The authors are grateful to Samer Mohsen at the Faculty of Health Sciences, Damascus University, for his generous contribution to data collection.
References
Bacon, S. P. (1990). Effect of masker level on overshoot. The Journal of the Acoustical Society of America, 88(2), 698–702. [DOI:10.1121/1.399773] [PMID]
Brown, M. C. (1987). Morphology of labeled efferent fibers in the guinea pig cochlea. The Journal of Comparative Neurology, 260(4), 605–618. [DOI:10.1002/cne.902600412] [PMID]
Brown, M. C. (1989). Morphology and response properties of single olivocochlear fibers in the guinea pig. Hearing Research, 40(1-2), 93-109. [DOI:10.1016/0378-5955(89)90103-2]
Chambers, A. R., Hancock, K. E., Maison, S. F., Liberman, M. C., & Polley, D. B. (2012). Sound-evoked olivocochlear activation in unanesthetized mice. Journal of The Association for Research in Otolaryngology, 13(2), 209-217. [DOI:10.1007/s10162-011-0306-z] [PMID]
Chatterjee, M., & Smith, R. L. (1993). Physiological overshoot and the compound action potential. Hearing Research, 69(1-2), 45-54. [DOI:10.1016/0378-5955(93)90092-F]
Cody, A. R., & Johnstone, B. M. (1982). Temporary threshold shift modified by binaural acoustic stimulation. Hearing Research, 6(2), 199–205. [DOI:10.1016/0378-5955(82)90054-5] [PMID]
Fletcher, M., de Boer, J., & Krumbholz, K. (2013). Is overshoot caused by an efferent reduction in cochlear gain? Advances in Experimental Medicine and Biology, 787, 65–72. [DOI:10.1007/978-1-4614-1590-9_8] [PMID]
Guinan, J. J., Jr. (2018). Olivocochlear efferents: Their action, effects, measurement and uses, and the impact of the new conception of cochlear mechanical responses. Hearing Research, 362, 38–47. [DOI:10.1016/j.heares.2017.12.012] [PMID]
Handrock, M., & Zeisberg, J. (1982). The influence of the effect system on adaptation, temporary and permanent threshold shift. Archives of Oto-Rhino-Laryngology, 234(2), 191–195. [DOI:10.1007/BF00453630] [PMID]
Hicks, M. L., & Bacon, S. P. (1991). The effect of pure-tone forward masking on overshoot. The Journal of the Acoustical Society of America, 90(1), 228–230. [DOI:10.1121/1.401292] [PMID]
Haddadzade Niri, H., Pourbakht, A., Rahbar, N., & Haghani, H. (2021). Brainstem Representation of Auditory Overshoot in Guinea Pigs Using Auditory Brainstem Responses. Iranian journal of child neurology, 15(2), 41–56. [DOI:10.22037/ijcn.v15i2.26241] [PMID]
Igarashi, M., Alford, B. R., Gordon, W. P., & Nakai, Y. (1974). Behavioral auditory function after transection of crossed olivo-cochlear bundle in the cat. II. Conditioned visual performance with intense white noise. Acta oto-Laryngologica, 77(5), 311–317.[DOI:10.3109/00016487409124630] [PMID]
Jennings, S. G., Heinz, M. G., & Strickland, E. A. (2011). Evaluating adaptation and olivocochlear efferent feedback as potential explanations of psychophysical overshoot. Journal of the Association for Research in Otolaryngology: JARO, 12(3), 345–360. [DOI:10.1007/s10162-011-0256-5] [PMID]
Keefe, D. H., Schairer, K. S., Ellison, J. C., Fitzpatrick, D. F., & Jesteadt, W. (2009). Use of stimulus-frequency otoacoustic emissions to investigate efferent and cochlear contributions to temporal overshoot. The Journal of the Acoustical Society of America, 125(3), 1595–1604. [DOI:10.1121/1.3068443] [PMID]
Liberman, M. C. (1980). Efferent synapses in the inner hair cell area of the cat cochlea: an electron microscopic study of serial sections. Hearing Research, 3(3), 189–204. [DOI:10.1016/0378-5955(80)90046-5] [PMID]
Liberman, M. C., & Gao, W. Y. (1995). Chronic cochlear de-efferentation and susceptibility to permanent acoustic injury. Hearing Research, 90(1-2), 158-168. [DOI:10.1016/0378-5955(95)00160-2]
Liberman, M. C., & Guinan, J. J., Jr. (1998). Feedback control of the auditory periphery: anti-masking effects of middle ear muscles vs. olivocochlear efferents. Journal of Communication Disorders, 31(6), 471–553. [DOI:10.1016/S0021-9924(98)00019-7] [PMID]
Lichtenhan, J. T., Wilson, U. S., Hancock, K. E., & Guinan, J. J., Jr. (2016). Medial olivocochlear efferent reflex inhibition of human cochlear nerve responses. Hearing Research, 333, 216–224.[DOI:10.1016/j.heares.2015.09.001] [PMID]
Littman, T. A., Bobbin, R. P., & Cullen, J. K., Jr. (1991). Histochemical evidence that cochlear efferents are carried with the inferior vestibular nerve in guinea pigs. Hearing Research, 56(1-2), 281–285. [DOI:10.1016/0378-5955(91)90178-C] [PMID]
McFadden, D., Walsh, K. P., Pasanen, E. G., & Grenwelge, E. M. (2010). Overshoot using very short signal delays. The Journal of the Acoustical Society of America, 128(4), 1915–1921. [DOI:10.1121/1.3480568] [PMID]
Nieder, P., & Nieder, I. (1970). Antimasking effect of crossed olivocochlear bundle stimulation with loud clicks in guinea pig. Experimental Neurology, 28(1), 179–188. [DOI:10.1016/0014-4886(70)90172-X] [PMID]
Oatman, L. C. (1976). Effects of visual attention on the intensity of auditory evoked potentials. Experimental Neurology, 51(1), 41–53.[DOI:10.1016/0014-4886(76)90052-2] [PMID]
Overson, G. J., Bacon, S. P., & Webb, T. M. (1996). The effect of level and relative frequency region on the recovery of overshoot. The Journal of the Acoustical Society of America, 99(2), 1059–1065. [DOI:10.1121/1.415232] [PMID]
Rajan, R. (1990). The effect of upper pontine transections on normal cochlear responses and on the protective effects of contralateral acoustic stimulation in barbiturate-anaesthetized normal-hearing guinea pigs. Hearing Research, 45(1-2), 137-144. [DOI:10.1016/0378-5955(90)90189-V]
Rasmussen, G. L. (1946). The olivary peduncle and other fiber projections of the superior olivary complex. The Journal of Comparative Neurology, 84, 141–219. [DOI:10.1002/cne.900840204] [PMID]
Robertson, D., & Gummer, M. (1985). Physiological and morphological characterization of efferent neurones in the guinea pig cochlea. Hearing Research, 20(1), 63–77. [DOI:10.1016/0378-5955(85)90059-0] [PMID]
Scharf, B., Magnan, J., & Chays, A. (1997). On the role of the olivocochlear bundle in hearing: 16 case studies. Hearing Research, 103(1-2), 101-122. [DOI:10.1016/S0378-5955(96)00168-2]
Schmidt, S., & Zwicker, E. (1991). The effect of masker spectral asymmetry on overshoot in simultaneous masking. The Journal of the Acoustical Society of America, 89(3), 1324–1330. [DOI:10.1121/1.400656] [PMID]
Smith, C. A. (1961). Innervation pattern of the cochlea. The internal hair cell. Transactions of the American Laryngological, Rhinological and Otological Society, Inc 49, 35-60. [PMID]
Smith, C. A., & Rasmussen, G. L. (1965). Degeneration in the efferent nerve endings in the cochlea after axonal section. The Journal of Cell Biology, 26(1), 63–77. [DOI:10.1083/jcb.26.1.63] [PMID]
Tomchik, S., & Lu, Z. (2006). Modulation of Auditory Signal-to-Noise Ratios by Efferent Stimulation. Journal of Neurophysiology, 95(6), 3562–3570. [DOI:10.1152/jn.00063.2006] [PMID]
von Klitzing, R., & Kohlrausch, A. (1994). Effect of masker level on overshoot in running- and frozen-noise maskers. The Journal of the Acoustical Society of America, 95(4), 2192–2201. [DOI:10.1121/1.408679] [PMID]
Walsh, E. J., McGee, J., McFadden, S. L., & Liberman, M. C. (1998).Long-term effects of sectioning the olivocochlear bundle in neonatal cats. The Journal of Neuroscience: The Official Journal of the Society for Neuroscience, 18(10), 3859–3869. [DOI:10.1523/JNEUROSCI.18-10-03859.1998] [PMID]
Walsh, K. P., Pasanen, E. G., & McFadden, D. (2010). Overshoot measured physiologically and psychophysically in the same human ears. Hearing Research, 268(1-2), 22–37. [DOI:10.1016/j.heares.2010.04.007] [PMID]
Warr, W. B., Boche, J. B., & Neely, S. T. (1997). Efferent innervation of the inner hair cell region: Origins and terminations of two lateral olivocochlear systems. Hearing Research, 108(1-2), 89-111. [DOI:10.1016/S0378-5955(97)00044-0]
Warr, W. B., & Guinan, J. J., Jr. (1979). Efferent innervation of the organ of corti: two separate systems. Brain Research, 173(1), 152–155. [DOI:10.1016/0006-8993(79)91104-1] [PMID]
Wright, C. G., & Preston, R. E. (1973). Degeneration and distribution of efferent nerve fibers in the guinea pig organ of Corti. A light and scanning electron microscopic study. Brain Research, 58(1), 37–59. [DOI:10.1016/0006-8993(73)90822-6] [PMID]
Zheng, X. Y., Henderson, D., McFadden, S. L., Ding, D. L., & Salvi, R. J. (1999). Auditory nerve fiber responses following chronic cochlear de-efferentation. The Journal of comparative Neurology, 406(1), 72–86. [PMID]
Type of Study: Original |
Subject:
Cellular and molecular Neuroscience
Received: 2024/07/14 | Accepted: 2025/01/24 | Published: 2025/03/1
Received: 2024/07/14 | Accepted: 2025/01/24 | Published: 2025/03/1
Send email to the article author
| Rights and permissions | |
 |
This work is licensed under a Creative Commons Attribution-NonCommercial 4.0 International License. |
![]()
Copyright © The Author(s);
This is an open access article distributed under the terms of the Creative Commons Attribution License (CC-By-NC), which permits use, distribution, and reproduction in any medium, provided the original work is properly cited and is not used for commercial purposes.
Contact Information
