

Volume 8, Issue 4 (July & August 2017 -- 2017)
BCN 2017, 8(4): 285-298 |
Back to browse issues page


Download citation:
BibTeX | RIS | EndNote | Medlars | ProCite | Reference Manager | RefWorks
Send citation to:


BibTeX | RIS | EndNote | Medlars | ProCite | Reference Manager | RefWorks
Send citation to:
Zare Sadeghi A, Jafari A H, Oghabian M A, Salighehrad H R, Batouli S A H, Raminfard S et al . Changes in Effective Connectivity Network Patterns in Drug Abusers, Treated With Different Methods. BCN 2017; 8 (4) :285-298
URL: http://bcn.iums.ac.ir/article-1-760-en.html
URL: http://bcn.iums.ac.ir/article-1-760-en.html
Arash Zare Sadeghi1 
 , Amir Homayoun Jafari *2 , Mohammad Ali Oghabian1 , Hamid Reza Salighehrad1 , Seyed Amir Hossein Batouli2 , Samira Raminfard2 , Hamed Ekhtiari2
, Amir Homayoun Jafari *2 , Mohammad Ali Oghabian1 , Hamid Reza Salighehrad1 , Seyed Amir Hossein Batouli2 , Samira Raminfard2 , Hamed Ekhtiari2
1- Department of Medical Physics and Biomedical Engineering, School of Medicine, Tehran University of Medical Sciences, Tehran, Iran.
2- Department of Nouroimaging and Analysis, Imam Khomeini Hospital Complex, Tehran University of Medical Sciences, Tehran, Iran.
2- Department of Nouroimaging and Analysis, Imam Khomeini Hospital Complex, Tehran University of Medical Sciences, Tehran, Iran.
Keywords: Dynamic causal modeling, Functional magnetic resonance imaging, Abstinent based therapy, Methadone maintenance therapy
Full-Text [PDF 818 kb]
| Abstract (HTML)

Full-Text:
1. Introduction
The neurocognitive process of drug craving in chronic drug abusers has been studied before and the brain regions involved in this process are well recognized (Wilson, Sayette, & Fiez, 2004; Sutherland, McHugh, Pariyadath, & Stein, 2012; Tang, Fellows, Small, & Dagher, 2012; Yalachkov, Kaiser, Naumer, 2012). Previous studies have reported the key role of the amygdala and prefrontal cortex in the cue-induced craving process (Bechara, Damasio, Damasio, & Lee, 1999). When exposed to drug cues, the brain regions, such as ventromedial prefrontal cortex (VMPFC) (Ben-Shahar, et al. 2013), dorsolateral prefrontal cortex (DLPFC) (Wilson et al. 2004; George and Koob 2013; Hayashi, Ko, Strafella, & Dagher, 2013; Batista, Klauss, Fregni, Nitsche, & Nakamura-Palacios, 2015), ventral striatum (Naqvi and Bechara 2009), and amygdala (Bechara, Damasio, & Damasio, 2003) display activation in different drug dependents.
The associated brain regions do not act alone but work as parts of hidden networks. The recent studies have tried to find out and quantify these networks (Chase, Eickhoff, Laird, & Hogarth 2011; Sutherland et al., 2013). The existing interactions between brain regions (nodes) can be passive or active; the passive type is called functional connectivity and the active one effective connectivity. Effective connectivity follows the theory of causality (Pearl, 2009). The causality in brain networks has been studied before, but the drug craving networks have been investigated in a few studies (Ray, Haney, Hanson, Biswal, & Hanson, 2015). Based on some studies, chronic drug use can change the pattern of brain activation networks in drug dependents when exposing to drug cues (Goudriaan, de Ruiter, Van Den Brink, Oosterlaan, & Veltman 2010; Janes, et al. 2010; Ma, et al, 2011; Lu, et al., 2012; Cisler, et al., 2013; Ding and Lee 2013a; Ding and Lee 2013b; Yang, et al., 2014). Furthermore, the regulatory effect of cortex on subcortical regions has already been proven, and their interactions follow a causal network pattern (Bechara, et al., 2001).
The causal networks can be quantified using different methods. Some methods address just the existence of the networks, but some other seek deeper to find more details. Two interesting issues in these networks are first how regions affect each other and second how they affect the relation among the regions. These networks can be quantified using effective connectivity measurement methods such as Structural Equation Modeling (SEM) (McLntosh & Gonzalez-Lima 1994; Buchel, 1997; Astolfi, et al. 2004; Laird, et al., 2008), Granger causality modeling (GCM) (Roebroeck, Formisano, Goebel, 2005; Wang, Chen, Bressler, & Ding. 2007; Sato, et al., 2010), and dynamic causal modeling (DCM).
We hypothesized that the fronto-amygdalar regulation is complex and not only the prefrontal regions such as VMPFC and DLPFC have reciprocal modulatory effects on the amygdala, but also they have indirect causal effects. The differences in the effective connectivity networks were investigated between the following three groups in our study: one group included subjects with no history of drug dependence as the control group, one group included subjects who were successfully treated drug abuse with Methadone Maintenance Therapy (MMT), and the last group included subjects who were successfully treated drug abusers with Abstinence Based Therapy (ABT) method.
2. Methods
The Ethics Committee of Tehran University of Medical Sciences approved the study protocol and consent form. Before scanning, the imaging procedure was described for all subjects and their written informed consents were obtained. After scanning, a counseling procedure was done for each subject to check for any probable adverse effect on the subject’s mental health, after presentation of drug-related cues.
2.1. Participants
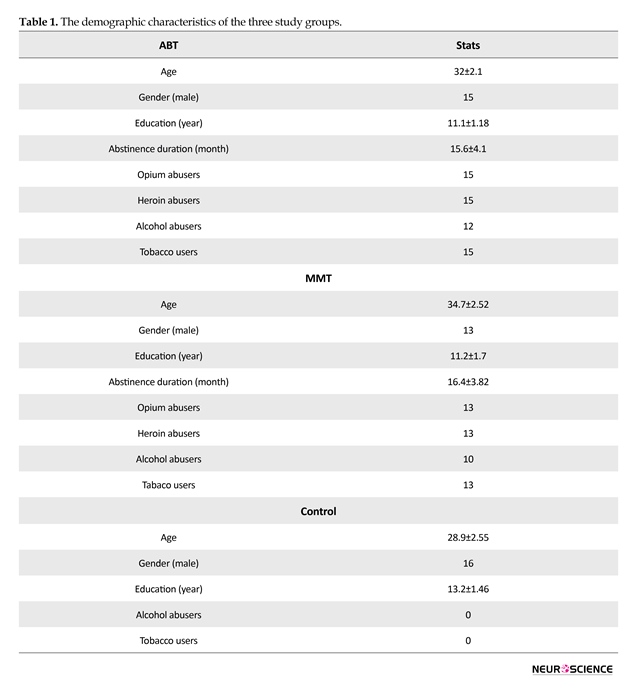
Three study groups, each including 20 male subjects, were scanned. One group included subjects (with at least 3 months of opiate abstinence) who were successfully treated by MMT based method; the second group (with at least 3 months of opiate abstinence) included subjects who were successfully treated by ABT based method; and the third group comprised control subjects age-matched with two other groups, who did not have any history of drug abuse. The demographic characteristics of the three groups are presented in Table 1.
2.2. Functional magnetic resonance imaging task
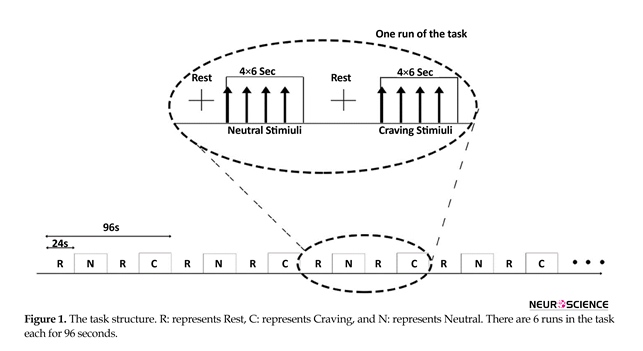
The task was a block design task containing 6 consecutive runs. Each run included one rest block of 24 s length (a cross was shown), one block of 24 s length as neutral (4 images not related to heroin, each for 6 s, were shown to the subject), a second rest block, and a block of 24 s length as craving stimuli (4 images related to heroin, each for 6 s, were shown to the subject). The images (24 heroin-related and 24 neutral) were selected from International Affective Picture System (Lang, Bradley, & Cuthbert, 2005). The structure of the task is displayed in Figure 1.
2.3. Functional magnetic resonance imaging data acquisition
Functional images were acquired with an Avanto 1.5T scanner (Siemens, Germany) with 8 channel head coil. The T2*-weighted images were acquired with TR=3000 ms, TE=50 ms, flip angel=90°, voxel size of 3×3×3 mm3, and matrix size of 64×64. Each volume was composed of 36 slices which covered the whole brain in axial direction. Structural image was acquired with the following specification: T1-weighted with TR=1910, TE=3.55 ms, flip angel=30°, voxel size of 1×1×1 mm3, and matrix size of 256×256. The stimuli were presented using MR compatible goggles.
2.4. Preprocessing
FSL5 (Jenkinson, Beckmann, Behrens, Woolrich, Smith, 2012) MCFLIRT (Jenkinson & Smith 2001; Jenkinson, Bannister, Brady, & Smith, 2002) was used to correct the EPI images for the head motion. Slice timing correction was done using interleaved order, high-pass temporal filtering was done with the size of 96 s to remove the signal trend, a 3D Gaussian kernel with the size of 5 mm FWHM was used to smooth the functional images, and for group comparison the intensity normalization was done as the last part of the preprocessing step.
2.5. Data analysis
The purpose of this study was not to examine the between group differences with regard to regional activations, so we did only within group analyses. Using FLAME (FMRIB’s Local Analysis of Mixed Effects), we included all 4 possible contrasts; i.e., craving, neutral, craving>neutral, and neutral>craving. Based on the results, only the craving>neutral contrast supports the idea of stronger activation during watching craving cues vs. watching neutral images.
2.6. Time-series extraction
According to our neuroscientific hypothesis, we chose 4 regions of interests (ROIs): VMPFC, DLPFC, ventral striatum, and amygdala. These regions have been shown to be active during a drug craving task. First we made a mask for each region in MNI space, then using transformation matrices, the masks were resliced and registered to each subject’s EPI images. These matrices were calculated during registration in preprocessing step (standard2example_func.mat) and applied using the ApplyXFM tool in FSL5. The greatest eigenvariate of the voxels in each region was used as the time-series of the ROI. The extraction of eigenvariates from the time series across the voxels within each ROI was done using a singular value decomposition (SVD) method (Alter, Brown, Botstein, 2000). We used SPM12 Eigenvariate Tool for achieving this purpose.
2.7. Dynamic causal modeling
Effective connectivity means the causal interrelation of the regions in the brain; however, this relation is in the neuronal level which cannot be measured by fMRI. Dynamic causal modeling as an established method to quantify the effective connectivity includes 4 connectivity matrices which display the strength of interconnections. The first matrix (A) contains the strength of endogenous links; these are the interrelations of regions in the absence of any input, the second matrix (B) contains the strength related to the effects of inputs on the links between regions, the third matrix (C) contains the direct strength of links of input effects on the regions and the last matrix (D) shows the strength of nonlinear links, which exerts from regions on the links connecting other regions. The equation which dominates the relation of these matrices is as follows:
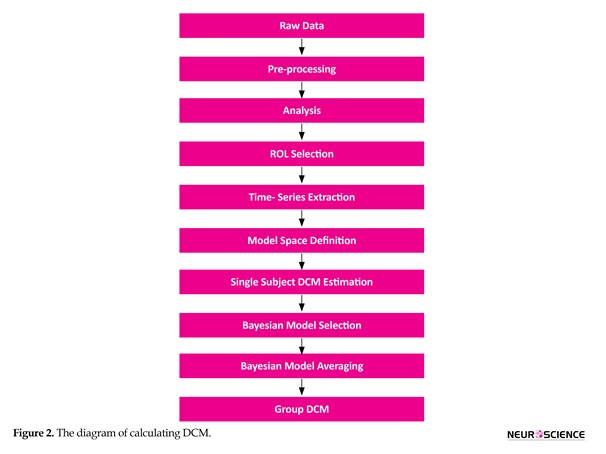
Computing DCM for a group of subjects include some steps, which are shown in the Figure 2. Our model space contained 38 models, which reciprocally connected 4 regions; the craving input emerged to various regions; linear and nonlinear links; and self-inhibitory links. The diverse models in the model space were used to answer different neuroscientific questions. Next we estimated all models for each subject to reach the exceedance probability measure for single subject analysis and these measures were used in the Bayesian model selection (BMS) (Stephan, Penny, Daunizeau, Moran, & Friston, 2009) process to compare the models. Evidently, comparing single models does not simply provide any useful information, however, dividing the model space into families with similar features can yield the best result (Penny, et al., 2010). Thus, we divided the models into families according to their nonlinear links; separating linear and nonlinear models. Bayesian Model Averaging (BMA) was used to reach the final model. Also, we used SPM DCM12 Toolbox for computing the DCM network.
3. Results
3.1. GLM results
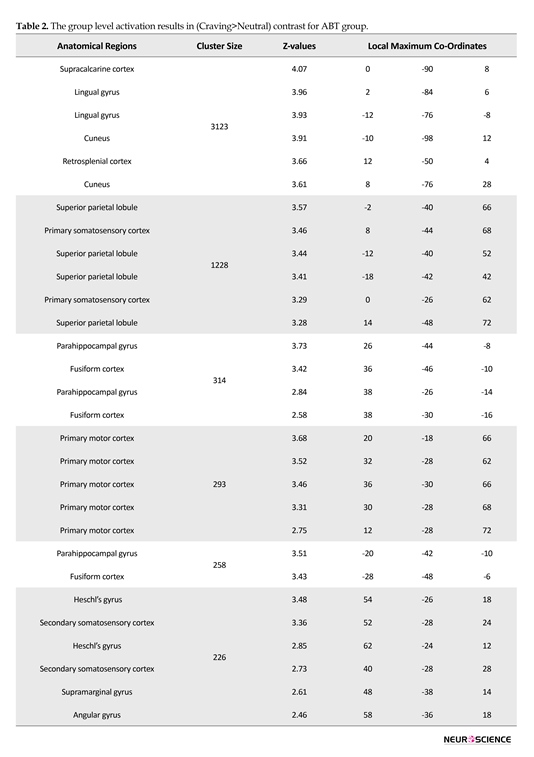
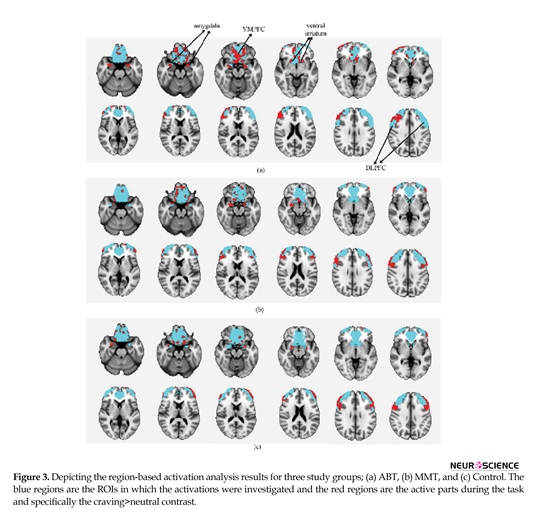
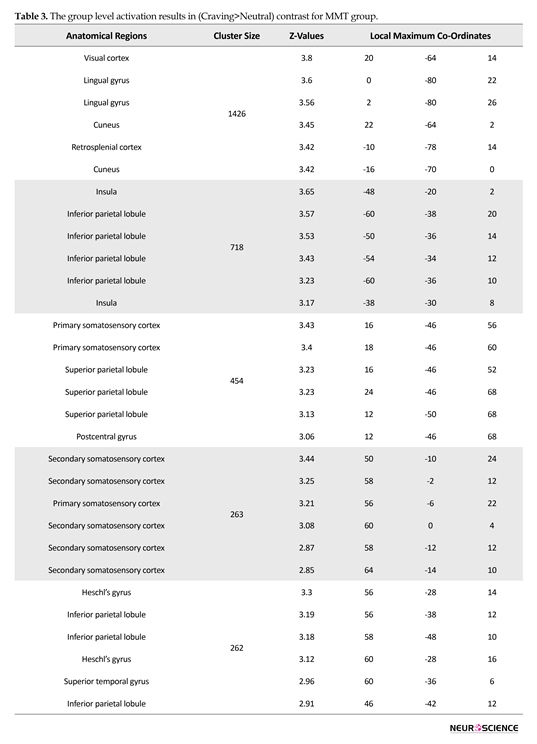
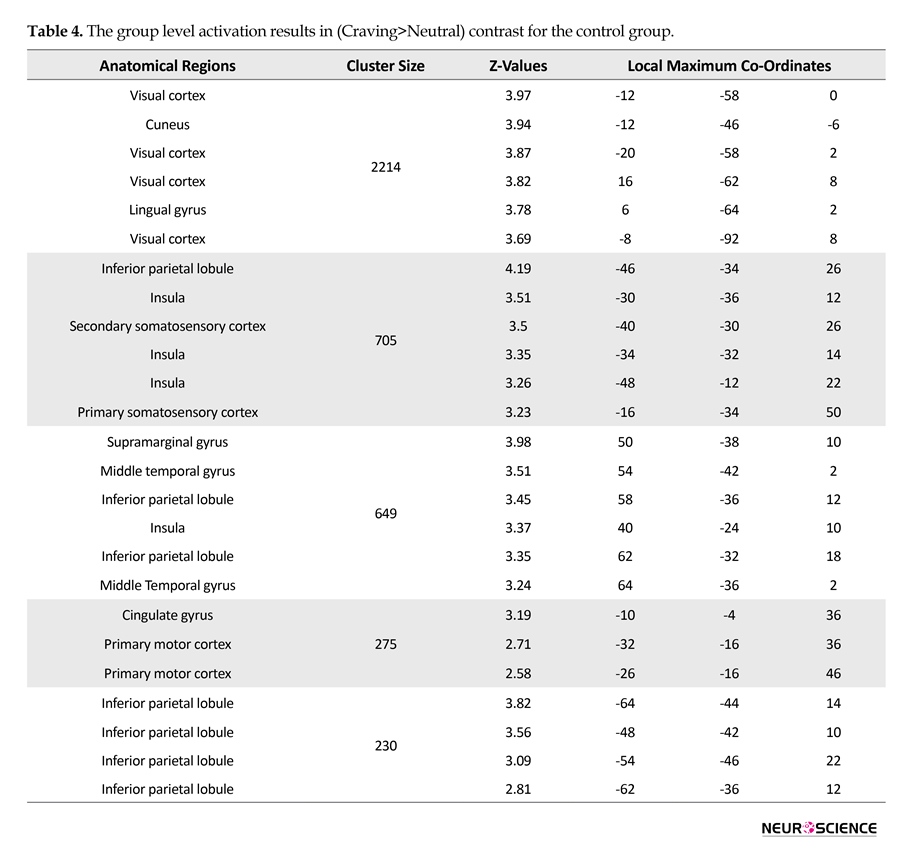
Statistical analysis of fMRI data of each group was done using FSL5 and the results indicated activations in all regions of interest. Figure 3 depicts the activation patterns in one of the defined contrasts (craving>neutral) and Tables 2, 3, and 4 present the group level results for all study groups (same contrast).
3.2. Dynamic causal modeling results
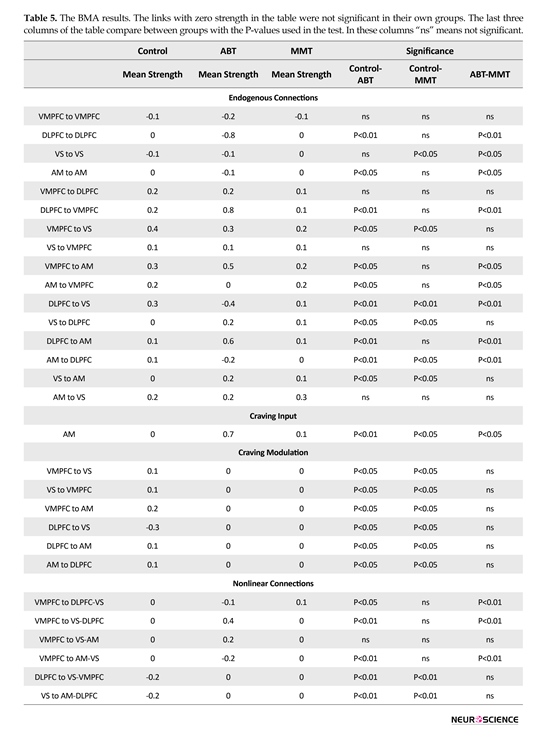
The time-series of each region was extracted according to the method introduced in the previous section. The DCM estimation process was done for each model in the model space and the resulting exceedance probabilities were used in the process of BMS algorithm. Family partitioning was done according to the nonlinear links and using BMA, the final DCM networks for all groups were calculated. The BMA results are presented in Table 5. Considering 4 connectivity matrices, this table is divided into 4 sections (highlighted with gray color).
The first section included the endogenous connections or the matrix A, the second section included the matrix B, the third section included matrix C, and the last included matrix D. The first column of the table presents the start and the end of each connection (for connections which do not exist in all groups, there are no rows). The next 3 columns are the mean strength of the named connection for each group. Zero number in the cells represents the lack of that connection in the relevant group. The numbers in these 3 columns represent different meanings with regard to effective connectivity theory; the change in the variance of the links starting point will change the variance of the links ending point by the factor of the links mean strength. The sign of the number is directly related to the correlation of the variance change in two signals; positive means directly correlated and negative means correlation
The neurocognitive process of drug craving in chronic drug abusers has been studied before and the brain regions involved in this process are well recognized (Wilson, Sayette, & Fiez, 2004; Sutherland, McHugh, Pariyadath, & Stein, 2012; Tang, Fellows, Small, & Dagher, 2012; Yalachkov, Kaiser, Naumer, 2012). Previous studies have reported the key role of the amygdala and prefrontal cortex in the cue-induced craving process (Bechara, Damasio, Damasio, & Lee, 1999). When exposed to drug cues, the brain regions, such as ventromedial prefrontal cortex (VMPFC) (Ben-Shahar, et al. 2013), dorsolateral prefrontal cortex (DLPFC) (Wilson et al. 2004; George and Koob 2013; Hayashi, Ko, Strafella, & Dagher, 2013; Batista, Klauss, Fregni, Nitsche, & Nakamura-Palacios, 2015), ventral striatum (Naqvi and Bechara 2009), and amygdala (Bechara, Damasio, & Damasio, 2003) display activation in different drug dependents.
The associated brain regions do not act alone but work as parts of hidden networks. The recent studies have tried to find out and quantify these networks (Chase, Eickhoff, Laird, & Hogarth 2011; Sutherland et al., 2013). The existing interactions between brain regions (nodes) can be passive or active; the passive type is called functional connectivity and the active one effective connectivity. Effective connectivity follows the theory of causality (Pearl, 2009). The causality in brain networks has been studied before, but the drug craving networks have been investigated in a few studies (Ray, Haney, Hanson, Biswal, & Hanson, 2015). Based on some studies, chronic drug use can change the pattern of brain activation networks in drug dependents when exposing to drug cues (Goudriaan, de Ruiter, Van Den Brink, Oosterlaan, & Veltman 2010; Janes, et al. 2010; Ma, et al, 2011; Lu, et al., 2012; Cisler, et al., 2013; Ding and Lee 2013a; Ding and Lee 2013b; Yang, et al., 2014). Furthermore, the regulatory effect of cortex on subcortical regions has already been proven, and their interactions follow a causal network pattern (Bechara, et al., 2001).
The causal networks can be quantified using different methods. Some methods address just the existence of the networks, but some other seek deeper to find more details. Two interesting issues in these networks are first how regions affect each other and second how they affect the relation among the regions. These networks can be quantified using effective connectivity measurement methods such as Structural Equation Modeling (SEM) (McLntosh & Gonzalez-Lima 1994; Buchel, 1997; Astolfi, et al. 2004; Laird, et al., 2008), Granger causality modeling (GCM) (Roebroeck, Formisano, Goebel, 2005; Wang, Chen, Bressler, & Ding. 2007; Sato, et al., 2010), and dynamic causal modeling (DCM).
We hypothesized that the fronto-amygdalar regulation is complex and not only the prefrontal regions such as VMPFC and DLPFC have reciprocal modulatory effects on the amygdala, but also they have indirect causal effects. The differences in the effective connectivity networks were investigated between the following three groups in our study: one group included subjects with no history of drug dependence as the control group, one group included subjects who were successfully treated drug abuse with Methadone Maintenance Therapy (MMT), and the last group included subjects who were successfully treated drug abusers with Abstinence Based Therapy (ABT) method.
2. Methods
The Ethics Committee of Tehran University of Medical Sciences approved the study protocol and consent form. Before scanning, the imaging procedure was described for all subjects and their written informed consents were obtained. After scanning, a counseling procedure was done for each subject to check for any probable adverse effect on the subject’s mental health, after presentation of drug-related cues.
2.1. Participants
Three study groups, each including 20 male subjects, were scanned. One group included subjects (with at least 3 months of opiate abstinence) who were successfully treated by MMT based method; the second group (with at least 3 months of opiate abstinence) included subjects who were successfully treated by ABT based method; and the third group comprised control subjects age-matched with two other groups, who did not have any history of drug abuse. The demographic characteristics of the three groups are presented in Table 1.
2.2. Functional magnetic resonance imaging task
The task was a block design task containing 6 consecutive runs. Each run included one rest block of 24 s length (a cross was shown), one block of 24 s length as neutral (4 images not related to heroin, each for 6 s, were shown to the subject), a second rest block, and a block of 24 s length as craving stimuli (4 images related to heroin, each for 6 s, were shown to the subject). The images (24 heroin-related and 24 neutral) were selected from International Affective Picture System (Lang, Bradley, & Cuthbert, 2005). The structure of the task is displayed in Figure 1.
2.3. Functional magnetic resonance imaging data acquisition
Functional images were acquired with an Avanto 1.5T scanner (Siemens, Germany) with 8 channel head coil. The T2*-weighted images were acquired with TR=3000 ms, TE=50 ms, flip angel=90°, voxel size of 3×3×3 mm3, and matrix size of 64×64. Each volume was composed of 36 slices which covered the whole brain in axial direction. Structural image was acquired with the following specification: T1-weighted with TR=1910, TE=3.55 ms, flip angel=30°, voxel size of 1×1×1 mm3, and matrix size of 256×256. The stimuli were presented using MR compatible goggles.
2.4. Preprocessing
FSL5 (Jenkinson, Beckmann, Behrens, Woolrich, Smith, 2012) MCFLIRT (Jenkinson & Smith 2001; Jenkinson, Bannister, Brady, & Smith, 2002) was used to correct the EPI images for the head motion. Slice timing correction was done using interleaved order, high-pass temporal filtering was done with the size of 96 s to remove the signal trend, a 3D Gaussian kernel with the size of 5 mm FWHM was used to smooth the functional images, and for group comparison the intensity normalization was done as the last part of the preprocessing step.
2.5. Data analysis
The purpose of this study was not to examine the between group differences with regard to regional activations, so we did only within group analyses. Using FLAME (FMRIB’s Local Analysis of Mixed Effects), we included all 4 possible contrasts; i.e., craving, neutral, craving>neutral, and neutral>craving. Based on the results, only the craving>neutral contrast supports the idea of stronger activation during watching craving cues vs. watching neutral images.
2.6. Time-series extraction
According to our neuroscientific hypothesis, we chose 4 regions of interests (ROIs): VMPFC, DLPFC, ventral striatum, and amygdala. These regions have been shown to be active during a drug craving task. First we made a mask for each region in MNI space, then using transformation matrices, the masks were resliced and registered to each subject’s EPI images. These matrices were calculated during registration in preprocessing step (standard2example_func.mat) and applied using the ApplyXFM tool in FSL5. The greatest eigenvariate of the voxels in each region was used as the time-series of the ROI. The extraction of eigenvariates from the time series across the voxels within each ROI was done using a singular value decomposition (SVD) method (Alter, Brown, Botstein, 2000). We used SPM12 Eigenvariate Tool for achieving this purpose.
2.7. Dynamic causal modeling
Effective connectivity means the causal interrelation of the regions in the brain; however, this relation is in the neuronal level which cannot be measured by fMRI. Dynamic causal modeling as an established method to quantify the effective connectivity includes 4 connectivity matrices which display the strength of interconnections. The first matrix (A) contains the strength of endogenous links; these are the interrelations of regions in the absence of any input, the second matrix (B) contains the strength related to the effects of inputs on the links between regions, the third matrix (C) contains the direct strength of links of input effects on the regions and the last matrix (D) shows the strength of nonlinear links, which exerts from regions on the links connecting other regions. The equation which dominates the relation of these matrices is as follows:
Computing DCM for a group of subjects include some steps, which are shown in the Figure 2. Our model space contained 38 models, which reciprocally connected 4 regions; the craving input emerged to various regions; linear and nonlinear links; and self-inhibitory links. The diverse models in the model space were used to answer different neuroscientific questions. Next we estimated all models for each subject to reach the exceedance probability measure for single subject analysis and these measures were used in the Bayesian model selection (BMS) (Stephan, Penny, Daunizeau, Moran, & Friston, 2009) process to compare the models. Evidently, comparing single models does not simply provide any useful information, however, dividing the model space into families with similar features can yield the best result (Penny, et al., 2010). Thus, we divided the models into families according to their nonlinear links; separating linear and nonlinear models. Bayesian Model Averaging (BMA) was used to reach the final model. Also, we used SPM DCM12 Toolbox for computing the DCM network.
3. Results
3.1. GLM results
Statistical analysis of fMRI data of each group was done using FSL5 and the results indicated activations in all regions of interest. Figure 3 depicts the activation patterns in one of the defined contrasts (craving>neutral) and Tables 2, 3, and 4 present the group level results for all study groups (same contrast).
3.2. Dynamic causal modeling results
The time-series of each region was extracted according to the method introduced in the previous section. The DCM estimation process was done for each model in the model space and the resulting exceedance probabilities were used in the process of BMS algorithm. Family partitioning was done according to the nonlinear links and using BMA, the final DCM networks for all groups were calculated. The BMA results are presented in Table 5. Considering 4 connectivity matrices, this table is divided into 4 sections (highlighted with gray color).
The first section included the endogenous connections or the matrix A, the second section included the matrix B, the third section included matrix C, and the last included matrix D. The first column of the table presents the start and the end of each connection (for connections which do not exist in all groups, there are no rows). The next 3 columns are the mean strength of the named connection for each group. Zero number in the cells represents the lack of that connection in the relevant group. The numbers in these 3 columns represent different meanings with regard to effective connectivity theory; the change in the variance of the links starting point will change the variance of the links ending point by the factor of the links mean strength. The sign of the number is directly related to the correlation of the variance change in two signals; positive means directly correlated and negative means correlation


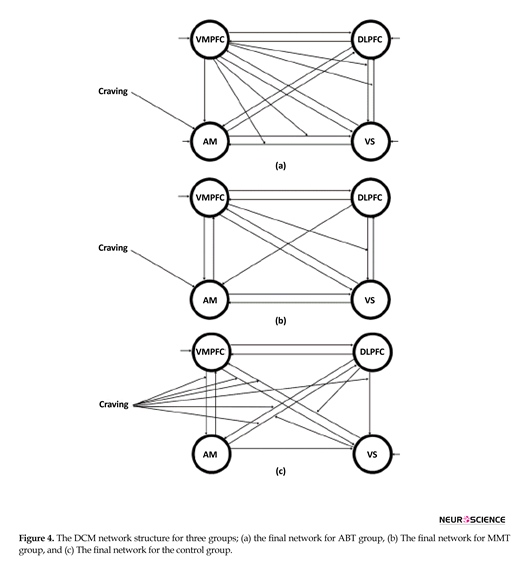
with phase lag of 180°. The last 3 columns of the table present significant statistically meaningful differences between the groups (top of each column) in that link (the first column). These networks are depicted in Figure 4.
With regard to the effective connectivity network for the control group, the craving input link only modulated the links between the regions, but there was no modulation for the other two groups and the input link only affected the amygdala. In the control group, DLPFC and amygdala affected ventral striatum but were not influenced by it. In the ABT group, VMPFC affected amygdala but there was no reverse effect. Finally in the MMT group, the relation from DLPFC to amygdala was a 1-way connection. Self-inhibitory connections in the control group were limited to VMPFC and ventral striatum regions. In the MMT group, only VMPFC had this self-inhibitory effect, while in the ABT group, all regions had the self-inhibitory effect. In the control group, DLPFC affected the connection of ventral striatum to VMPFC, and ventral striatum itself affected the connection of amygdala to DLPFC. In the ABT group, VMPFC influenced reciprocal connections between DLPFC and ventral striatum and also the connections between ventral striatum and amygdala. In the MMT group, the nonlinear link was from VMPFC to the link from DLPFC to ventral striatum.
4. Discussion
There are studies addressing the results of various treatment methods on drug abusers, but there is no conclusive evidence for superiority of any treatment method over others (Wang, et al., 2011). In addition, studies have shown

different brain activation patterns for treated subjects, however, currently there is no direct study of brain effective connectivity differences between variously treated subjects. The effective connectivity estimation can measure the regulatory effects of regions and craving cues on the different parts of the brain network and helps in better understanding of the craving mechanism (Kober, et al., 2010).
We investigated the effective connectivity network in 3 groups. Two groups included successfully treated drug abusers, with different treatment methods; one with MMT and the other with ABT. The third group included individuals with no history of drug abuse. The results of the last group helped us provide a basic network for brain effective connectivity pattern, when no prior bias exist. The networks were estimated between 4 regions of interest which were mentioned in previous studies. Studies have indicated that cue exposure increases craving and results in more activities in these regions. These regions are also associated with emotion.
The implication of prefrontal regions in cognitive control (Wrase, et al., 2007; de Greck, et al., 2009) and its regulatory effect on emotion specific regions like amygdala and ventral striatum have been already proven (Franklin, et al., 2007; Meda et al., 2009). The resulted networks showed the active role of these regions in the network and by using DCM, the difference of the networks between these 3 groups were depicted numerically and structurally.
4.1. The craving input effect
The differences between the control group and two treated groups indicated that the cue-induced pictures did

not affect the emotion of healthy subjects, but affected amygdala, causing emotional indices in the other groups. To the healthy subjects, these pictures seem as neutral pictures and only modulate some of the links in the network (as perturbations for the task). This finding is in accordance with previous studies which mentioned the role of amygdala in cue-induced tasks in subjects with a history of drug abuse (Bechara, et al., 1999; Bechara, et al., 2003; Goudriaan, et al., 2010; Chase, et al., 2011; Tang et al., 2012; Ray, et al., 2015).
4.2. The modulatory effect of ventromedial prefrontal cortex
Studies have already proven the role of prefrontal-striatal pathway in the control of craving to drug use (Koob, 2001; Volkow, Fowler, Wang, 2003; Everitt & Robbins, 2005). The lack of control over drug taking is considered a sign of addiction and is critical in relapse. Frontal brain regions have an important role in inhibitory control of this behavior. It has been shown that VMPFC has modulatory effects on other regions, including amygdale and ventral striatum in the cue-induced craving tasks (Bechara, et al., 1999; Bechara 2005; Lu, et al., 2012; Sladky, et al., 2013). In our study by considering the modulatory effect of VMPFC on other interregional connections, it was revealed that in healthy subjects there was no modulatory effects, as they did not have any emotional responses to craving specific pictures.

However, the VMPFC modulatory effects in ABT group indicate the important role of this region in drug resistance among these subjects. This group are trained to resist drug taking and the results reveal that the VMPFC acts as a part of top neural system, which tries to control the emotional decisions. This finding is in accordance with the findings of prior studies on the regulation of negative emotions (Ochsner & Gross, 2008) and positive emotions (Kim and Hamann, 2007; Delgado, Gillis, Phelps, 2008). They reported the activation of these prefrontal systems and suggested the role of cognition to regulate responses to affective cues; for example drug cues. In the MMT group, we did not expect to observe any modulatory effect as the subjects took a dose of methadone and they would seem to have normal behavior when encountering cue-induced images. The only modulatory effect of VMPFC in this group was observed in the DLPFC-ventral striatum link, which was not statistically different from the control group who did not have this link (in the control group this link was not statistically significant).
The importance of DLPFC as a part of prefrontal cortical area has been highlighted in previous addictive-cue studies (Goldstein & Volkow, 2002; Wilson et al., 2004; Goldstein, et al., 2007; Volkow, Fowler, Wang, Baler, & Telang, 2009). The neural activity of DLPFC may be modulated by sensory information, motivational state, and task contingencies (Miller, 2000). In our study, DLPFC exhibited an important role in regulatory processing of cognitive and motivationally relevant information.
In this study, we identified 3 effective connectivity networks for 3 different groups, with various structures and links strength. These results can prove the different effects of treatment methods and their underlying neuronal mechanisms. The vast modulatory effect of VMPFC occur only in ABT group. This effect can prove the inhibitory role of this brain region in drug craving and also indicate the successful treatment of the subjects in this group, as the main target of this treatment is to train the patients to control their craving. The modulatory effect of VMPFC in MMT group, in contrast with the other treatment group, is a single effect which can exist because of the anatomical connections between these regions.
In the control group, the input data did not directly affect the regions and only modulates the links. In this network, input is on when the craving images are shown and is off in other situations. Thus, the input can be interpreted as watching craving-related images and this exclusive modulatory effect can be the result of subjects’ inattentiveness to these cues. These results cannot prove the superiority of one method over another but at least may help choose the best method for different subjects in various situations.
Acknowledgements
The present paper was extracted from the PhD thesis of the first author in the Department of Medical Physics and Biomedical Engineering, School of Medicine, Tehran University of Medical Sciences.
Conflict of Interest
The authors declared no conflicts of interest.
References
Alter, O., Brown, P. O., & Botstein, D. (2000). Singular value decomposition for genome-wide expression data processing and modeling. Proceedings of the National Academy of Sciences, 97(18), 10101–6. doi: 10.1073/pnas.97.18.10101
Astolfi, L., Cincotti, F., Mattia, D., Salinari, S., Babiloni, C., Basilisco, A., et al. (2004). Estimation of the effective and functional human cortical connectivity with structural equation modeling and directed transfer function applied to high-resolution EEG. Magnetic Resonance Imaging, 22(10), 1457–70. doi: 10.1016/j.mri.2004.10.006
Batista, E. K., Klauss, J., Fregni, F., Nitsche, M. A., & Nakamura-Palacios, E. M. (2015). A randomized placebo-controlled trial of targeted prefrontal cortex modulation with bilateral tdcs in patients with crack-cocaine dependence. International Journal of Neuropsychopharmacology, 18(12), 66. doi: 10.1093/ijnp/pyv066
Bechara, A. (2005). Decision making, impulse control and loss of willpower to resist drugs: A neurocognitive perspective. Nature Neuroscience, 8(11), 1458–63. doi: 10.1038/nn1584
Bechara, A., Damasio, H., & Damasio, A. R. (2003). Role of the amygdala in decision-making. Annals of the New York Academy of Sciences, 985(1), 356–9. doi: 10.1111/j.1749-6632.2003.tb07094.x
Bechara, A., Damasio, H., Damasio, A. R. & Lee, G. P. (1999). Different contributions of the human amygdala and ventromedial prefrontal cortex to decision-making. Journal of Neuroscience 19(13), 5473-5481. PMID: 10377356
Bechara, A., Dolan, S., Denburg, N., Hindes, A., Anderson, S. W., & Nathan P. E. (2001). Decision-making deficits, linked to a dysfunctional ventromedial prefrontal cortex, revealed in alcohol and stimulant abusers. Neuropsychologia, 39(4), 376-89. PMID: 11164876
Ben-Shahar, O., Sacramento, A. D., Miller, B. W., Webb, S. M., Wroten, M. G., Silva, H. E., et al. (2013). Deficits in ventromedial prefrontal cortex group 1 metabotropic glutamate receptor function mediate resistance to extinction during protracted withdrawal from an extensive history of cocaine self-administration. Journal of Neuroscience, 33(2), 495–506. doi: 10.1523/jneurosci.3710-12.2013
Buchel, C. (1997). Modulation of connectivity in visual pathways by attention: cortical interactions evaluated with structural equation modelling and fMRI. Cerebral Cortex, 7(8), 768–78. doi: 10.1093/cercor/7.8.768
Chase, H. W., Eickhoff, S. B., Laird, A. R., & Hogarth, L. (2011). The neural basis of drug stimulus processing and craving: An activation likelihood estimation meta-analysis. Biological Psychiatry, 70(8), 785-93. doi: 10.1016/j.biopsych.2011.05.025
Cisler, J. M., Elton, A., Kennedy, A. P., Young, J., Smitherman, S., Andrew James, G., et al. (2013). Altered functional connectivity of the insular cortex across prefrontal networks in cocaine addiction. Psychiatry Research: Neuroimaging, 213(1), 39–46. doi: 10.1016/j.pscychresns.2013.02.007
de Greck, M., Supady, A., Thiemann, R., Tempelmann, C., Bogerts, B., Forschner, L., et al. (2009). Decreased neural activity in reward circuitry during personal reference in abstinent alcoholics-A fMRI study. Human Brain Mapping, 30(5), 1691–1704. doi: 10.1002/hbm.20634
Delgado, M. R., Gillis, M. M., & Phelps, E. A. (2008). Regulating the expectation of reward via cognitive strategies. Nature Neuroscience, 11(8), 880–1. doi: 10.1038/nn.2141
Ding, X., & Lee, S. W. (2013a). Changes of functional and effective connectivity in smoking replenishment on deprived heavy smokers: a resting-state fMRI study. PLoS ONE, 8(3), 59331. doi: 10.1371/journal.pone.0059331
Ding, X., & Lee, S. W. (2013b). Cocaine addiction related reproducible brain regions of abnormal default-mode network functional connectivity: A group ICA study with different model orders. Neuroscience Letters, 548, 110–4. doi: 10.1016/j.neulet.2013.05.029
Everitt, B. J., & Robbins, T. W. (2005). Neural systems of reinforcement for drug addiction: from actions to habits to compulsion. Nature Neuroscience, 8(11), 1481–9. doi: 10.1038/nn1579
Franklin, T. R., wang, Z., Wang, J., Sciortino, N., Harper, D., Li, Y., et al. (2007). Limbic activation to cigarette smoking cues independent of nicotine withdrawal: A perfusion fMRI study. Neuropsychopharmacology, 32(11), 2301–9. doi: 10.1038/sj.npp.1301371
George, O., & Koob, G. F. (2013). Control of craving by the prefrontal cortex. Proceedings of the National Academy of Sciences, 110(11), 4165–6. doi: 10.1073/pnas.1301245110
Goldstein, R. Z., Tomasi, D., Rajaram, S., Cottone, L. A., Zhang, L., Maloney, T., et al. (2007). Role of the anterior cingulate and medial orbitofrontal cortex in processing drug cues in cocaine addiction. Neuroscience 144(4): 1153-9.
Goldstein, R. Z., & Volkow, N. D. (2002). Drug Addiction and Its Underlying Neurobiological Basis: Neuroimaging Evidence for the Involvement of the Frontal Cortex. American Journal of Psychiatry, 159(10), 1642–52. doi: 10.1176/appi.ajp.159.10.1642
Goudriaan, A. E., De Ruiter, M. B., Van Den Brink, W., Oosterlaan, J., & Veltman, D. J. (2010). Brain activation patterns associated with cue reactivity and craving in abstinent problem gamblers, heavy smokers and healthy controls: an fMRI study. Addiction Biology, 15(4), 491–503. doi: 10.1111/j.1369-1600.2010.00242.x
Hayashi, T., Ko, J. H., Strafella, A. P., & Dagher, A. (2013). Dorsolateral prefrontal and orbitofrontal cortex interactions during self-control of cigarette craving. Proceedings of the National Academy of Sciences, 110(11), 4422–7. doi: 10.1073/pnas.1212185110
Janes, A. C., Pizzagalli, D. A., Richardt, S., Frederick, B. deB., Chuzi, S., Pachas, G., et al. (2010). Brain reactivity to smoking cues prior to smoking cessation predicts ability to maintain tobacco abstinence. Biological Psychiatry, 67(8), 722–9. doi: 10.1016/j.biopsych.2009.12.034
Jenkinson, M., Bannister, P., Brady, M., & Smith, S. (2002). Improved optimization for the robust and accurate linear registration and motion correction of brain images. NeuroImage, 17(2), 825–41. doi: 10.1006/nimg.2002.1132
Jenkinson, M., Beckmann, C. F., Behrens, T. E. J., Woolrich, M. W., & Smith, S. M. (2012). FSL. NeuroImage, 62(2), 782–790. doi: 10.1016/j.neuroimage.2011.09.015
Jenkinson, M., & Smith, S. (2001). A global optimisation method for robust affine registration of brain images. Medical Image Analysis, 5(2), 143–56. doi: 10.1016/s1361-8415(01)00036-6
Kim, S. H., & Hamann, S. (2007). Neural correlates of positive and negative emotion regulation. Journal of Cognitive Neuroscience, 19(5), 776–98. doi: 10.1162/jocn.2007.19.5.776
Kober, H., Mende-Siedlecki, P., Kross, E. F., Weber, J., Mischel, W., Hart, C. L., et al. (2010). Prefrontal-striatal pathway underlies cognitive regulation of craving. Proceedings of the National Academy of Sciences, 107(33), 14811–16. doi: 10.1073/pnas.1007779107
Koob, G. (2001). Drug addiction, dysregulation of reward, and allostasis. Neuropsychopharmacology, 24(2), 97–129. doi: 10.1016/s0893-133x(00)00195-0
Laird, A. R., Robbins, J. M., Li, K., Price, L. R., Cykowski, M. D., Narayana, S., et al. (2008). Modeling motor connectivity using TMS/PET and structural equation modeling. NeuroImage, 41(2), 424–36. doi: 10.1016/j.neuroimage.2008.01.065
Lang, P. J., Bradley, M. M., & Cuthbert,B. N. (2005). International Affective Picture System (IAPS): Affective ratings of pictures and instruction manual. Gainesville: Center for the Study of Emotion & Attention.
Lu, Q., Li, H., Luo, G., Wang, Y., Tang, H., Han, L., & Yao, Z. (2012). Impaired prefrontal–amygdala effective connectivity is responsible for the dysfunction of emotion process in major depressive disorder: A dynamic causal modeling study on MEG. Neuroscience Letters, 523(2), 125–30. doi: 10.1016/j.neulet.2012.06.058
Ma, N., Liu, Y., Fu, X. M., Li, N., Wang, C. X., Zhang, H., et al. (2011). Abnormal brain default-mode network functional connectivity in drug addicts. PLoS ONE, 6(1), 16560. doi: 10.1371/journal.pone.0016560
McLntosh, A. R., & Gonzalez-Lima, F. (1994). Structural equation modeling and its application to network analysis in functional brain imaging. Human Brain Mapping, 2(1-2), 2–22. doi: 10.1002/hbm.460020104
Meda, S. A., Calhoun, V. D., Astur, R. S., Turner, B. M., Ruopp, K., & Pearlson, G. D. (2009). Alcohol dose effects on brain circuits during simulated driving: An fMRI study. Human Brain Mapping, 30(4), 1257–70. doi: 10.1002/hbm.20591
Miller, E. K. (2000). The prefrontal cortex and cognitive control. Nature Reviews Neuroscience, 1(1), 59–65. doi: 10.1038/35036228
Naqvi, N. H., & Bechara, A. (2009). The hidden island of addiction: the insula. Trends in Neurosciences, 32(1), 56–67. doi: 10.1016/j.tins.2008.09.009
Ochsner, K. N., & Gross, J. J. (2008). Cognitive Emotion Regulation. Current Directions in Psychological Science, 17(2), 153–8. doi: 10.1111/j.1467-8721.2008.00566.x
Pearl, J. (2009). Causality: Models, reasoning and inference. Cambridge: Cambridge University Press.
Penny, W. D., Stephan, K. E., Daunizeau, J., Rosa, M. J., Friston, K. J., Schofield, T. M., et al. (2010). Comparing Families of Dynamic Causal Models. PLoS Computational Biology, 6(3), 1000709. doi:10.1371/journal.pcbi.1000709
Ray, S., Haney, M., Hanson, C., Biswal, B., & Hanson, S. J. (2015). Modeling causal relationship between brain regions within the drug-cue processing network in chronic cocaine smokers. Neuropsychopharmacology, 40(13), 2960–8. doi: 10.1038/npp.2015.150
Roebroeck, A., Formisano, E., & Goebel, R. (2005). Mapping directed influence over the brain using Granger causality and fMRI. NeuroImage, 25(1), 230–42. doi: 10.1016/j.neuroimage.2004.11.017
Sato, J. R., Fujita, A., Cardoso, E. F., Thomaz, C. E., Brammer, M. J., & Amaro, E. (2010). Analyzing the connectivity between regions of interest: An approach based on cluster Granger causality for fMRI data analysis. NeuroImage, 52(4), 1444–55. doi: 10.1016/j.neuroimage.2010.05.022
Sladky, R., Höflich, A., Küblböck, M., Kraus, C., Baldinger, P., Moser, E., et al. (2013). Disrupted effective connectivity between the amygdala and orbitofrontal cortex in social anxiety disorder during emotion discrimination revealed by dynamic causal modeling for fMRI. Cerebral Cortex, 25(4), 895–903. doi: 10.1093/cercor/bht279
Stephan, K. E., Penny, W. D., Daunizeau, J., Moran, R. J., & Friston, K. J. (2009). Bayesian model selection for group studies. NeuroImage, 46(4), 1004–17. doi: 10.1016/j.neuroimage.2009.03.025
Sutherland, M. T., Carroll, A. J., Salmeron, B. J., Ross, T. J., Hong, L. E., & Stein, E. A. (2013). Down-regulation of amygdala and insula functional circuits by varenicline and nicotine in abstinent cigarette smokers. Biological Psychiatry, 74(7), 538–46. doi:10.1016/j.biopsych.2013.01.03.
Sutherland, M. T., McHugh, M. J., Pariyadath, V., & Stein, E. A. (2012). Resting state functional connectivity in addiction: Lessons learned and a road ahead. NeuroImage, 62(4), 2281–95. doi: 10.1016/j.neuroimage.2012.01.117
Tang, D. W., Fellows, L. K., Small, D. M., & Dagher, A. (2012). Food and drug cues activate similar brain regions: A meta-analysis of functional MRI studies. Physiology & Behavior, 106(3), 317–24. doi: 10.1016/j.physbeh.2012.03.009
Volkow, N. D., Fowler, J. S., & Wang, G.-J. (2003). The addicted human brain: Insights from imaging studies. Journal of Clinical Investigation, 111(10), 1444–51. doi: 10.1172/jci200318533
Volkow, N. D., Fowler, J. S., Wang, G. J., Baler, R., & Telang, F. (2009). Imaging dopamine’s role in drug abuse and addiction. Neuropharmacology 56(Suppl 1), 3-8. 10.1016/j.neuropharm.2008.05.022
Wang, W., Q. Li, Y. Wang, J. Tian, W. Yang, W. Li, W. et al. (2011). Brain fMRI and craving response to heroin-related cues in patients on methadone maintenance treatment. American Journal of Drug and Alcohol Abuse, 37(2), 123-30. doi: 10.3109/00952990.2010.543997
Wang, X., Chen, Y., Bressler, S. L., & Ding, M. (2007). Granger causality between multiple interdependent neurobiological time series: blockwise versus pairwise methods. International Journal of Neural Systems, 17(2), 71–8. doi: 10.1142/s0129065707000944
Wilson, S. J., Sayette, M. A., & Fiez, J. A. (2004). Prefrontal responses to drug cues: a neurocognitive analysis. Nature Neuroscience, 7(3), 211–4. doi: 10.1038/nn1200
Wrase, J., Schlagenhauf, F., Kienast, T., Wüstenberg, T., Bermpohl, F., Kahnt, T., et al. (2007). Dysfunction of reward processing correlates with alcohol craving in detoxified alcoholics. NeuroImage, 35(2), 787–94. doi: 10.1016/j.neuroimage.2006.11.043
Yalachkov, Y., Kaiser, J., & Naumer, M. J. (2012). Functional neuroimaging studies in addiction: Multisensory drug stimuli and neural cue reactivity. Neuroscience & Biobehavioral Reviews, 36(2), 825–35. doi: 10.1016/j.neubiorev.2011.12.004
Yang, W., Wang, F., Zhang, Z., Ren, X., Zhang, Z., Li, Y. & Sun,T. (2014). [Altered effective connectivity of insula in nicotine addiction (Chinese)]. Journal of the Chinese Medical Association, 94(21): 1667-70. PMID: 25152295
Type of Study: Original |
Subject:
Computational Neuroscience
Received: 2016/09/19 | Accepted: 2016/10/26 | Published: 2017/07/1
Received: 2016/09/19 | Accepted: 2016/10/26 | Published: 2017/07/1
Send email to the article author
| Rights and permissions | |
 |
This work is licensed under a Creative Commons Attribution-NonCommercial 4.0 International License. |
![]()
Copyright © The Author(s);
This is an open access article distributed under the terms of the Creative Commons Attribution License (CC-By-NC), which permits use, distribution, and reproduction in any medium, provided the original work is properly cited and is not used for commercial purposes.
Contact Information
