

Volume 16, Issue 4 (July & August 2025)
BCN 2025, 16(4): 787-804 |
Back to browse issues page



Download citation:
BibTeX | RIS | EndNote | Medlars | ProCite | Reference Manager | RefWorks
Send citation to:


BibTeX | RIS | EndNote | Medlars | ProCite | Reference Manager | RefWorks
Send citation to:
Pahlevani V, Eskanadri F, Almasi-Dooghaee M, Hajizadeh E. Structural MRI Biomarkers Related to Cognitive Recovery and Resistance to Recovery Using the Penalized Mixture Cure Model. BCN 2025; 16 (4) :787-804
URL: http://bcn.iums.ac.ir/article-1-3121-en.html
URL: http://bcn.iums.ac.ir/article-1-3121-en.html


1- Department of Biostatistics, Faculty of Medical Sciences, Tarbiat Modares University, Tehran, Iran.
2- Department of Statistics, Faculty of Statistics Mathematics and Computer, Allameh Tabataba’i University, Tehran, Iran.
3- Department of Neurology, School of Medicine, Iran University of Medical Sciences, Tehran, Iran.
2- Department of Statistics, Faculty of Statistics Mathematics and Computer, Allameh Tabataba’i University, Tehran, Iran.
3- Department of Neurology, School of Medicine, Iran University of Medical Sciences, Tehran, Iran.
Keywords: Alzheimer disease (AD), Cognitive recovery, Clinical dementia rating (CDR), Penalized mixture cure model (MCM), Structural magnetic resonance imaging (MRI)
Full-Text [PDF 917 kb]
| Abstract (HTML)
3. Results
Description of baseline clinical characteristics between study groups
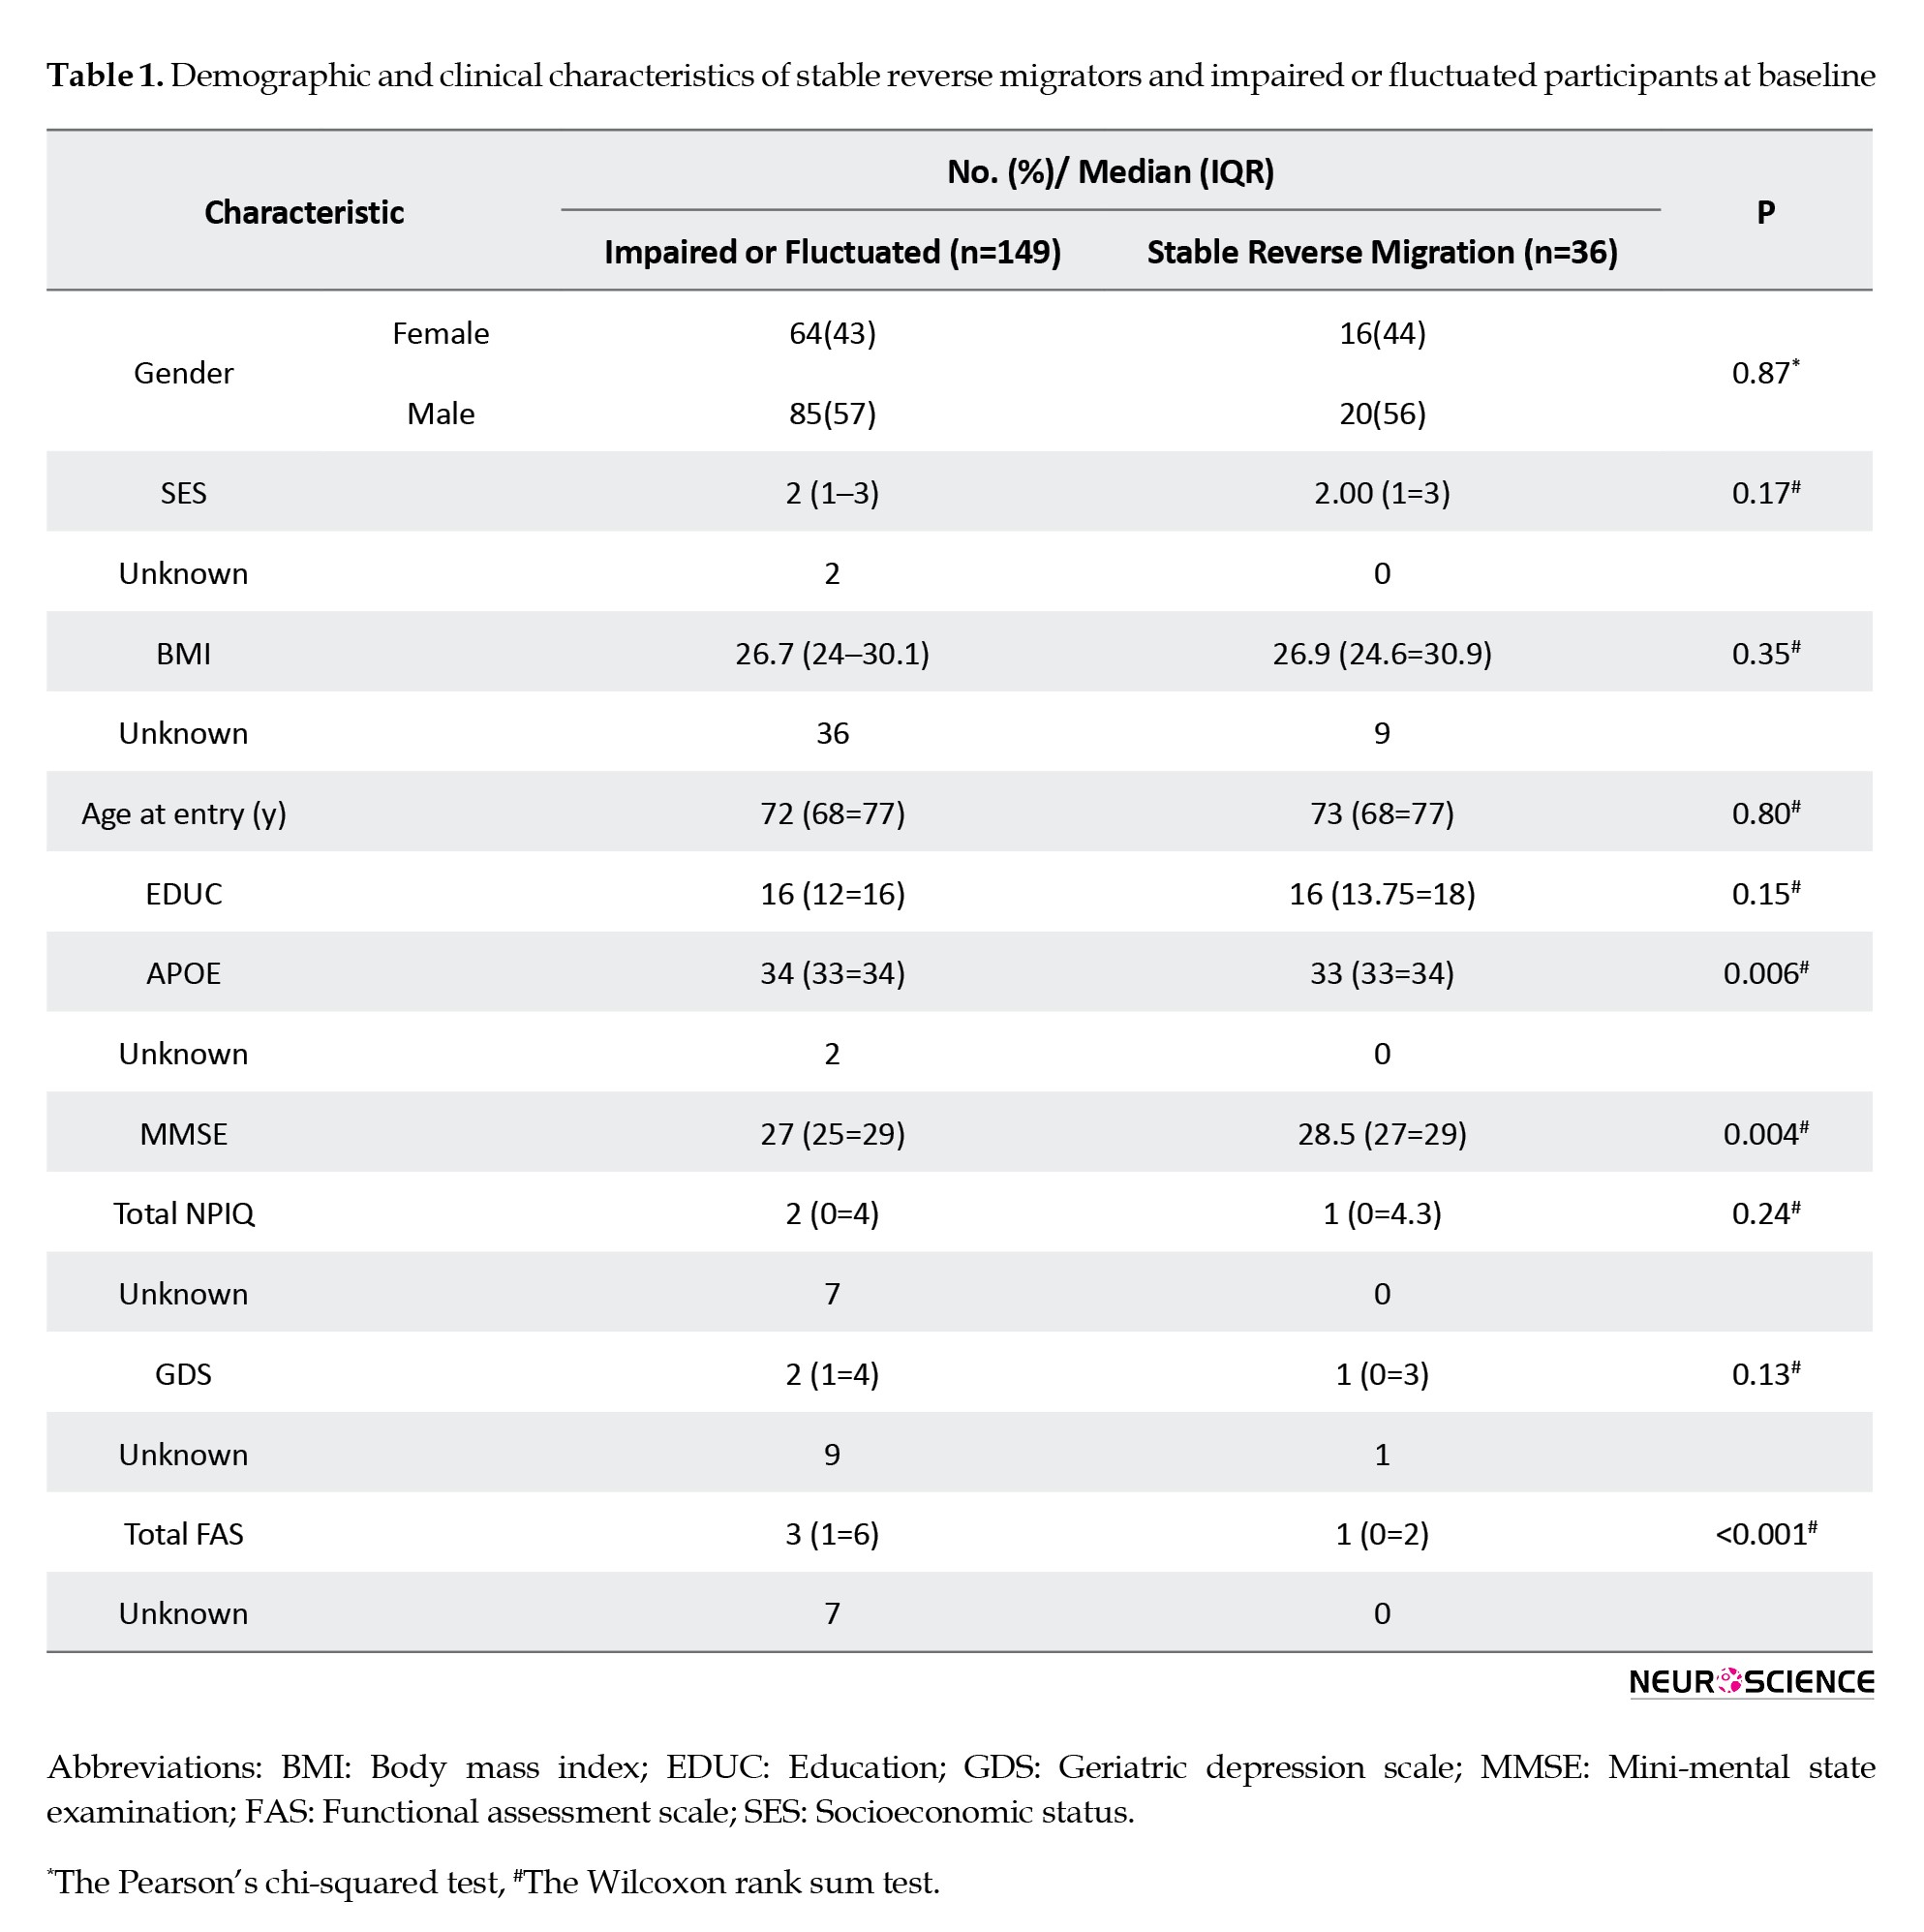
Among the 185 participants with a baseline CDR score of 0.5, 36 were categorized as stable reverse migrators and 149 as impaired or fluctuated. The groups did not differ significantly in gender, SES, BMI, age at entry, or education levels. Significant differences were observed in APOE ε4 status, with the impaired or fluctuated group having a higher median value (P=0.0062). Additionally, stable reverse migrators exhibited slightly higher median MMSE scores (P=0.0042) and lower functional impairment in daily activities as measured by the FAS (P<0.0012). Other clinical measures, including the NPI-Q and GDS, did not differ significantly between groups The baseline demographic and clinical characteristics of participants are summarized in Table 1.
Assessing the MCM assumptions
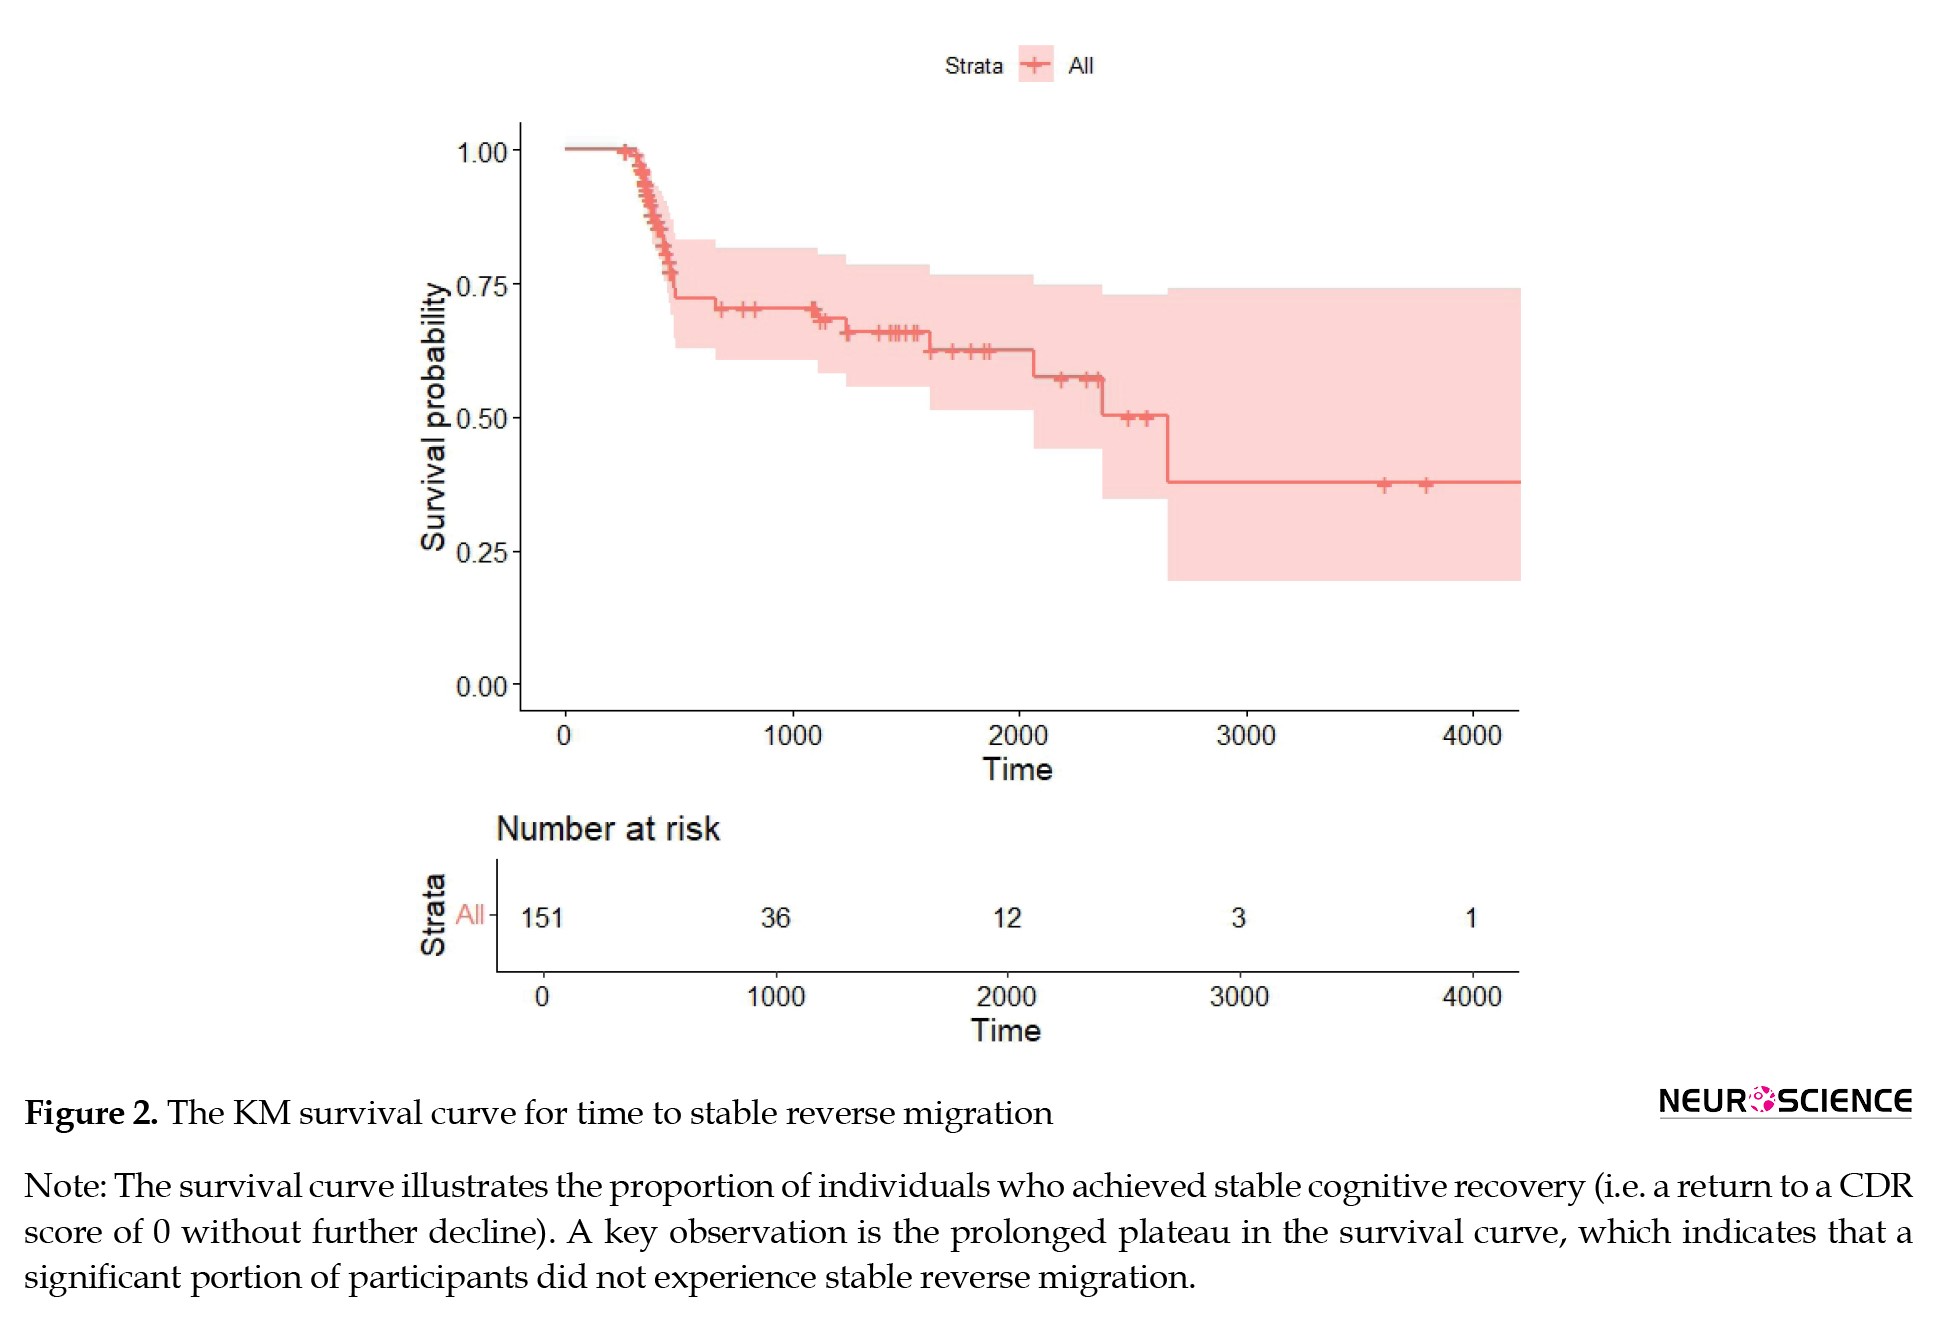
Kaplan-Meier (KM) analysis (Figure 2) revealed that a substantial portion of participants did not experience stable reverse migration, as indicated by a prolonged plateau in the survival curve.
Full-Text:
1. Introduction
The clinical dementia rating (CDR) is a validated tool for assessing Alzheimer disease (AD) risk and severity through semi-structured interviews conducted by experienced clinicians with patients and collateral sources, such as family members. A key feature of the CDR is its ability to capture intraindividual cognitive trajectories, providing insights into the progression from normal cognition (NC) to mild cognitive impairment (MCI) and potential reversion to NC (Morris, 1993).
Reverse migration, particularly the transition from a CDR score of 0.5 to 0, is a crucial area of AD research (Duran et al., 2022; Angevaare et al., 2022; Hampel & Lista, 2016). Stable reverse migration, which we refer to as cognitive recovery in this study, can be defined as a CDR score reverting from 0.5 to 0 without subsequent decline or fluctuation, indicating a return to normal cognitive function. This process, though not fully understood, suggests a form of neuroplasticity, where the brain, despite experiencing neurodegenerative changes, can compensate and restore cognitive function. Neuroplasticity may involve mechanisms such as synaptic strengthening, neuronal reorganization, and neurogenesis, particularly in regions like the hippocampus, prefrontal cortex, and parietal regions that are vital for memory and executive functions (Zatorre et al., 2012). Gray matter preservation and even an increase in volume in certain regions have been observed in individuals who experience recovery, indicating that the brain's ability to adapt plays a significant role in recovery processes (Duran et al., 2022).
However, the understanding of neuroimaging biomarkers related to reverse migration remains limited. Previous studies have primarily focused on the unidirectional progression from NC to MCI and dementia (Jack et al., 2018; Sperling et al., 2019), leaving the role of reverse migration in cognitive recovery largely unexplored. While this concept has gained attention in recent years, further investigation is needed to identify specific biomarkers that predict stable reverse migration and differentiate it from other cognitive trajectories.
In addition to structural brain features, various confounders such as vascular risk factors (e.g. hypertension, diabetes), body mass index (BMI), apolipoprotein E (APOE) genotype, and psychiatric symptoms (e.g. depression) can influence cognitive recovery and resistance to recovery. For example, vascular risk factors and higher BMI are associated with impaired cognitive recovery (Deckers et al., 2017; Dregan et al., 2013), while the APOE ε4 allele is linked to poorer recovery outcomes in MCI (Riedel et al., 2016). These factors should be carefully accounted for when interpreting the relationship between brain structure and cognitive trajectories.
In the most recent work by Duran et al. (2022), multinomial or binary logistic regression has been utilized to investigate biomarkers associated with reverse migration. However, time-to-event regression offers a more dynamic and informative approach by modeling factors that influence the timing of cognitive migration rather than merely estimating its probability. Survival models provide significant advantages over logistic models by incorporating the timing of events, which is crucial for elucidating the trajectory of cognitive changes and effectively predicting clinical outcomes (Cox, 1972; Rabin et al., 2020).
When stable reverse migration in the CDR is the primary outcome, many participants with a CDR of 0.5 remain impaired or experience fluctuations. This result is primarily due to the neurodegenerative nature of AD and related cognitive impairments. As a result, a substantial proportion of individuals become resistant to stable reverse migration (resistance to recovery) and do not achieve a sustained return to a CDR of 0.
In time-to-event analyses involving this resistance, mixture cure models (MCMs) provide a valuable alternative to traditional survival models such as the Cox proportional hazards model. Conventional survival analyses assume that every individual has some likelihood of experiencing the event. MCMs address this limitation by separately modeling the probability of resistance and the time to stable reverse migration among those who are susceptible. This dual approach includes an incidence component that assesses the likelihood of resistance versus susceptibility and a latency component that models the time to stable reverse migration among susceptible individuals. By distinguishing these processes, MCMs allow for the estimation of time to stable reverse migration and facilitate the identification of factors that influence the probability of resistance. This advantage leads to a more comprehensive understanding of cognitive trajectories.
In this study, we extract neuroimaging and clinical data from the OASIS-3 dataset, a publicly available resource designed to support research on normal aging and AD (LaMontagne et al., 2019). The dataset includes extensive MRI data, cognitive assessments, and other clinical features, providing a rich foundation for identifying biomarkers associated with cognitive changes.
The primary goal of this study is to identify an optimal subset of high-dimensional structural MRI biomarkers—specifically regional cortical thickness and gray matter volume—that contribute to cognitive recovery and resistance to recovery in individuals with MCI. We use the hdcuremodels package (Fu et al., 2022b; Fu & Archer, 2024) in R to implement penalized MCMs capable of handling high-dimensional data, allowing us to efficiently perform feature selection and highlight the most relevant MRI biomarkers for these cognitive outcomes.
2. Materials and Methods
Study design and participants
Data were obtained from the OASIS-3 cohort, a longitudinal study spanning over 15 years with 1378 participants at the Knight Alzheimer Disease Research Center, Washington University in St. Louis. The cohort includes generally healthy older adults (CDR=0) with or without a family history of AD, as well as individuals with very mild to mild AD (CDR=0.5 or 1). Participants undergo periodic evaluations, genetic testing, and neuroimaging every two or three years. Exclusion criteria encompass conditions preventing long-term follow-up (for example, end-stage renal disease) or contraindications to MRI or lumbar puncture (for example, pacemakers, anticoagulant use). Further inclusion and exclusion details appear in (LaMontagne et al., 2019).
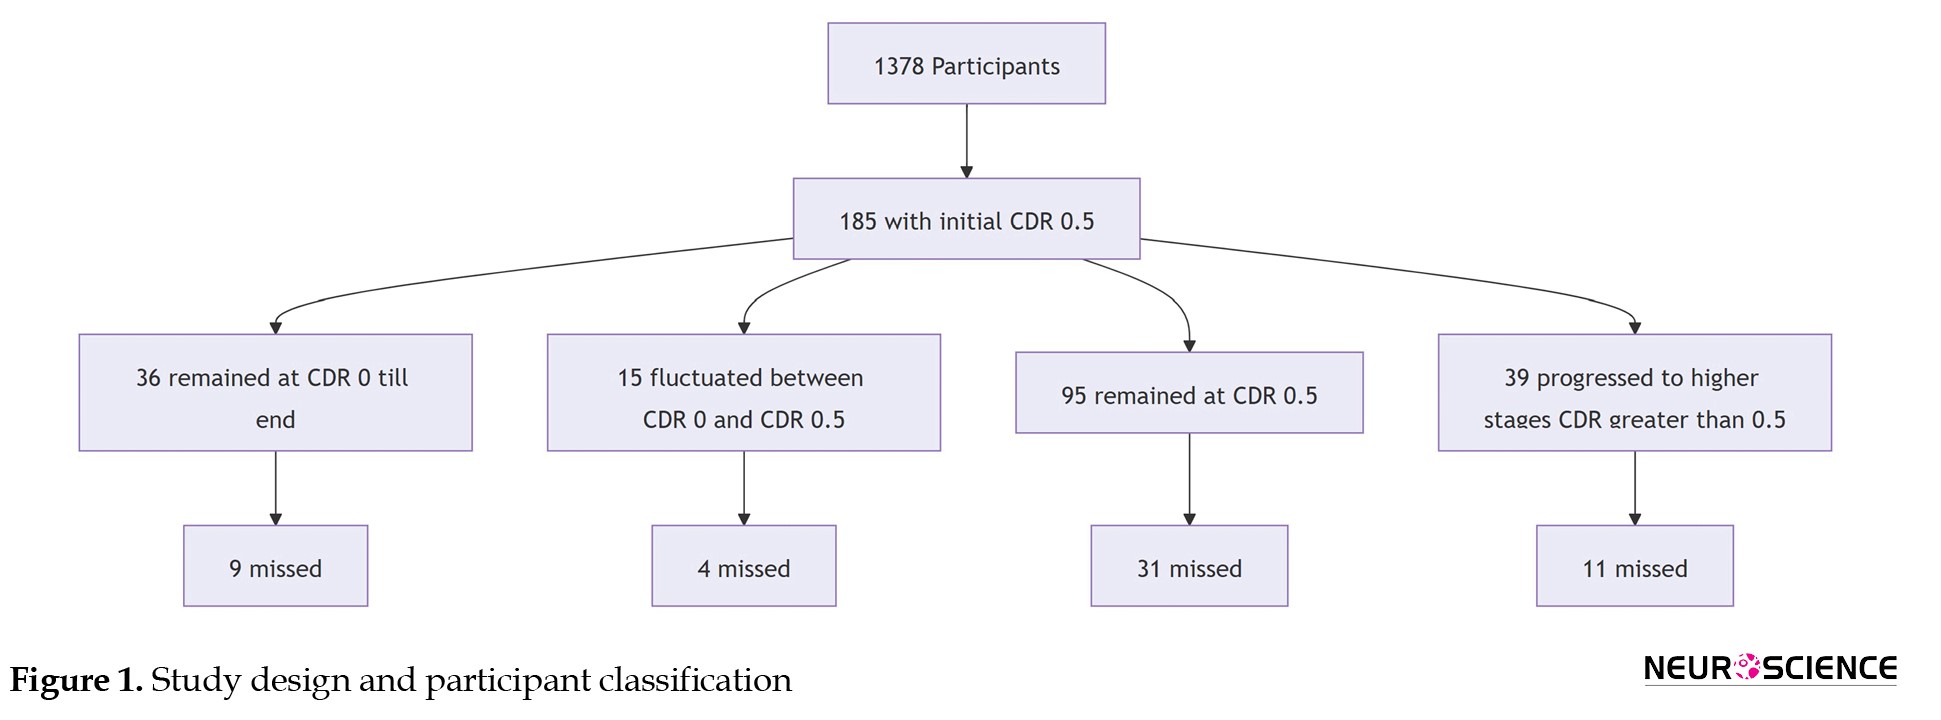
At baseline, participants were categorized by their functional and cognitive states using the global CDR score, where CDR=0 represented normal cognitive function and CDR=0.5 indicated minimal cognitive impairment. The primary outcome of interest was stable reverse migration among participants who entered with a baseline CDR score of 0.5. Out of the 1378 total participants, 185 individuals enrolled with a baseline CDR of 0.5 and had available MR session data. Participants with a baseline CDR score of 0.5 were further divided into the following four categories based on their migration patterns during the follow-up period:
● CDR-0.5 stables: Participants who showed no migration, maintaining a CDR score of 0.5 at both baseline and follow-up visits.
● CDR-0.5 fluctuators: Participants who fluctuated between CDR scores of 0 and 0.5 during the follow-up period.
● CDR-0.5 negative migrators: Participants who exhibited negative migration from a baseline CDR score of 0.5 to a score greater than 0.5 (CDR >0.5).
● Stable reverse migrators: Participants who exhibited stable reverse migration from a baseline CDR of 0.5 to a CDR of 0 and did not progress to CDR >0 during follow-up.
The breakdown of these groups is illustrated in the Figure 1:
The clinical dementia rating (CDR) is a validated tool for assessing Alzheimer disease (AD) risk and severity through semi-structured interviews conducted by experienced clinicians with patients and collateral sources, such as family members. A key feature of the CDR is its ability to capture intraindividual cognitive trajectories, providing insights into the progression from normal cognition (NC) to mild cognitive impairment (MCI) and potential reversion to NC (Morris, 1993).
Reverse migration, particularly the transition from a CDR score of 0.5 to 0, is a crucial area of AD research (Duran et al., 2022; Angevaare et al., 2022; Hampel & Lista, 2016). Stable reverse migration, which we refer to as cognitive recovery in this study, can be defined as a CDR score reverting from 0.5 to 0 without subsequent decline or fluctuation, indicating a return to normal cognitive function. This process, though not fully understood, suggests a form of neuroplasticity, where the brain, despite experiencing neurodegenerative changes, can compensate and restore cognitive function. Neuroplasticity may involve mechanisms such as synaptic strengthening, neuronal reorganization, and neurogenesis, particularly in regions like the hippocampus, prefrontal cortex, and parietal regions that are vital for memory and executive functions (Zatorre et al., 2012). Gray matter preservation and even an increase in volume in certain regions have been observed in individuals who experience recovery, indicating that the brain's ability to adapt plays a significant role in recovery processes (Duran et al., 2022).
However, the understanding of neuroimaging biomarkers related to reverse migration remains limited. Previous studies have primarily focused on the unidirectional progression from NC to MCI and dementia (Jack et al., 2018; Sperling et al., 2019), leaving the role of reverse migration in cognitive recovery largely unexplored. While this concept has gained attention in recent years, further investigation is needed to identify specific biomarkers that predict stable reverse migration and differentiate it from other cognitive trajectories.
In addition to structural brain features, various confounders such as vascular risk factors (e.g. hypertension, diabetes), body mass index (BMI), apolipoprotein E (APOE) genotype, and psychiatric symptoms (e.g. depression) can influence cognitive recovery and resistance to recovery. For example, vascular risk factors and higher BMI are associated with impaired cognitive recovery (Deckers et al., 2017; Dregan et al., 2013), while the APOE ε4 allele is linked to poorer recovery outcomes in MCI (Riedel et al., 2016). These factors should be carefully accounted for when interpreting the relationship between brain structure and cognitive trajectories.
In the most recent work by Duran et al. (2022), multinomial or binary logistic regression has been utilized to investigate biomarkers associated with reverse migration. However, time-to-event regression offers a more dynamic and informative approach by modeling factors that influence the timing of cognitive migration rather than merely estimating its probability. Survival models provide significant advantages over logistic models by incorporating the timing of events, which is crucial for elucidating the trajectory of cognitive changes and effectively predicting clinical outcomes (Cox, 1972; Rabin et al., 2020).
When stable reverse migration in the CDR is the primary outcome, many participants with a CDR of 0.5 remain impaired or experience fluctuations. This result is primarily due to the neurodegenerative nature of AD and related cognitive impairments. As a result, a substantial proportion of individuals become resistant to stable reverse migration (resistance to recovery) and do not achieve a sustained return to a CDR of 0.
In time-to-event analyses involving this resistance, mixture cure models (MCMs) provide a valuable alternative to traditional survival models such as the Cox proportional hazards model. Conventional survival analyses assume that every individual has some likelihood of experiencing the event. MCMs address this limitation by separately modeling the probability of resistance and the time to stable reverse migration among those who are susceptible. This dual approach includes an incidence component that assesses the likelihood of resistance versus susceptibility and a latency component that models the time to stable reverse migration among susceptible individuals. By distinguishing these processes, MCMs allow for the estimation of time to stable reverse migration and facilitate the identification of factors that influence the probability of resistance. This advantage leads to a more comprehensive understanding of cognitive trajectories.
In this study, we extract neuroimaging and clinical data from the OASIS-3 dataset, a publicly available resource designed to support research on normal aging and AD (LaMontagne et al., 2019). The dataset includes extensive MRI data, cognitive assessments, and other clinical features, providing a rich foundation for identifying biomarkers associated with cognitive changes.
The primary goal of this study is to identify an optimal subset of high-dimensional structural MRI biomarkers—specifically regional cortical thickness and gray matter volume—that contribute to cognitive recovery and resistance to recovery in individuals with MCI. We use the hdcuremodels package (Fu et al., 2022b; Fu & Archer, 2024) in R to implement penalized MCMs capable of handling high-dimensional data, allowing us to efficiently perform feature selection and highlight the most relevant MRI biomarkers for these cognitive outcomes.
2. Materials and Methods
Study design and participants
Data were obtained from the OASIS-3 cohort, a longitudinal study spanning over 15 years with 1378 participants at the Knight Alzheimer Disease Research Center, Washington University in St. Louis. The cohort includes generally healthy older adults (CDR=0) with or without a family history of AD, as well as individuals with very mild to mild AD (CDR=0.5 or 1). Participants undergo periodic evaluations, genetic testing, and neuroimaging every two or three years. Exclusion criteria encompass conditions preventing long-term follow-up (for example, end-stage renal disease) or contraindications to MRI or lumbar puncture (for example, pacemakers, anticoagulant use). Further inclusion and exclusion details appear in (LaMontagne et al., 2019).
At baseline, participants were categorized by their functional and cognitive states using the global CDR score, where CDR=0 represented normal cognitive function and CDR=0.5 indicated minimal cognitive impairment. The primary outcome of interest was stable reverse migration among participants who entered with a baseline CDR score of 0.5. Out of the 1378 total participants, 185 individuals enrolled with a baseline CDR of 0.5 and had available MR session data. Participants with a baseline CDR score of 0.5 were further divided into the following four categories based on their migration patterns during the follow-up period:
● CDR-0.5 stables: Participants who showed no migration, maintaining a CDR score of 0.5 at both baseline and follow-up visits.
● CDR-0.5 fluctuators: Participants who fluctuated between CDR scores of 0 and 0.5 during the follow-up period.
● CDR-0.5 negative migrators: Participants who exhibited negative migration from a baseline CDR score of 0.5 to a score greater than 0.5 (CDR >0.5).
● Stable reverse migrators: Participants who exhibited stable reverse migration from a baseline CDR of 0.5 to a CDR of 0 and did not progress to CDR >0 during follow-up.
The breakdown of these groups is illustrated in the Figure 1:
Out of the 185 participants with an initial CDR score of 0.5:
● Thirty-six participants showed stable reverse migration to CDR=0 and maintained it throughout follow-up.
● Fifteen participants fluctuated between CDR scores of 0 and 0.5 during follow-up.
● Ninety-five participants maintained a CDR score of 0.5 consistently.
● Thirty-nine participants experienced negative migration to a higher stage (CDR >0.5).
● Missing data during follow-up visits were also noted in each category, as indicated in the flowchart.
Ethical considerations
Based on some studies (LaMontagne et al., 2019), all participants in the OASIS-3 dataset provided informed consent under the ethical standards set by the Institutional Review Board at Washington University School of Medicine. The study adhered to established guidelines for human subjects' research, ensuring confidentiality and appropriate handling of both clinical and neuroimaging data.
Demographic and clinical assessments
We evaluated ten baseline clinical assessments to capture demographic, functional, psychiatric, and genetic factors potentially linked to stable reverse migration. These included age at enrollment, sex, education, socioeconomic status (SES), BMI, total neuropsychiatric inventory questionnaire (NPI-Q) score, total geriatric depression scale (GDS) score, total National Alzheimer's Coordinating Center (NACC) functional assessment scale (FAS), APOE ε4 allele of apolipoprotein E gene, and mini-mental state examination (MMSE). The NPI-Q, which assesses 12 behavioral symptoms such as delusions and agitation, evaluates the presence or absence of symptoms in the past month and rates their severity as mild, moderate, or severe if present. GDS, a screening tool for depressive symptoms, has a total score ranging from 0 to 15, with higher scores indicating greater severity of depression. FAS is a 10-item scale that measures a patient's ability to perform daily activities, such as preparing a balanced meal, with functional abilities rated from 0 (normal) to 3 (dependent).
MRI data acquisition
MRI data were collected on three different Siemens scanner models (Siemens Medical Solutions USA, Inc.): Vision 1.5T, TIM Trio 3T (two different scanners of this model), and BioGraph mMR PET-MR 3T. Participants were placed in a 16-channel head coil for the 1.5T scanners and a 20-channel head coil for the 3T scanners, with foam pad stabilizers placed next to the ears to reduce motion artifacts during the scans. These technical settings were standardized to minimize potential variability introduced by different MRI systems. Further details on the MRI acquisition parameters, including technical settings and harmonization strategies, can be found in the OASIS-3 database. This resource provides a comprehensive overview of the scanning protocols and imaging parameters, ensuring consistency and quality control across all data collected (LaMontagne et al., 2019).
MRI post-processing: Volumetric segmentation and regional feature assessments
All MRI sessions underwent cortical reconstruction and volumetric segmentation of T1-weighted images using the Desikan-Killiany atlas with the FreeSurfer image analysis suite (Fischl, 2012). This procedure yielded 68 bilateral cortical regions, providing 136 volumetric features per subject, including averaged cortical thickness and gray matter volumes. For subsequent analyses, extracted regional gray matter volumes were scaled by the total intracranial volume (TIV), computed as the sum of gray matter, white matter, and cerebrospinal fluid. This adjustment corrects for interindividual variations in overall brain size.
Matching up MR session and clinical data
Because MRI scans and clinical questionnaires do not always occur during the same visit, we considered clinical data entries within one year before or after each MRI session as valid matches. This approach ensured the accurate integration of cognitive and neuroimaging data for analysis.
Statistical analyses
Collinearity
To assess multicollinearity among the predictor variables, we calculated the variance inflation factor (VIF) for all included covariates. The VIF was calculated using the "vif" function from the "rms" package in R, and it was verified that all covariates had VIF values less than 10, indicating the absence of significant multicollinearity issues.
The MCM description
In this study, we employed a high-dimensional MCM to analyze the primary outcome: Stable reverse migration from a CDR of 0.5 to 0. The MCM approach is particularly suited for scenarios where a proportion of individuals is resistant to stable reverse migration—remaining impaired or fluctuating—while others are susceptible and may achieve stable reversion. This dual-population framework allows for detailed modeling of both resistance (referred to as being "cured") and the timing of stable reverse migration among the susceptible individuals.
MCMs conceptualize the target population as a mixture of susceptible and immune individuals with respect to the event of interest, in this case, stable reverse migration. Let Z represent a certain random variable defined as (Equation 1):

The probabilities of being cured (resistant) and not cured (susceptible) are as follows (Equation 2):
2. P(Z=1)=η and P(Z=0)=1-η,
where η is the probability of being resistant to stable reverse migration. This condition is particularly relevant in the context of neurodegenerative diseases like AD, where many individuals do not return to normal cognitive function. The survival function for each subgroup is defined as follows (Equation 3):
3. Su(t)=P(T>t|Z=0), Sc(t)=P(T>t|Z=1),
where Su(t) is the survival function for the susceptible to stable reverse migration subpopulation, and Sc(t) for the resistant (cured) subpopulation. The overall survival function for the population is expressed as (Equation 4):
4. S(t)=P(T>t)=η+(1-η)Su(t),
Model components and role of covariates
Incidence model (cure fraction model)
The cure fraction (η) represents the probability of resistance to stable reverse migration. It is modeled using a logistic regression function (Equation 5):
5. "logit" (η|x)=xTβ,
where x includes baseline covariates such as clinical characteristics (e.g. age, BMI), and structural MRI biomarkers (e.g. regional brain volumes or cortical thickness), the coefficients β quantify the effect of each covariate on the probability of resistance. For example, a positive βk for a specific MRI feature indicates that higher values of this feature are associated with increased resistance to stable reverse migration (remaining impaired or fluctuating).
Latency model (survival model)
For susceptible individuals (Z=0), the time to stable reverse migration (T) is modeled using the Cox proportional hazards model (Equation 6):
6. h(t|x)=h0(t)exp(xTγ),
where x represents the same set of baseline covariates as in the incidence model, and γ are the associated coefficients. Here, γ captures the effect of each covariate on the rate of stable reverse migration. A negative γk for a clinical or neuroimaging feature suggests that higher values of this feature are associated with a longer time to stable reverse migration (slower recovery).
The hdcuremodels package
The hdcuremodels package in R provides a penalized approach for fitting MCMs in high-dimensional settings. By applying regularization techniques such as LASSO or elastic net, it selects the most predictive features while guarding against overfitting. This functionality is particularly beneficial for analyzing large sets of structural MRI biomarkers, as it narrows down variables to those most relevant for understanding cognitive recovery and resistance to recovery.
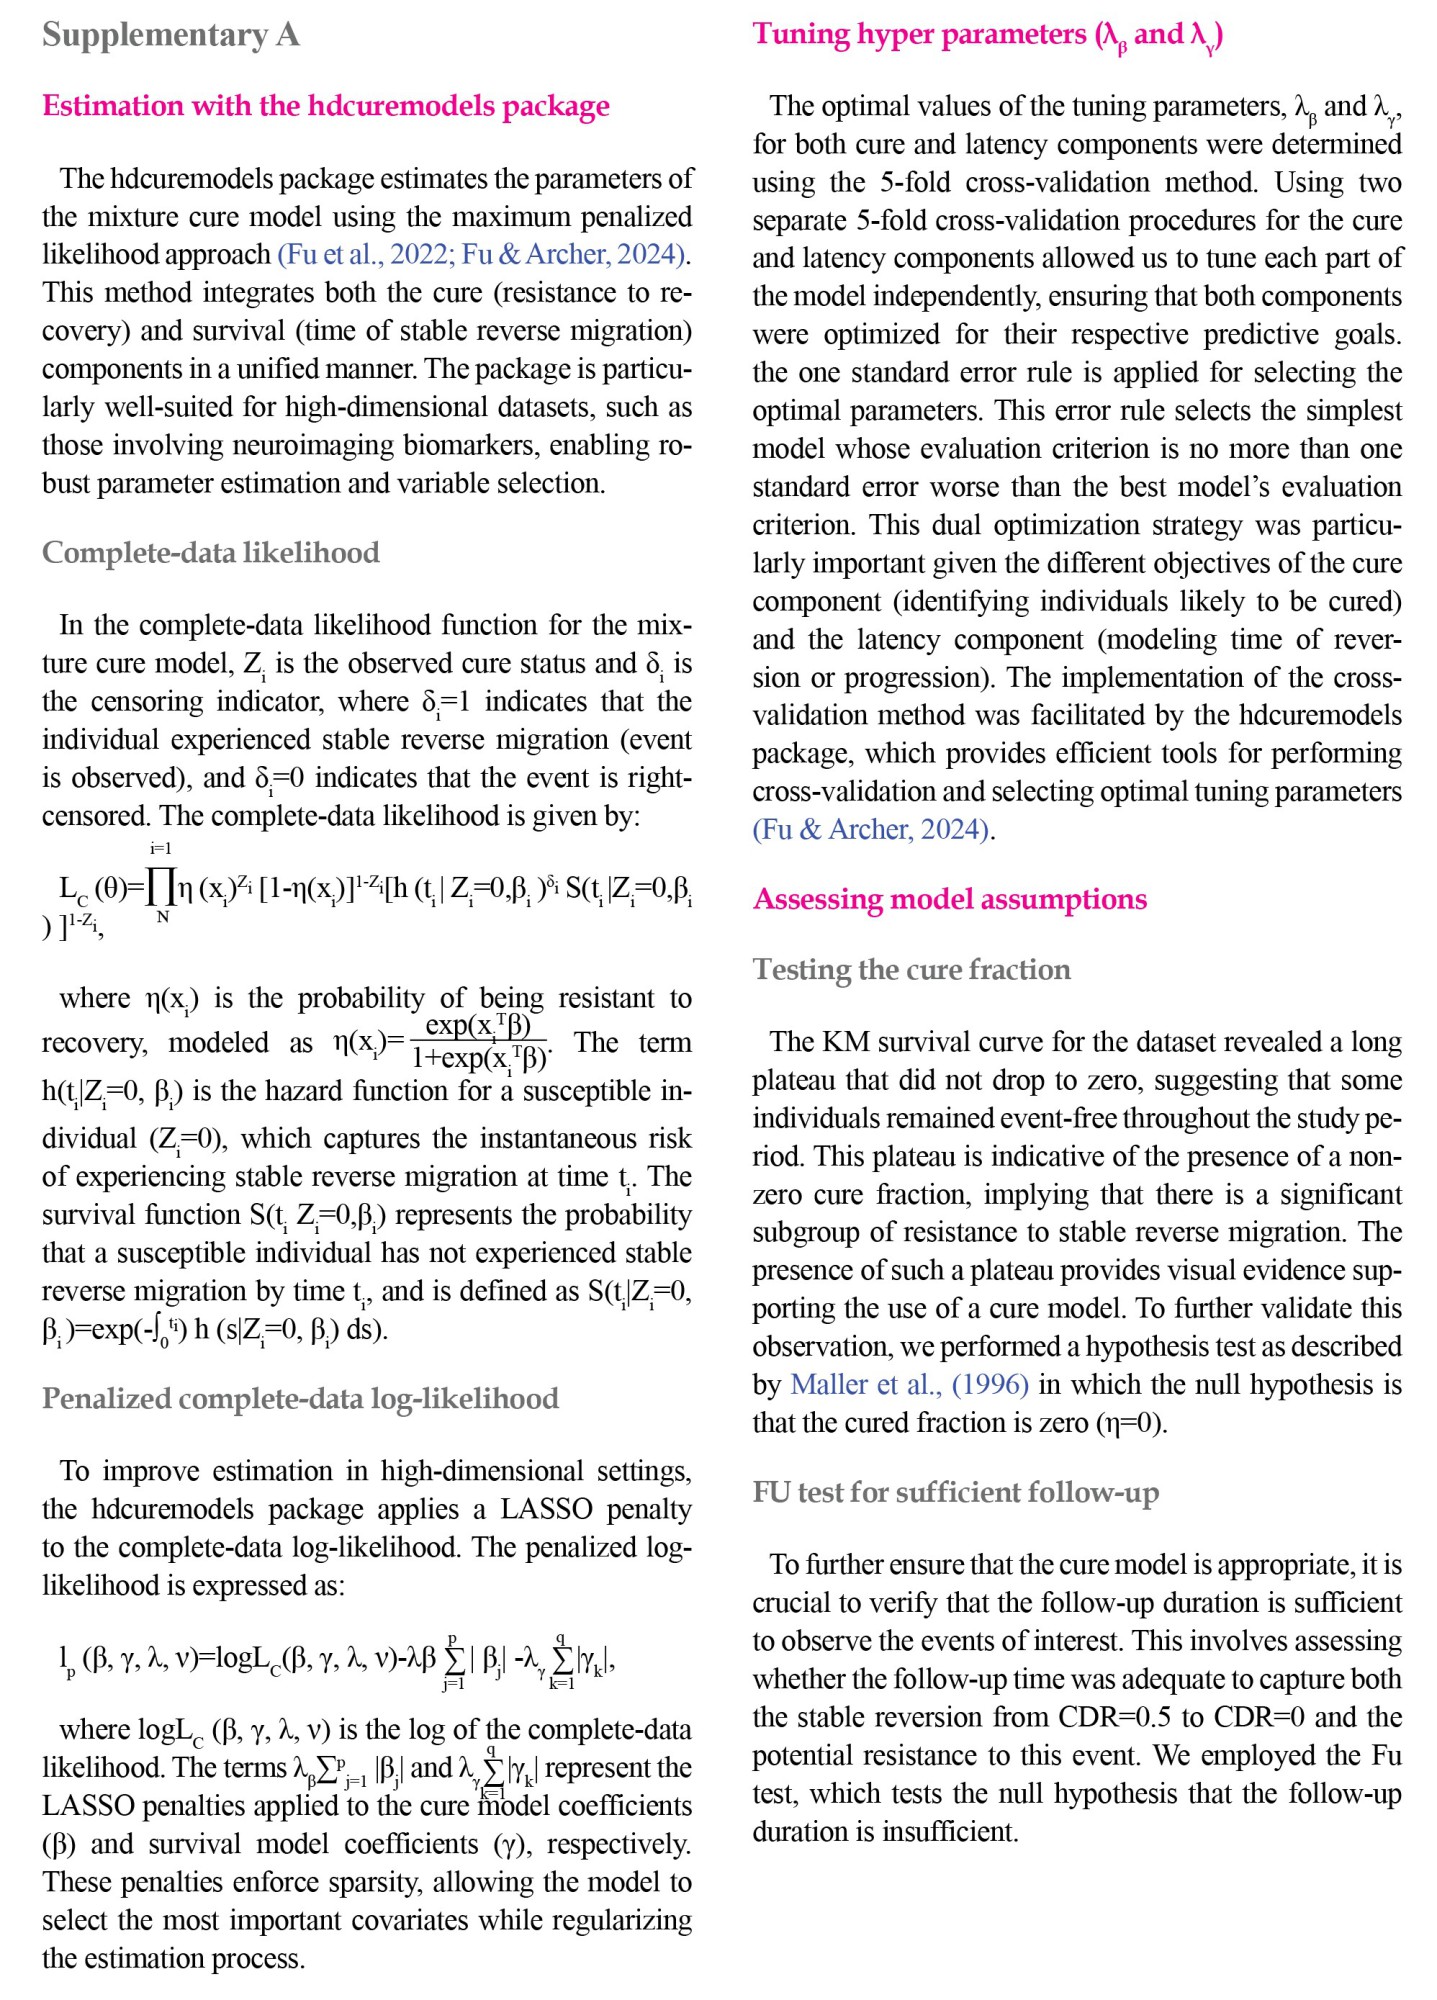
The package offers functions for model fitting, cross-validation, and diagnostic assessments, creating a robust framework for identifying and validating the key biomarkers in MCI. In this work, we fitted penalized MCM using the LASSO penalty. In addition to evaluating the predictive performance of penalized MCM, we employed two key metrics: The C-concordance index (C-index) and the area under the receiver operating characteristic curve (AUC). These metrics help assess the model's ability to accurately predict the latency and incidence components of the MCM, respectively (Fu et al., 2022a). Details on feature selection, model assessment, and uncertainty in the estimations are provided in Supplementary A.
● Thirty-six participants showed stable reverse migration to CDR=0 and maintained it throughout follow-up.
● Fifteen participants fluctuated between CDR scores of 0 and 0.5 during follow-up.
● Ninety-five participants maintained a CDR score of 0.5 consistently.
● Thirty-nine participants experienced negative migration to a higher stage (CDR >0.5).
● Missing data during follow-up visits were also noted in each category, as indicated in the flowchart.
Ethical considerations
Based on some studies (LaMontagne et al., 2019), all participants in the OASIS-3 dataset provided informed consent under the ethical standards set by the Institutional Review Board at Washington University School of Medicine. The study adhered to established guidelines for human subjects' research, ensuring confidentiality and appropriate handling of both clinical and neuroimaging data.
Demographic and clinical assessments
We evaluated ten baseline clinical assessments to capture demographic, functional, psychiatric, and genetic factors potentially linked to stable reverse migration. These included age at enrollment, sex, education, socioeconomic status (SES), BMI, total neuropsychiatric inventory questionnaire (NPI-Q) score, total geriatric depression scale (GDS) score, total National Alzheimer's Coordinating Center (NACC) functional assessment scale (FAS), APOE ε4 allele of apolipoprotein E gene, and mini-mental state examination (MMSE). The NPI-Q, which assesses 12 behavioral symptoms such as delusions and agitation, evaluates the presence or absence of symptoms in the past month and rates their severity as mild, moderate, or severe if present. GDS, a screening tool for depressive symptoms, has a total score ranging from 0 to 15, with higher scores indicating greater severity of depression. FAS is a 10-item scale that measures a patient's ability to perform daily activities, such as preparing a balanced meal, with functional abilities rated from 0 (normal) to 3 (dependent).
MRI data acquisition
MRI data were collected on three different Siemens scanner models (Siemens Medical Solutions USA, Inc.): Vision 1.5T, TIM Trio 3T (two different scanners of this model), and BioGraph mMR PET-MR 3T. Participants were placed in a 16-channel head coil for the 1.5T scanners and a 20-channel head coil for the 3T scanners, with foam pad stabilizers placed next to the ears to reduce motion artifacts during the scans. These technical settings were standardized to minimize potential variability introduced by different MRI systems. Further details on the MRI acquisition parameters, including technical settings and harmonization strategies, can be found in the OASIS-3 database. This resource provides a comprehensive overview of the scanning protocols and imaging parameters, ensuring consistency and quality control across all data collected (LaMontagne et al., 2019).
MRI post-processing: Volumetric segmentation and regional feature assessments
All MRI sessions underwent cortical reconstruction and volumetric segmentation of T1-weighted images using the Desikan-Killiany atlas with the FreeSurfer image analysis suite (Fischl, 2012). This procedure yielded 68 bilateral cortical regions, providing 136 volumetric features per subject, including averaged cortical thickness and gray matter volumes. For subsequent analyses, extracted regional gray matter volumes were scaled by the total intracranial volume (TIV), computed as the sum of gray matter, white matter, and cerebrospinal fluid. This adjustment corrects for interindividual variations in overall brain size.
Matching up MR session and clinical data
Because MRI scans and clinical questionnaires do not always occur during the same visit, we considered clinical data entries within one year before or after each MRI session as valid matches. This approach ensured the accurate integration of cognitive and neuroimaging data for analysis.
Statistical analyses
Collinearity
To assess multicollinearity among the predictor variables, we calculated the variance inflation factor (VIF) for all included covariates. The VIF was calculated using the "vif" function from the "rms" package in R, and it was verified that all covariates had VIF values less than 10, indicating the absence of significant multicollinearity issues.
The MCM description
In this study, we employed a high-dimensional MCM to analyze the primary outcome: Stable reverse migration from a CDR of 0.5 to 0. The MCM approach is particularly suited for scenarios where a proportion of individuals is resistant to stable reverse migration—remaining impaired or fluctuating—while others are susceptible and may achieve stable reversion. This dual-population framework allows for detailed modeling of both resistance (referred to as being "cured") and the timing of stable reverse migration among the susceptible individuals.
MCMs conceptualize the target population as a mixture of susceptible and immune individuals with respect to the event of interest, in this case, stable reverse migration. Let Z represent a certain random variable defined as (Equation 1):
The probabilities of being cured (resistant) and not cured (susceptible) are as follows (Equation 2):
2. P(Z=1)=η and P(Z=0)=1-η,
where η is the probability of being resistant to stable reverse migration. This condition is particularly relevant in the context of neurodegenerative diseases like AD, where many individuals do not return to normal cognitive function. The survival function for each subgroup is defined as follows (Equation 3):
3. Su(t)=P(T>t|Z=0), Sc(t)=P(T>t|Z=1),
where Su(t) is the survival function for the susceptible to stable reverse migration subpopulation, and Sc(t) for the resistant (cured) subpopulation. The overall survival function for the population is expressed as (Equation 4):
4. S(t)=P(T>t)=η+(1-η)Su(t),
Model components and role of covariates
Incidence model (cure fraction model)
The cure fraction (η) represents the probability of resistance to stable reverse migration. It is modeled using a logistic regression function (Equation 5):
5. "logit" (η|x)=xTβ,
where x includes baseline covariates such as clinical characteristics (e.g. age, BMI), and structural MRI biomarkers (e.g. regional brain volumes or cortical thickness), the coefficients β quantify the effect of each covariate on the probability of resistance. For example, a positive βk for a specific MRI feature indicates that higher values of this feature are associated with increased resistance to stable reverse migration (remaining impaired or fluctuating).
Latency model (survival model)
For susceptible individuals (Z=0), the time to stable reverse migration (T) is modeled using the Cox proportional hazards model (Equation 6):
6. h(t|x)=h0(t)exp(xTγ),
where x represents the same set of baseline covariates as in the incidence model, and γ are the associated coefficients. Here, γ captures the effect of each covariate on the rate of stable reverse migration. A negative γk for a clinical or neuroimaging feature suggests that higher values of this feature are associated with a longer time to stable reverse migration (slower recovery).
The hdcuremodels package
The hdcuremodels package in R provides a penalized approach for fitting MCMs in high-dimensional settings. By applying regularization techniques such as LASSO or elastic net, it selects the most predictive features while guarding against overfitting. This functionality is particularly beneficial for analyzing large sets of structural MRI biomarkers, as it narrows down variables to those most relevant for understanding cognitive recovery and resistance to recovery.
The package offers functions for model fitting, cross-validation, and diagnostic assessments, creating a robust framework for identifying and validating the key biomarkers in MCI. In this work, we fitted penalized MCM using the LASSO penalty. In addition to evaluating the predictive performance of penalized MCM, we employed two key metrics: The C-concordance index (C-index) and the area under the receiver operating characteristic curve (AUC). These metrics help assess the model's ability to accurately predict the latency and incidence components of the MCM, respectively (Fu et al., 2022a). Details on feature selection, model assessment, and uncertainty in the estimations are provided in Supplementary A.
3. Results
Description of baseline clinical characteristics between study groups
Among the 185 participants with a baseline CDR score of 0.5, 36 were categorized as stable reverse migrators and 149 as impaired or fluctuated. The groups did not differ significantly in gender, SES, BMI, age at entry, or education levels. Significant differences were observed in APOE ε4 status, with the impaired or fluctuated group having a higher median value (P=0.0062). Additionally, stable reverse migrators exhibited slightly higher median MMSE scores (P=0.0042) and lower functional impairment in daily activities as measured by the FAS (P<0.0012). Other clinical measures, including the NPI-Q and GDS, did not differ significantly between groups The baseline demographic and clinical characteristics of participants are summarized in Table 1.
Assessing the MCM assumptions
Kaplan-Meier (KM) analysis (Figure 2) revealed that a substantial portion of participants did not experience stable reverse migration, as indicated by a prolonged plateau in the survival curve.
We estimated a significant cure fraction of 34% (P=0.005), confirming the presence of a non-zero cured population. Additionally, the follow-up duration was sufficient to support the reliability of our findings (P=0.006).
Penalized MCM outcomes: Latency component
The penalized MCM identified several standardized structural MRI features significantly associated with the rate of stable reverse migration from a CDR score of 0.5 to 0 (Table 2).
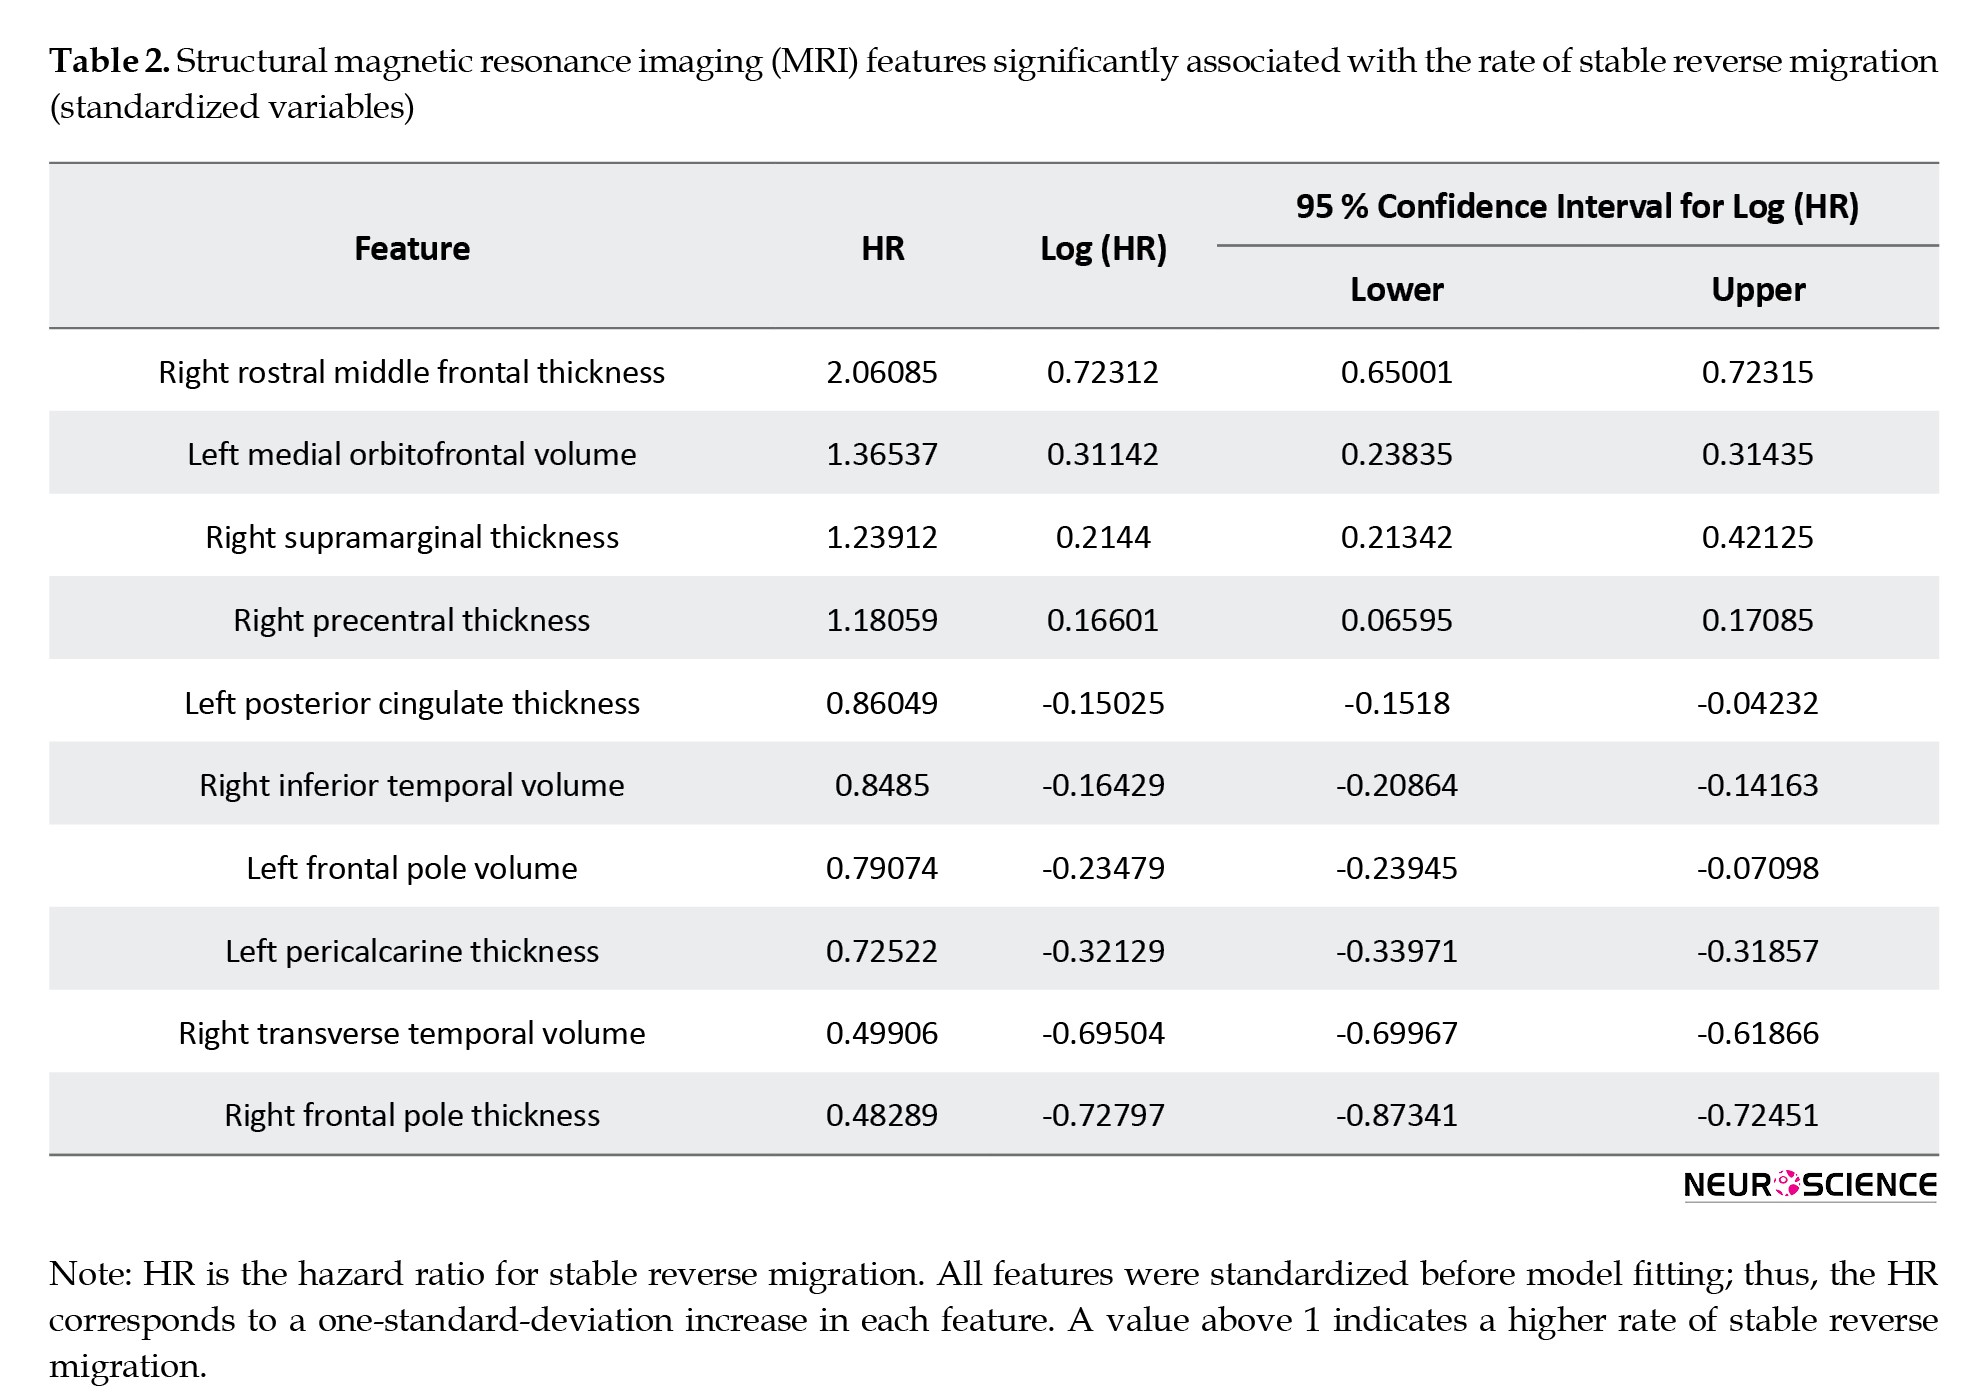
Features with HRs deviating by less than 10% from 1 were excluded, as such small deviations are unlikely to be clinically significant. Features with HR greater than one, such as left rostral middle frontal thickness (hazard ratio [HR]=2.06), left medial orbitofrontal volume (HR=1.37), right supramarginal thickness (HR=1.24), and right precentral thickness (HR=1.18), were linked to faster recovery rates.
Conversely, features with HR less than one, including right frontal pole thickness (HR=0.48), right transverse temporal volume (HR=0.50), left pericalcarine thickness (HR=0.73), left frontal pole volume (HR=0.79), right inferior temporal volume (HR=0.85), and left posterior cingulate thickness (HR=0.86), were associated with slower recovery rates. The increase in these features suggests that larger values may reflect maladaptive neuroplasticity, where the brain may compensate in ways that are not conducive to cognitive recovery. These structural changes could represent early neurodegenerative processes that impair brain function over time, limiting the potential for full recovery.
Additionally, the clinical measure total NPI-Q was significantly associated with a slower recovery rate (HR=0.8163). This further supports the idea that neuropsychiatric symptoms hinder cognitive recovery by interfering with essential neural circuits for memory and executive function.
Penalized MCM outcomes: Incidence component
Similar to the latency component, the penalized MCM identified several structural MRI features and clinical measures significantly associated with the probability of resistance to stable reverse migration (Table 3).
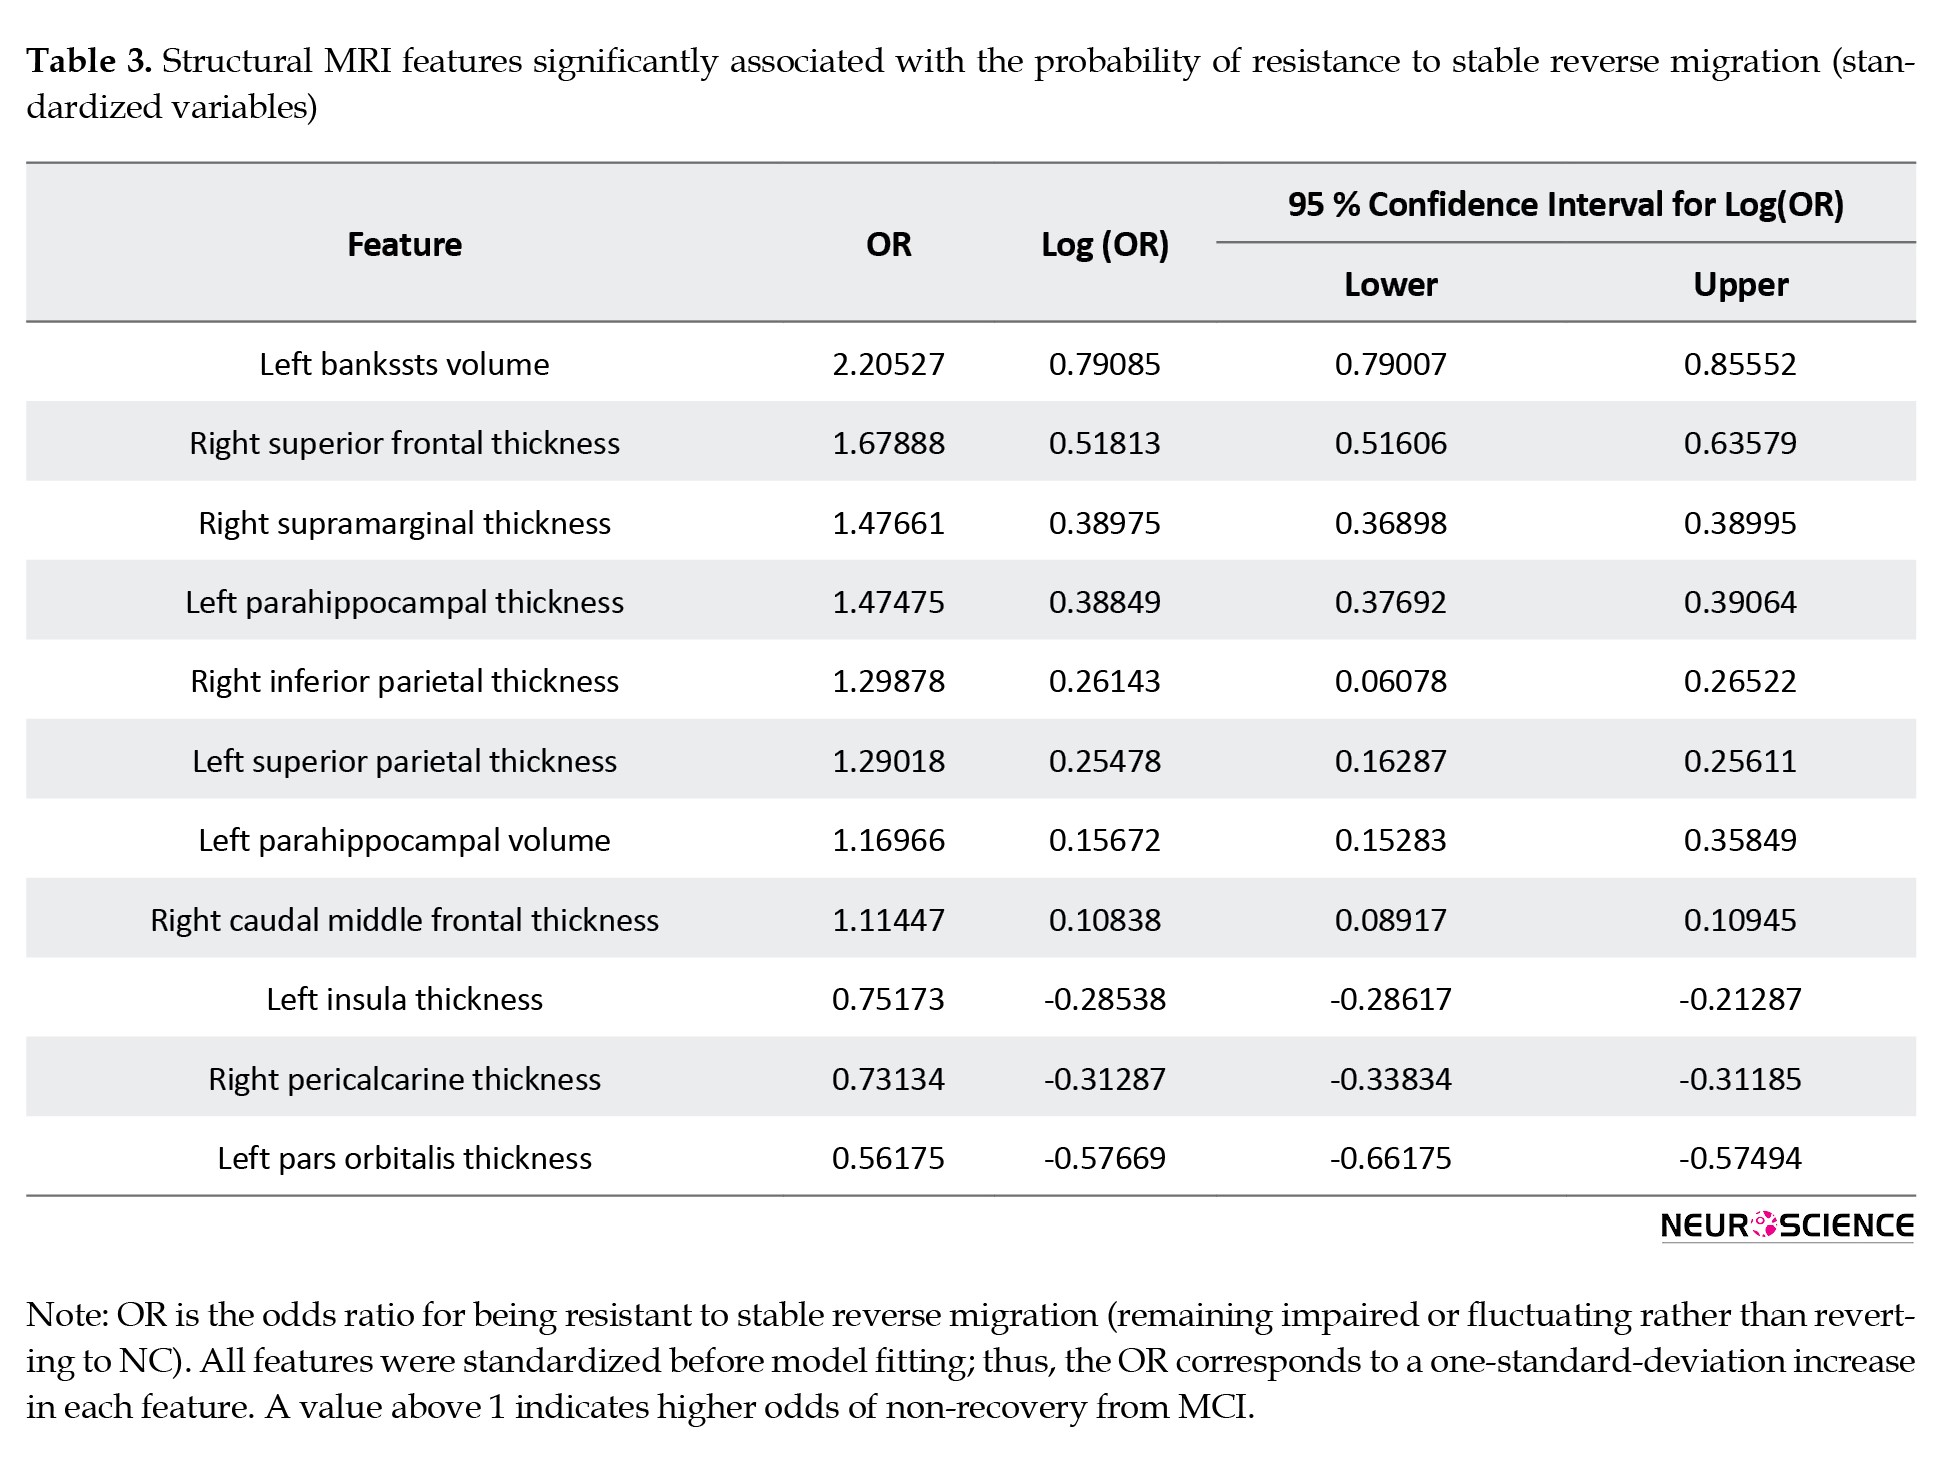
Structural features with odds ratios (OR) greater than one, such as left bankssts volume (OR=2.21), right superior frontal thickness (OR=1.68), right supramarginal thickness (OR=1.48), and right inferior parietal thickness (OR=1.30), were linked to higher odds of remaining impaired or fluctuating. These features, particularly in regions involved in higher cognitive functions and sensory integration, may reflect maladaptive compensatory mechanisms or neuroplasticity, which might hinder recovery and contribute to resistance to reverse migration.
Conversely, features with OR less than one, including left pars orbitalis thickness (OR=0.56), right pericalcarine thickness (OR=0.73), and left insula thickness (OR=0.75), were associated with lower odds of resistance to recovery, suggesting that decreased cortical thickness in these regions could be linked to a better likelihood of recovery.
Additionally, higher BMI (OR=1.20) increased the odds of remaining impaired, while higher FAS scores (OR=0.51) reduced the odds of resistance to recovery, indicating the significant role of functional abilities and BMI in predicting recovery outcomes.
Model performance assessment: C-concordance index and AUC
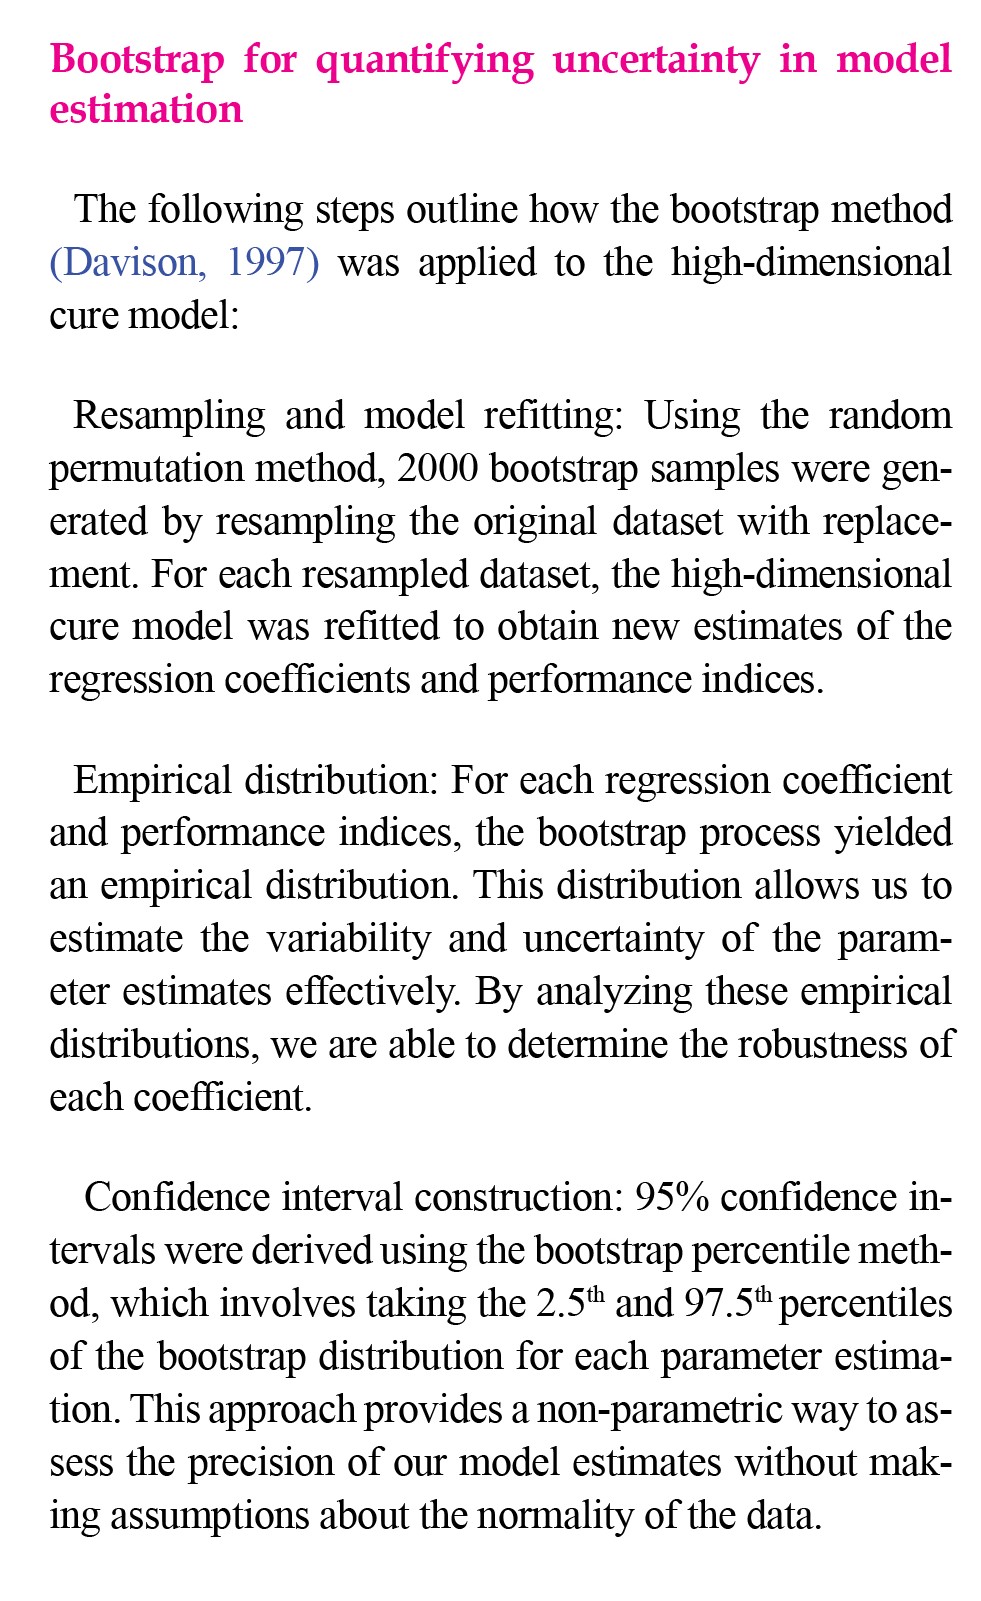
The penalized MCM demonstrated strong predictive performance, assessed using the C-concordance index (C-index) and AUC based on 2000 bootstrap samples. The C-index evaluates how well the model predicts the timing of stable reverse migration, with a value of 0.845 (95% CI, 0.843%, 0.872%), indicating excellent accuracy in identifying individuals likely to recover sooner compared to those who recover later or not at all.
The AUC measures the model's ability to classify individuals as resistant or susceptible to stable reverse migration. The AUC value of 0.905 (95% CI, 0.900%, 0.905%) highlights the model's strong classification performance. These results validate the model's robustness in predicting recovery timing and resistance likelihood in individuals with MCI.
4. Discussion
In this study, we adopted a penalized MCM to examine the dual pathways of recovery (stable reverse migration) and resistance to it. This approach distinguishes our work from traditional analyses by capturing both the subgroup of participants who genuinely revert to NC and remain there, as well as those who resist stable recovery. By integrating high-dimensional neuroimaging features and key clinical variables (e.g. BMI, FAS scores) into the same modeling framework, we have offered a more comprehensive understanding of the factors influencing cognitive trajectories. The robust performance indices (C-index and AUC) underscore the reliability of this method in identifying specific brain regions and clinical measures that either facilitate recovery or predispose individuals to sustained impairment. This uniqueness lies in the model's ability to illuminate how structural and clinical factors interact to shape not just the risk of decline, but also the realistic potential for cognitive improvement.
Description of baseline clinical characteristics between study groups
The analysis of baseline clinical characteristics between the stable reverse migrators and impaired or fluctuated groups revealed only modest differences. While these variables may not exhibit stark contrasts at the group level, they could serve as early indicators of trajectories toward stable reverse migration (recovery) or resistance to recovery. Such baseline factors provide valuable insights into potential predictors of cognitive outcomes and may guide targeted interventions.
The lack of significant differences in demographic factors such as gender, SES, and BMI is consistent with some previous studies that highlight the limited role of these variables in early cognitive trajectories. However, their subtle contributions should not be dismissed. SES and BMI, for instance, have been linked to long-term cognitive health in broader populations, with SES reflecting access to resources and cognitive stimulation (Stern, 2002) and BMI indicating systemic health influences on the brain (Kim et al., 2016). While these variables may not directly differentiate recovery and resistance at baseline, they could interact with other factors over time, influencing long-term trajectories.
The observed differences in APOE ε4 status underline its role as an important early indicator of resistance to recovery. Individuals in the impaired or fluctuated group exhibited a higher prevalence of APOE ε4, aligning with its established association with increased amyloid beta deposition and reduced synaptic plasticity (Liu et al., 2013). This genetic predisposition may set the stage for more pronounced cognitive challenges, making APOE ε4 a critical focus for early risk assessment and intervention.
Baseline cognitive function, as measured by MMSE scores, demonstrated significant differences between groups, even though the differences were small at entry. These findings highlight the potential of MMSE as an early marker of stable reverse migration, emphasizing that even slight variations in cognitive function at baseline should not be overlooked. The higher MMSE scores observed in the stable reverse migrators group suggest that individuals with better baseline cognitive abilities may possess greater neural reserve, enabling recovery despite underlying neuropathology (Stern, 2002). This finding underscores the importance of routine cognitive assessments to identify individuals with a higher likelihood of recovery and to implement early cognitive training programs that enhance compensatory mechanisms.
Functional impairment in daily activities, captured by the FAS, was another significant differentiator between groups. Stable reverse migrators demonstrated lower FAS at baseline, highlighting the importance of functional assessments as predictors of recovery. FAS not only reflects cognitive health but also points to an individual's ability to engage in adaptive behaviors and maintain quality of life, which are critical for successful recovery (Teng et al., 2010).
The absence of significant differences in neuropsychiatric symptoms, as measured by the NPI-Q and GDS, suggests that these factors may not serve as strong early indicators of cognitive recovery or resistance to recovery in the current subpopulation of the dataset. This finding contrasts with several studies that emphasize the role of depression and behavioral symptoms in accelerating cognitive decline (Enache et al., 2011; Wilks et al., 2024). However, it is possible that, in this specific cohort, genetic factors and cognitive biomarkers—such as gray matter volume and cortical thickness—may overshadow the influence of psychiatric symptoms, particularly at baseline. This finding aligns with recent findings in the meta-analysis by Mallo et al. (2020), which shows that while psychiatric symptoms are generally associated with cognitive decline, heterogeneity across studies indicates that these symptoms may not always serve as significant predictors, especially in the early stages of MCI.
In summary, the baseline variables such as APOE ε4 status, MMSE scores, and FAS scores stand out as significant predictors, highlighting the potential for targeted early interventions.
Latency component of the MCM: Predictors of stable recovery
The latency component of the penalized MCM revealed a complex interplay of structural MRI features and clinical measures in predicting the rate of stable reverse migration. These findings underscore the importance of both neuroanatomical characteristics and clinical factors in shaping cognitive recovery, highlighting that while some structural features are associated with faster recovery, others may hinder it, challenging the traditional assumption that larger cortical thickness or greater volumes are universally protective.
The positive association of left rostral middle frontal thickness with faster recovery aligns with the well-documented role of the frontal cortex in executive functions and cognitive flexibility (Sattari et al., 2022; Stuss & Levine, 2002). The frontal cortex is critically involved in processes such as planning, cognitive control, and working memory. Thus, increased cortical thickness in this region may support neuroplasticity, allowing individuals to recruit compensatory neural networks, facilitating cognitive recovery more effectively. This finding is consistent with prior research suggesting that preserved or enhanced structural integrity in the frontal regions may bolster cognitive reserve and support adaptive mechanisms (Stern, 2002).
Similarly, the association between left medial orbitofrontal volume and faster recovery highlights the importance of regions involved in emotional regulation, decision-making, and reward processing (Rolls, 2019). These findings are in line with prior work suggesting that structural integrity in areas related to emotional processing could aid cognitive recovery, especially in the context of MCI, where maintaining emotional and cognitive stability is crucial.
However, the negative associations observed in regions such as right frontal pole thickness (HR=0.48) and right transverse temporal volume (HR=0.50) challenge the notion that larger cortical measurements in these areas necessarily predict better outcomes. These results are consistent with recent findings (Williams et al., 2023) indicating that increased cortical thickness or volume in certain regions may not always be protective. Instead, these features may reflect maladaptive neuroplasticity or pathological processes such as neuroinflammation or tau pathology, which are associated with slower recovery rates (Dickerson et al., 2009). The frontal pole and transverse temporal regions are involved in higher-order cognitive functions such as decision-making and auditory processing, and alterations in these regions may signal early disruptions in the brain's compensatory capacity, preventing successful cognitive recovery.
Additionally, the moderate negative associations found in regions like left pericalcarine thickness (HR=0.73) and left frontal pole volume (HR=0.79) support this nuanced interpretation. These areas, involved in visual processing and executive integration, show that increased thickness or volume in these regions may not necessarily promote recovery. Instead, they may reflect compensatory neural processes that, while initially adaptive, are inefficient in the long term. This observation diverges from previous studies that have emphasized the protective nature of cortical integrity in these regions (Stern, 2002), highlighting the importance of understanding regional specificity in recovery pathways.
Clinical assessments also played a role in predicting recovery outcomes. The higher total NPI-Q scores, which indicate a greater neuropsychiatric burden, were associated with slower recovery rates. This finding is consistent with earlier studies linking neuropsychiatric symptoms, particularly depression and anxiety, with reduced cognitive recovery (Enache et al., 2011). Neuropsychiatric symptoms may interfere with recovery-promoting behaviors, such as cognitive engagement and physical activity, and may exacerbate neurobiological stress, hindering the neuroplasticity required for successful recovery.
In conclusion, the latency component of the MCM highlights the complexity of recovery trajectories in individuals with CDR=0.5. Increased cortical thickness and volume in certain regions facilitate recovery, while in others, such structural changes may hinder it, suggesting maladaptive neuroplasticity or the presence of early neurodegenerative processes. These findings emphasize the importance of regional specificity in interpreting structural biomarkers and caution against viewing cortical measurements as universally protective factors. Future research should aim to delineate the underlying mechanisms of these contrasting effects, focusing on the interplay of structural changes, neuropsychiatric symptoms, and recovery-promoting interventions.
Incidence component of the MCM: Predictors of resistance to stable recovery
The incidence component of the penalized MCM provides important insights into the structural and clinical factors that increase the likelihood of individuals remaining in an impaired or fluctuating state rather than achieving stable reverse migration. These findings offer a critical perspective on the barriers to cognitive recovery and highlight potential avenues for targeted interventions.
Key structural MRI features identified as contributors to resistance to recovery included regions, such as the left bankssts volume, right superior frontal thickness, and left parahippocampal thickness and volume. Notably, the left bankssts volume demonstrated the strongest association, with an odds ratio of 2.21, indicating that a 1 standard deviation increase in this region more than doubles the odds of remaining impaired. This finding aligns with prior studies suggesting that larger cortical volume in certain regions may reflect compensatory but inefficient neuroplasticity, where the brain attempts to maintain function but with limited success, potentially due to maladaptive structural changes (Dickerson et al., 2009).
Similarly, right superior frontal thickness (OR=1.68) and left parahippocampal thickness (OR=1.48) were associated with slower recovery rates. These regions are involved in cognitive functions such as memory integration, executive control, and sensory processing, indicating that disruptions or larger volumes in these areas may hinder the brain's capacity to engage in effective neuroplastic adaptation, leading to resistance to recovery. The findings suggest that larger structures in these areas may signal pathological neuroplasticity, preventing true cognitive improvement.
Conversely, certain structural features were found to be protective against resistance to recovery. The left pars orbitalis thickness (OR=0.56) emerged as the most significant protective factor, reducing the likelihood of resistance by 44% for every 1 standard deviation increase. The right pericalcarine thickness (OR=0.73) and left insula thickness (OR=0.75) also exhibited protective effects, with smaller volumes in these regions associated with lower odds of resistance to recovery. These findings align with studies that emphasize the importance of preserved structural integrity in certain brain regions, which can promote neural resilience and functional recovery (Stern, 2002). Smaller volumes in these areas might indicate efficient compensatory changes or structural integrity that supports cognitive recovery in individuals with MCI.
Clinical factors also played a crucial role in understanding resistance to recovery. Higher BMI (OR=1.2) was associated with an increased likelihood of remaining impaired, aligning with existing literature that links obesity and systemic inflammation to cognitive decline and neurovascular burden (Dye et al., 2017). On the other hand, higher functional status, as indicated by higher total FAS scores (OR=0.51), reduced the odds of resistance to recovery. This result is somewhat counter to typical findings, which generally associate greater functional impairment with poorer recovery outcomes (Cumming et al., 2008; Needham et al., 2012). However, our study suggests that individuals with higher functional impairment may have received more targeted interventions or support, which could have facilitated recovery despite their higher FAS scores. This observation points to the importance of personalized interventions that take functional status into account.
These findings contribute to the growing body of evidence that structural features interact in complex ways to influence resistance to cognitive recovery. While larger cortical volumes in certain regions, such as the bankssts, may reflect inefficient compensatory mechanisms, smaller structures in protective regions, such as the pars orbitalis and insula, may reflect areas where structural integrity promotes neural resilience. These results are consistent with recent studies challenging the assumption that increased cortical thickness or volume is always beneficial. Instead, they highlight the need for a nuanced interpretation of these markers, considering their potential to either support or hinder cognitive recovery depending on the context (de Chastelaine et al., 2023).
The findings from the incidence component underscore the multifaceted nature of resistance to recovery. By identifying both risk and protective factors, this study provides a roadmap for personalized interventions. Strategies such as targeted cognitive rehabilitation, weight management, and functional impairment training hold promise for reducing resistance to recovery and enhancing the likelihood of stable reverse migration.
Limitations and future research directions
While this study provides valuable insights into the predictors of recovery and resistance to stable reverse migration, several limitations should be acknowledged. Addressing these limitations in future research will enhance the robustness and applicability of the findings.
Sample characteristics and generalizability
The study focused on individuals with a baseline CDR score of 0.5, representing a specific cognitive trajectory. This approach allows for a detailed exploration of recovery and resistance but may not generalize to broader populations with different cognitive statuses or neurological conditions. Our study specifically addresses the underexplored transition from CDR=0.5 to CDR=0, which has received limited attention in previous studies, including Duran et al. (2022) and Wilks et al. (2024).
While this focused approach is a strong point, it also presents a limitation in terms of sample characteristics. Future research should include individuals with other cognitive states, such as those with NC (CDR=0) or more advanced cognitive impairments (CDR >0.5), and more diverse demographic cohorts. This approach would help clarify the generalizability of our findings and identify unique predictors of cognitive recovery and resistance across different cognitive stages.
Additionally, our study used a ±1-year window for matching clinical and MRI data, which was necessary for dataset completeness but may have introduced variability in the temporal alignment of assessments. This temporal mismatch could affect the precision of the observed relationships between neuroimaging features and clinical outcomes.
To further validate our findings and explore their applicability across different contexts, future research could apply the model to datasets from studies such as Duran et al. (2022) or Wilks et al. (2024). Comparative analysis of these datasets could provide additional insights and strengthen the generalizability of our results across varying populations and clinical settings.
Complex dynamics of feature influence in MCM components
The results of the MCM highlight how structural MRI features influence the rate of stable reverse migration (latency) and resistance to recovery (cure component). While most features exhibit expected patterns—where protective effects on recovery rates align with reduced resistance—one feature demonstrates a distinct and paradoxical role.
Right supramarginal thickness is associated with HR >1 (1.24) in the latency component and OR >1 (1.48) in the cure component. This paradoxical pattern suggests a complex, context-dependent role for this feature. It may facilitate reverse migration by enhancing compensatory mechanisms or structural resilience in individuals predisposed to recovery (Stern, 2002). Under certain conditions, it might contribute to resistance, possibly due to the persistence of pathological states in individuals with greater impairments (de Chastelaine et al., 2023; Williams et al., 2023).
The duality in the effects of right supramarginal thickness is rare but not unprecedented in the literature on cure models. It underscores the complexity of structural brain features in recovery dynamics, reflecting potential heterogeneity in their mechanisms of action across different subpopulations or clinical contexts. Alternatively, the feature may represent a proxy for two competing processes: Promoting compensatory mechanisms in some individuals while reflecting maladaptive structural changes in others. This paradoxical role aligns with recent conceptualizations of cortical thickness alterations, which propose that regional brain metrics may serve as biomarkers for adaptive or maladaptive processes depending on the pathological context (Dickerson et al., 2009; Stern, 2002).
These findings emphasize the multifaceted roles of structural MRI features in the recovery process. Future research should explore the mechanisms underlying these dynamics to tailor interventions that maximize recovery potential and minimize resistance, ultimately improving patient outcomes. Validation using multi-modal imaging techniques such as positron emission tomography (PET) and functional MRI (fMRI), along with cross-validation in independent datasets (e.g. ADNI, AIBL), will be essential to better understand these complex relationships and their implications for clinical practice.
Potential interventions and causality
The study's observational design limits its ability to establish causal relationships between identified predictors and cognitive outcomes. Interventional studies that target modifiable factors, such as functional impairment in daily activities or BMI, will be critical for confirming their causal roles in recovery or resistance. Moreover, exploring the efficacy of interventions tailored to specific structural vulnerabilities, such as neuromodulation or cognitive training focused on regions like the frontal pole or parahippocampal cortex, could yield actionable insights.
5. Conclusion
This study provides a nuanced understanding of cognitive trajectories in individuals with CDR=0.5, highlighting the dual pathways of stable reverse migration (recovery) and resistance to recovery. By using the penalized MCM, we identified key structural MRI features and clinical measures that predict both recovery likelihood and timing. Key regions such as the left rostral middle frontal cortex and left medial orbitofrontal volume facilitate recovery, while right frontal pole and left bankssts volume are linked to resistance. These findings emphasize that increased cortical thickness or volume can either promote recovery or reflect maladaptive neuroplasticity, depending on the region.
This work also highlights the importance of addressing modifiable factors like neuropsychiatric symptoms and BMI. Lifestyle interventions, including weight management, physical activity, and psychiatric care, may enhance recovery outcomes. These results underscore the need for personalized interventions that combine neuroimaging, psychiatric management, and lifestyle modifications to optimize cognitive recovery. This work bridges structural neuroscience and clinical practice, laying the foundation for future research aimed at developing targeted strategies to maintain cognitive health.
Ethical Considerations
Compliance with ethical guidelines
We clarified the ethical considerations properly under compliance with ethical guidelines, specifying that data were obtained from the OASIS-3 project after approval of our request and signing the official data use agreement.
Funding
This paper was extracted from the PhD dissertation of Vida Pahlevani, approved by the Department of Biostatistics, Faculty of Medical Sciences, Tarbiat Modares University, Tehran, Iran. This research did not receive any grant from funding agencies in the public, commercial, or non-profit sectors.
Authors' contributions
Conceptualization: Vida Pahlevani and Ebrahim Hajizadeh; Resources: Ebrahim Hajizadeh and Mostafa Almasi-Dooghaee; Validation: Farzad Eskanadri and Ebrahim Hajizadeh; Methodology and formal analysis: Vida Pahlevani and Farzad Eskanadri; Investigation: Vida Pahlevani and Mostafa Almasi-Dooghaee; Data curation, software, visualization and writing the original draft: Vida Pahlevani; Review and editing: All authors; Supervision and project administration: Ebrahim Hajizadeh.
Conflict of interest
The authors declared no conflict of interest.
Acknowledgments
The authors express their gratitude to the participants and investigators of the OASIS-3 project for generously sharing their data and expertise.
Reference
Angevaare, M. J., Vonk, J. M. J., Bertola, L., Zahodne, L., Watson, C. W., & Boehme, A., et al. (2022). Predictors of Incident Mild Cognitive Impairment and Its Course in a Diverse Community-Based Population. Neurology, 98(1), e15-e26. [DOI:10.1212/WNL.0000000000013017] [PMID]
Cox, D. R. (1972). Regression Models and Life-Tables. Journal of the Royal Statistical Society: Series B (Methodological), 34(2), 187-202. [DOI:10.1111/j.2517-6161.1972.tb00899.x]
Cumming, T. B., Collier, J., Thrift, A. G., & Bernhardt, J. (2008). The effect of very early mobilisation after stroke on psychological well-being. Journal of Rehabilitation Medicine, 40(8), 609-614. [DOI:10.2340/16501977-0226] [PMID]
de Chastelaine, M., Srokova, S., Hou, M., Kidwai, A., Kafafi, S. S., & Racenstein, M. L., et al. (2023). Cortical thickness, gray matter volume, and cognitive performance: A crosssectional study of the moderating effects of age on their interrelationships. Cerebral Cortex (New York, N.Y.: 1991), 33(10), 6474-6485. [DOI:10.1093/cercor/bhac518] [PMID]
Davison, A. C., & Hinkley, D. V. (1997). Bootstrap methods and their application. Cambridge: Cambridge University Press. [Link]
Deckers, K., van Boxtel, M. P. J., Verhey, F. R. J., & Köhler, S. (2017). Obesity and cognitive decline in adults: Effect of methodological choices and confounding by age in a longitudinal study. The Journal of Nutrition, Health and Aging, 21(5), 546-553. [DOI:10.1007/s12603-016-0757-3] [PMID]
Dickerson, B. C., Bakkour, A., Salat, D. H., Feczko, E., Pacheco, J., & Greve, D. N., et al. (2009). The cortical signature of Alzheimer’s Disease: Regionally specific cortical thinning relates to symptom severity in very mild to Mild AD dementia and is detectable in asymptomatic amyloid-positive individuals. Cerebral Cortex (New York, NY), 19(3), 497-510. [DOI:10.1093/cercor/bhn113] [PMID]
Dregan, A., Stewart, R., & Gulliford, M. C. (2013). Cardiovascular risk factors and cognitive decline in adults aged 50 and over: A population-based cohort study. Age and Ageing, 42(3), 338-345. [DOI:10.1093/ageing/afs166] [PMID]
Duran, T., Bateman, J. R., Williams, B. J., Espeland, M. A., Hughes, T. M., & Okonmah-Obazee, S., et al. (2022). Neuroimaging and clinical characteristics of cognitive migration in community-dwelling older adults. NeuroImage: Clinical, 36, 103232. [DOI:10.1016/j.nicl.2022.103232] [PMID]
Dye, L., Boyle, N. B., Champ, C., & Lawton, C. (2017). The relationship between obesity and cognitive health and decline. The Proceedings of the Nutrition Society, 76(4), 443–454.[DOI:10.1017/S0029665117002014] [PMID]
Enache, D., Winblad, B., & Aarsland, D. (2011). Depression in dementia: Epidemiology, mechanisms, and treatment. Current Opinion in Psychiatry, 24(6), 461-472. [DOI:10.1097/YCO.0b013e32834bb9d4] [PMID]
Fu, H., & Archer, K. J. (2024). hdcuremodels: Penalized Mixture Cure Models for High-Dimensional Data (Version 0.0.1) [Computer software]. Retrieved from: [Link]
Fischl B. (2012). FreeSurfer. NeuroImage, 62(2), 774–781. [DOI:10.1016/j.neuroimage.2012.01.021] [PMID]
Fu, H., Nicolet, D., Mrózek, K., Stone, R. M., Eisfeld, A., & Byrd, J. C., et al. (2022). Controlled variable selection in Weibull mixture cure models for high‐dimensional data. Statistics in Medicine, 41(22), 4340-4366. [DOI:10.1002/sim.9513] [PMID]
Fu, H., Nicolet, D., Mrózek, K., Stone, R. M., Eisfeld, A. K., & Byrd, J. C., et al. (2022). Controlled variable selection in Weibull mixture cure models for high-dimensional data. Statistics in Medicine, 41(22), 4340-4366. [DOI:10.1002/sim.9513] [PMID]
Hampel, H., & Lista, S. (2016). The rising global tide of cognitive impairment. Nature Reviews. Neurology, 12(3), 131-132. [DOI:10.1038/nrneurol.2015.250] [PMID]
Jack, C. R., Bennett, D. A., Blennow, K., Carrillo, M. C., Dunn, B., & Haeberlein, S. B., et al. (2018). NIA‐AA research framework: Toward a biological definition of Alzheimer’s disease. Alzheimer’s & Dementia, 14(4), 535-562. [DOI:10.1016/j.jalz.2018.02.018] [PMID]
Kim, S., Kim, Y., & Park, S. M. (2016). Body Mass Index and decline of cognitive function. Plos One, 11(2), e0148908. [DOI:10.1371/journal.pone.0148908] [PMID]
LaMontagne, P. J., Benzinger, T. L., Morris, J. C., Keefe, S., Hornbeck, R., & Xiong, C., et al. (2019). OASIS-3: Longitudinal neuroimaging, clinical, and cognitive dataset for normal aging and Alzheimer disease. MedRxiv. [Preprint]. [DOI:10.1101/2019.12.13.19014902]
Liu, C. C., Liu, C. C., Kanekiyo, T., Xu, H., & Bu, G. (2013). Apolipoprotein E and Alzheimer disease: Risk, mechanisms and therapy. Nature Reviews. Neurology, 9(2), 106–118. [DOI:10.1038/nrneurol.2012.263] [PMID]
Maller, R. A., Zhou, X., & NetLibrary, I. (1996). Survival analysis with long-term survivors. Hoboken: Wiley. [Link]
Mallo, S. C., Patten, S. B., Ismail, Z., Pereiro, A. X., Facal, D., & Otero, C., et al. (2020). Does the neuropsychiatric inventory predict progression from mild cognitive impairment to dementia? A systematic review and meta-analysis. Ageing Research Reviews, 58, 101004. [DOI:10.1016/j.arr.2019.101004] [PMID]
Morris J. C. (1993). The clinical dementia rating (CDR): Current version and scoring rules. Neurology, 43(11), 2412–2414. [DOI: 10.1212/wnl.43.11.2412-a] [PMID]
Needham, D. M., Davidson, J., Cohen, H., Hopkins, R. O., Weinert, C., & Wunsch, H., et al. (2012). Improving long-term outcomes after discharge from intensive care unit: Report from a stakeholders’ conference. Critical Care Medicine, 40(2), 502–509. [DOI:10.1097/CCM.0b013e318232da75] [PMID]
Rabin, J. S., Neal, T. E., Nierle, H. E., Sikkes, S. A. M., Buckley, R. F., & Amariglio, R. E., et al. (2020). Multiple markers contribute to risk of progression from normal to mild cognitive impairment. NeuroImage. Clinical, 28, 102400. [DOI:10.1016/j.nicl.2020.102400] [PMID]
Riedel, B. C., Thompson, P. M., & Brinton, R. D. (2016). Age, APOE and sex: Triad of risk of Alzheimer’s disease. The Journal of Steroid Biochemistry and Molecular Biology, 160, 134-147. [DOI:10.1016/j.jsbmb.2016.03.012] [PMID]
Rolls, E. T. (2019). The Orbitofrontal Cortex. Oxford: Oxford University Press. [DOI:10.1093/oso/9780198845997.001.0001]
Sattari, N., Faeghi, F., Shekarchi, B., & Heidari, M. H. (2022). Assessing the changes of cortical thickness in Alzheimer Disease With MRI Using Freesurfer Software. Basic and Clinical Neuroscience, 13(2), 185-192. [DOI:10.32598/bcn.2021.1779.1] [PMID]
Sperling, R. A., Mormino, E. C., Schultz, A. P., Betensky, R. A., Papp, K. V., & Amariglio, R. E., et al. (2019). The impact of amyloid-beta and tau on prospective cognitive decline in older individuals. Annals of Neurology, 85(2), 181-193. [DOI:10.1002/ana.25395] [PMID]
Stern, Y. (2002). What is cognitive reserve? Theory and research application of the reserve concept. Journal of the International Neuropsychological Society, 8(3), 448-460. [DOI:10.1017/S1355617702813248] [PMID]
Stuss, D. T., & Levine, B. (2002). Adult clinical neuropsychology: Lessons from studies of the frontal lobes. Annual Review of Psychology, 53, 401-433. [DOI:10.1146/annurev.psych.53.100901.135220] [PMID]
Teng, E., Becker, B. W., Woo, E., Knopman, D. S., Cummings, J. L., & Lu, P. H. (2010). Utility of the functional activities questionnaire for distinguishing mild cognitive impairment from very mild Alzheimer disease. Alzheimer Disease & Associated Disorders, 24(4), 348-353. [DOI:10.1097/WAD.0b013e3181e2fc84] [PMID]
Wilks, H., Benzinger, T. L. S., Schindler, S. E., Cruchaga, C., Morris, J. C., & Hassenstab, J. (2024). Predictors and outcomes of fluctuations in the clinical dementia rating scale. Alzheimer’s & Dementia: The Journal of the Alzheimer’s Association, 20(3), 2080-2088. [DOI:10.1002/alz.13679] [PMID]
Williams, M. E., Elman, J. A., Bell, T. R., Dale, A. M., Eyler, L. T., & Fennema-Notestine, C., et al. (2023). Higher cortical thickness/volume in Alzheimer’s-related regions: Protective factor or risk factor? Neurobiology of Aging, 129, 185-194. [DOI:10.1016/j.neurobiolaging.2023.05.004] [PMID]
Zatorre, R. J., Fields, R. D., & Johansen-Berg, H. (2012). Plasticity in gray and white: Neuroimaging changes in brain structure during learning. Nature Neuroscience, 15(4), 528-536. [DOI:10.1038/nn.3045] [PMID]
Zhao, X., & Zhou, X. (2008). Discrete-time survival models with long-term survivors. Statistics in Medicine, 27(8), 1261–1281. [PMID]
Penalized MCM outcomes: Latency component
The penalized MCM identified several standardized structural MRI features significantly associated with the rate of stable reverse migration from a CDR score of 0.5 to 0 (Table 2).
Features with HRs deviating by less than 10% from 1 were excluded, as such small deviations are unlikely to be clinically significant. Features with HR greater than one, such as left rostral middle frontal thickness (hazard ratio [HR]=2.06), left medial orbitofrontal volume (HR=1.37), right supramarginal thickness (HR=1.24), and right precentral thickness (HR=1.18), were linked to faster recovery rates.
Conversely, features with HR less than one, including right frontal pole thickness (HR=0.48), right transverse temporal volume (HR=0.50), left pericalcarine thickness (HR=0.73), left frontal pole volume (HR=0.79), right inferior temporal volume (HR=0.85), and left posterior cingulate thickness (HR=0.86), were associated with slower recovery rates. The increase in these features suggests that larger values may reflect maladaptive neuroplasticity, where the brain may compensate in ways that are not conducive to cognitive recovery. These structural changes could represent early neurodegenerative processes that impair brain function over time, limiting the potential for full recovery.
Additionally, the clinical measure total NPI-Q was significantly associated with a slower recovery rate (HR=0.8163). This further supports the idea that neuropsychiatric symptoms hinder cognitive recovery by interfering with essential neural circuits for memory and executive function.
Penalized MCM outcomes: Incidence component
Similar to the latency component, the penalized MCM identified several structural MRI features and clinical measures significantly associated with the probability of resistance to stable reverse migration (Table 3).
Structural features with odds ratios (OR) greater than one, such as left bankssts volume (OR=2.21), right superior frontal thickness (OR=1.68), right supramarginal thickness (OR=1.48), and right inferior parietal thickness (OR=1.30), were linked to higher odds of remaining impaired or fluctuating. These features, particularly in regions involved in higher cognitive functions and sensory integration, may reflect maladaptive compensatory mechanisms or neuroplasticity, which might hinder recovery and contribute to resistance to reverse migration.
Conversely, features with OR less than one, including left pars orbitalis thickness (OR=0.56), right pericalcarine thickness (OR=0.73), and left insula thickness (OR=0.75), were associated with lower odds of resistance to recovery, suggesting that decreased cortical thickness in these regions could be linked to a better likelihood of recovery.
Additionally, higher BMI (OR=1.20) increased the odds of remaining impaired, while higher FAS scores (OR=0.51) reduced the odds of resistance to recovery, indicating the significant role of functional abilities and BMI in predicting recovery outcomes.
Model performance assessment: C-concordance index and AUC
The penalized MCM demonstrated strong predictive performance, assessed using the C-concordance index (C-index) and AUC based on 2000 bootstrap samples. The C-index evaluates how well the model predicts the timing of stable reverse migration, with a value of 0.845 (95% CI, 0.843%, 0.872%), indicating excellent accuracy in identifying individuals likely to recover sooner compared to those who recover later or not at all.
The AUC measures the model's ability to classify individuals as resistant or susceptible to stable reverse migration. The AUC value of 0.905 (95% CI, 0.900%, 0.905%) highlights the model's strong classification performance. These results validate the model's robustness in predicting recovery timing and resistance likelihood in individuals with MCI.
4. Discussion
In this study, we adopted a penalized MCM to examine the dual pathways of recovery (stable reverse migration) and resistance to it. This approach distinguishes our work from traditional analyses by capturing both the subgroup of participants who genuinely revert to NC and remain there, as well as those who resist stable recovery. By integrating high-dimensional neuroimaging features and key clinical variables (e.g. BMI, FAS scores) into the same modeling framework, we have offered a more comprehensive understanding of the factors influencing cognitive trajectories. The robust performance indices (C-index and AUC) underscore the reliability of this method in identifying specific brain regions and clinical measures that either facilitate recovery or predispose individuals to sustained impairment. This uniqueness lies in the model's ability to illuminate how structural and clinical factors interact to shape not just the risk of decline, but also the realistic potential for cognitive improvement.
Description of baseline clinical characteristics between study groups
The analysis of baseline clinical characteristics between the stable reverse migrators and impaired or fluctuated groups revealed only modest differences. While these variables may not exhibit stark contrasts at the group level, they could serve as early indicators of trajectories toward stable reverse migration (recovery) or resistance to recovery. Such baseline factors provide valuable insights into potential predictors of cognitive outcomes and may guide targeted interventions.
The lack of significant differences in demographic factors such as gender, SES, and BMI is consistent with some previous studies that highlight the limited role of these variables in early cognitive trajectories. However, their subtle contributions should not be dismissed. SES and BMI, for instance, have been linked to long-term cognitive health in broader populations, with SES reflecting access to resources and cognitive stimulation (Stern, 2002) and BMI indicating systemic health influences on the brain (Kim et al., 2016). While these variables may not directly differentiate recovery and resistance at baseline, they could interact with other factors over time, influencing long-term trajectories.
The observed differences in APOE ε4 status underline its role as an important early indicator of resistance to recovery. Individuals in the impaired or fluctuated group exhibited a higher prevalence of APOE ε4, aligning with its established association with increased amyloid beta deposition and reduced synaptic plasticity (Liu et al., 2013). This genetic predisposition may set the stage for more pronounced cognitive challenges, making APOE ε4 a critical focus for early risk assessment and intervention.
Baseline cognitive function, as measured by MMSE scores, demonstrated significant differences between groups, even though the differences were small at entry. These findings highlight the potential of MMSE as an early marker of stable reverse migration, emphasizing that even slight variations in cognitive function at baseline should not be overlooked. The higher MMSE scores observed in the stable reverse migrators group suggest that individuals with better baseline cognitive abilities may possess greater neural reserve, enabling recovery despite underlying neuropathology (Stern, 2002). This finding underscores the importance of routine cognitive assessments to identify individuals with a higher likelihood of recovery and to implement early cognitive training programs that enhance compensatory mechanisms.
Functional impairment in daily activities, captured by the FAS, was another significant differentiator between groups. Stable reverse migrators demonstrated lower FAS at baseline, highlighting the importance of functional assessments as predictors of recovery. FAS not only reflects cognitive health but also points to an individual's ability to engage in adaptive behaviors and maintain quality of life, which are critical for successful recovery (Teng et al., 2010).
The absence of significant differences in neuropsychiatric symptoms, as measured by the NPI-Q and GDS, suggests that these factors may not serve as strong early indicators of cognitive recovery or resistance to recovery in the current subpopulation of the dataset. This finding contrasts with several studies that emphasize the role of depression and behavioral symptoms in accelerating cognitive decline (Enache et al., 2011; Wilks et al., 2024). However, it is possible that, in this specific cohort, genetic factors and cognitive biomarkers—such as gray matter volume and cortical thickness—may overshadow the influence of psychiatric symptoms, particularly at baseline. This finding aligns with recent findings in the meta-analysis by Mallo et al. (2020), which shows that while psychiatric symptoms are generally associated with cognitive decline, heterogeneity across studies indicates that these symptoms may not always serve as significant predictors, especially in the early stages of MCI.
In summary, the baseline variables such as APOE ε4 status, MMSE scores, and FAS scores stand out as significant predictors, highlighting the potential for targeted early interventions.
Latency component of the MCM: Predictors of stable recovery
The latency component of the penalized MCM revealed a complex interplay of structural MRI features and clinical measures in predicting the rate of stable reverse migration. These findings underscore the importance of both neuroanatomical characteristics and clinical factors in shaping cognitive recovery, highlighting that while some structural features are associated with faster recovery, others may hinder it, challenging the traditional assumption that larger cortical thickness or greater volumes are universally protective.
The positive association of left rostral middle frontal thickness with faster recovery aligns with the well-documented role of the frontal cortex in executive functions and cognitive flexibility (Sattari et al., 2022; Stuss & Levine, 2002). The frontal cortex is critically involved in processes such as planning, cognitive control, and working memory. Thus, increased cortical thickness in this region may support neuroplasticity, allowing individuals to recruit compensatory neural networks, facilitating cognitive recovery more effectively. This finding is consistent with prior research suggesting that preserved or enhanced structural integrity in the frontal regions may bolster cognitive reserve and support adaptive mechanisms (Stern, 2002).
Similarly, the association between left medial orbitofrontal volume and faster recovery highlights the importance of regions involved in emotional regulation, decision-making, and reward processing (Rolls, 2019). These findings are in line with prior work suggesting that structural integrity in areas related to emotional processing could aid cognitive recovery, especially in the context of MCI, where maintaining emotional and cognitive stability is crucial.
However, the negative associations observed in regions such as right frontal pole thickness (HR=0.48) and right transverse temporal volume (HR=0.50) challenge the notion that larger cortical measurements in these areas necessarily predict better outcomes. These results are consistent with recent findings (Williams et al., 2023) indicating that increased cortical thickness or volume in certain regions may not always be protective. Instead, these features may reflect maladaptive neuroplasticity or pathological processes such as neuroinflammation or tau pathology, which are associated with slower recovery rates (Dickerson et al., 2009). The frontal pole and transverse temporal regions are involved in higher-order cognitive functions such as decision-making and auditory processing, and alterations in these regions may signal early disruptions in the brain's compensatory capacity, preventing successful cognitive recovery.
Additionally, the moderate negative associations found in regions like left pericalcarine thickness (HR=0.73) and left frontal pole volume (HR=0.79) support this nuanced interpretation. These areas, involved in visual processing and executive integration, show that increased thickness or volume in these regions may not necessarily promote recovery. Instead, they may reflect compensatory neural processes that, while initially adaptive, are inefficient in the long term. This observation diverges from previous studies that have emphasized the protective nature of cortical integrity in these regions (Stern, 2002), highlighting the importance of understanding regional specificity in recovery pathways.
Clinical assessments also played a role in predicting recovery outcomes. The higher total NPI-Q scores, which indicate a greater neuropsychiatric burden, were associated with slower recovery rates. This finding is consistent with earlier studies linking neuropsychiatric symptoms, particularly depression and anxiety, with reduced cognitive recovery (Enache et al., 2011). Neuropsychiatric symptoms may interfere with recovery-promoting behaviors, such as cognitive engagement and physical activity, and may exacerbate neurobiological stress, hindering the neuroplasticity required for successful recovery.
In conclusion, the latency component of the MCM highlights the complexity of recovery trajectories in individuals with CDR=0.5. Increased cortical thickness and volume in certain regions facilitate recovery, while in others, such structural changes may hinder it, suggesting maladaptive neuroplasticity or the presence of early neurodegenerative processes. These findings emphasize the importance of regional specificity in interpreting structural biomarkers and caution against viewing cortical measurements as universally protective factors. Future research should aim to delineate the underlying mechanisms of these contrasting effects, focusing on the interplay of structural changes, neuropsychiatric symptoms, and recovery-promoting interventions.
Incidence component of the MCM: Predictors of resistance to stable recovery
The incidence component of the penalized MCM provides important insights into the structural and clinical factors that increase the likelihood of individuals remaining in an impaired or fluctuating state rather than achieving stable reverse migration. These findings offer a critical perspective on the barriers to cognitive recovery and highlight potential avenues for targeted interventions.
Key structural MRI features identified as contributors to resistance to recovery included regions, such as the left bankssts volume, right superior frontal thickness, and left parahippocampal thickness and volume. Notably, the left bankssts volume demonstrated the strongest association, with an odds ratio of 2.21, indicating that a 1 standard deviation increase in this region more than doubles the odds of remaining impaired. This finding aligns with prior studies suggesting that larger cortical volume in certain regions may reflect compensatory but inefficient neuroplasticity, where the brain attempts to maintain function but with limited success, potentially due to maladaptive structural changes (Dickerson et al., 2009).
Similarly, right superior frontal thickness (OR=1.68) and left parahippocampal thickness (OR=1.48) were associated with slower recovery rates. These regions are involved in cognitive functions such as memory integration, executive control, and sensory processing, indicating that disruptions or larger volumes in these areas may hinder the brain's capacity to engage in effective neuroplastic adaptation, leading to resistance to recovery. The findings suggest that larger structures in these areas may signal pathological neuroplasticity, preventing true cognitive improvement.
Conversely, certain structural features were found to be protective against resistance to recovery. The left pars orbitalis thickness (OR=0.56) emerged as the most significant protective factor, reducing the likelihood of resistance by 44% for every 1 standard deviation increase. The right pericalcarine thickness (OR=0.73) and left insula thickness (OR=0.75) also exhibited protective effects, with smaller volumes in these regions associated with lower odds of resistance to recovery. These findings align with studies that emphasize the importance of preserved structural integrity in certain brain regions, which can promote neural resilience and functional recovery (Stern, 2002). Smaller volumes in these areas might indicate efficient compensatory changes or structural integrity that supports cognitive recovery in individuals with MCI.
Clinical factors also played a crucial role in understanding resistance to recovery. Higher BMI (OR=1.2) was associated with an increased likelihood of remaining impaired, aligning with existing literature that links obesity and systemic inflammation to cognitive decline and neurovascular burden (Dye et al., 2017). On the other hand, higher functional status, as indicated by higher total FAS scores (OR=0.51), reduced the odds of resistance to recovery. This result is somewhat counter to typical findings, which generally associate greater functional impairment with poorer recovery outcomes (Cumming et al., 2008; Needham et al., 2012). However, our study suggests that individuals with higher functional impairment may have received more targeted interventions or support, which could have facilitated recovery despite their higher FAS scores. This observation points to the importance of personalized interventions that take functional status into account.
These findings contribute to the growing body of evidence that structural features interact in complex ways to influence resistance to cognitive recovery. While larger cortical volumes in certain regions, such as the bankssts, may reflect inefficient compensatory mechanisms, smaller structures in protective regions, such as the pars orbitalis and insula, may reflect areas where structural integrity promotes neural resilience. These results are consistent with recent studies challenging the assumption that increased cortical thickness or volume is always beneficial. Instead, they highlight the need for a nuanced interpretation of these markers, considering their potential to either support or hinder cognitive recovery depending on the context (de Chastelaine et al., 2023).
The findings from the incidence component underscore the multifaceted nature of resistance to recovery. By identifying both risk and protective factors, this study provides a roadmap for personalized interventions. Strategies such as targeted cognitive rehabilitation, weight management, and functional impairment training hold promise for reducing resistance to recovery and enhancing the likelihood of stable reverse migration.
Limitations and future research directions
While this study provides valuable insights into the predictors of recovery and resistance to stable reverse migration, several limitations should be acknowledged. Addressing these limitations in future research will enhance the robustness and applicability of the findings.
Sample characteristics and generalizability
The study focused on individuals with a baseline CDR score of 0.5, representing a specific cognitive trajectory. This approach allows for a detailed exploration of recovery and resistance but may not generalize to broader populations with different cognitive statuses or neurological conditions. Our study specifically addresses the underexplored transition from CDR=0.5 to CDR=0, which has received limited attention in previous studies, including Duran et al. (2022) and Wilks et al. (2024).
While this focused approach is a strong point, it also presents a limitation in terms of sample characteristics. Future research should include individuals with other cognitive states, such as those with NC (CDR=0) or more advanced cognitive impairments (CDR >0.5), and more diverse demographic cohorts. This approach would help clarify the generalizability of our findings and identify unique predictors of cognitive recovery and resistance across different cognitive stages.
Additionally, our study used a ±1-year window for matching clinical and MRI data, which was necessary for dataset completeness but may have introduced variability in the temporal alignment of assessments. This temporal mismatch could affect the precision of the observed relationships between neuroimaging features and clinical outcomes.
To further validate our findings and explore their applicability across different contexts, future research could apply the model to datasets from studies such as Duran et al. (2022) or Wilks et al. (2024). Comparative analysis of these datasets could provide additional insights and strengthen the generalizability of our results across varying populations and clinical settings.
Complex dynamics of feature influence in MCM components
The results of the MCM highlight how structural MRI features influence the rate of stable reverse migration (latency) and resistance to recovery (cure component). While most features exhibit expected patterns—where protective effects on recovery rates align with reduced resistance—one feature demonstrates a distinct and paradoxical role.
Right supramarginal thickness is associated with HR >1 (1.24) in the latency component and OR >1 (1.48) in the cure component. This paradoxical pattern suggests a complex, context-dependent role for this feature. It may facilitate reverse migration by enhancing compensatory mechanisms or structural resilience in individuals predisposed to recovery (Stern, 2002). Under certain conditions, it might contribute to resistance, possibly due to the persistence of pathological states in individuals with greater impairments (de Chastelaine et al., 2023; Williams et al., 2023).
The duality in the effects of right supramarginal thickness is rare but not unprecedented in the literature on cure models. It underscores the complexity of structural brain features in recovery dynamics, reflecting potential heterogeneity in their mechanisms of action across different subpopulations or clinical contexts. Alternatively, the feature may represent a proxy for two competing processes: Promoting compensatory mechanisms in some individuals while reflecting maladaptive structural changes in others. This paradoxical role aligns with recent conceptualizations of cortical thickness alterations, which propose that regional brain metrics may serve as biomarkers for adaptive or maladaptive processes depending on the pathological context (Dickerson et al., 2009; Stern, 2002).
These findings emphasize the multifaceted roles of structural MRI features in the recovery process. Future research should explore the mechanisms underlying these dynamics to tailor interventions that maximize recovery potential and minimize resistance, ultimately improving patient outcomes. Validation using multi-modal imaging techniques such as positron emission tomography (PET) and functional MRI (fMRI), along with cross-validation in independent datasets (e.g. ADNI, AIBL), will be essential to better understand these complex relationships and their implications for clinical practice.
Potential interventions and causality
The study's observational design limits its ability to establish causal relationships between identified predictors and cognitive outcomes. Interventional studies that target modifiable factors, such as functional impairment in daily activities or BMI, will be critical for confirming their causal roles in recovery or resistance. Moreover, exploring the efficacy of interventions tailored to specific structural vulnerabilities, such as neuromodulation or cognitive training focused on regions like the frontal pole or parahippocampal cortex, could yield actionable insights.
5. Conclusion
This study provides a nuanced understanding of cognitive trajectories in individuals with CDR=0.5, highlighting the dual pathways of stable reverse migration (recovery) and resistance to recovery. By using the penalized MCM, we identified key structural MRI features and clinical measures that predict both recovery likelihood and timing. Key regions such as the left rostral middle frontal cortex and left medial orbitofrontal volume facilitate recovery, while right frontal pole and left bankssts volume are linked to resistance. These findings emphasize that increased cortical thickness or volume can either promote recovery or reflect maladaptive neuroplasticity, depending on the region.
This work also highlights the importance of addressing modifiable factors like neuropsychiatric symptoms and BMI. Lifestyle interventions, including weight management, physical activity, and psychiatric care, may enhance recovery outcomes. These results underscore the need for personalized interventions that combine neuroimaging, psychiatric management, and lifestyle modifications to optimize cognitive recovery. This work bridges structural neuroscience and clinical practice, laying the foundation for future research aimed at developing targeted strategies to maintain cognitive health.
Ethical Considerations
Compliance with ethical guidelines
We clarified the ethical considerations properly under compliance with ethical guidelines, specifying that data were obtained from the OASIS-3 project after approval of our request and signing the official data use agreement.
Funding
This paper was extracted from the PhD dissertation of Vida Pahlevani, approved by the Department of Biostatistics, Faculty of Medical Sciences, Tarbiat Modares University, Tehran, Iran. This research did not receive any grant from funding agencies in the public, commercial, or non-profit sectors.
Authors' contributions
Conceptualization: Vida Pahlevani and Ebrahim Hajizadeh; Resources: Ebrahim Hajizadeh and Mostafa Almasi-Dooghaee; Validation: Farzad Eskanadri and Ebrahim Hajizadeh; Methodology and formal analysis: Vida Pahlevani and Farzad Eskanadri; Investigation: Vida Pahlevani and Mostafa Almasi-Dooghaee; Data curation, software, visualization and writing the original draft: Vida Pahlevani; Review and editing: All authors; Supervision and project administration: Ebrahim Hajizadeh.
Conflict of interest
The authors declared no conflict of interest.
Acknowledgments
The authors express their gratitude to the participants and investigators of the OASIS-3 project for generously sharing their data and expertise.
Reference
Angevaare, M. J., Vonk, J. M. J., Bertola, L., Zahodne, L., Watson, C. W., & Boehme, A., et al. (2022). Predictors of Incident Mild Cognitive Impairment and Its Course in a Diverse Community-Based Population. Neurology, 98(1), e15-e26. [DOI:10.1212/WNL.0000000000013017] [PMID]
Cox, D. R. (1972). Regression Models and Life-Tables. Journal of the Royal Statistical Society: Series B (Methodological), 34(2), 187-202. [DOI:10.1111/j.2517-6161.1972.tb00899.x]
Cumming, T. B., Collier, J., Thrift, A. G., & Bernhardt, J. (2008). The effect of very early mobilisation after stroke on psychological well-being. Journal of Rehabilitation Medicine, 40(8), 609-614. [DOI:10.2340/16501977-0226] [PMID]
de Chastelaine, M., Srokova, S., Hou, M., Kidwai, A., Kafafi, S. S., & Racenstein, M. L., et al. (2023). Cortical thickness, gray matter volume, and cognitive performance: A crosssectional study of the moderating effects of age on their interrelationships. Cerebral Cortex (New York, N.Y.: 1991), 33(10), 6474-6485. [DOI:10.1093/cercor/bhac518] [PMID]
Davison, A. C., & Hinkley, D. V. (1997). Bootstrap methods and their application. Cambridge: Cambridge University Press. [Link]
Deckers, K., van Boxtel, M. P. J., Verhey, F. R. J., & Köhler, S. (2017). Obesity and cognitive decline in adults: Effect of methodological choices and confounding by age in a longitudinal study. The Journal of Nutrition, Health and Aging, 21(5), 546-553. [DOI:10.1007/s12603-016-0757-3] [PMID]
Dickerson, B. C., Bakkour, A., Salat, D. H., Feczko, E., Pacheco, J., & Greve, D. N., et al. (2009). The cortical signature of Alzheimer’s Disease: Regionally specific cortical thinning relates to symptom severity in very mild to Mild AD dementia and is detectable in asymptomatic amyloid-positive individuals. Cerebral Cortex (New York, NY), 19(3), 497-510. [DOI:10.1093/cercor/bhn113] [PMID]
Dregan, A., Stewart, R., & Gulliford, M. C. (2013). Cardiovascular risk factors and cognitive decline in adults aged 50 and over: A population-based cohort study. Age and Ageing, 42(3), 338-345. [DOI:10.1093/ageing/afs166] [PMID]
Duran, T., Bateman, J. R., Williams, B. J., Espeland, M. A., Hughes, T. M., & Okonmah-Obazee, S., et al. (2022). Neuroimaging and clinical characteristics of cognitive migration in community-dwelling older adults. NeuroImage: Clinical, 36, 103232. [DOI:10.1016/j.nicl.2022.103232] [PMID]
Dye, L., Boyle, N. B., Champ, C., & Lawton, C. (2017). The relationship between obesity and cognitive health and decline. The Proceedings of the Nutrition Society, 76(4), 443–454.[DOI:10.1017/S0029665117002014] [PMID]
Enache, D., Winblad, B., & Aarsland, D. (2011). Depression in dementia: Epidemiology, mechanisms, and treatment. Current Opinion in Psychiatry, 24(6), 461-472. [DOI:10.1097/YCO.0b013e32834bb9d4] [PMID]
Fu, H., & Archer, K. J. (2024). hdcuremodels: Penalized Mixture Cure Models for High-Dimensional Data (Version 0.0.1) [Computer software]. Retrieved from: [Link]
Fischl B. (2012). FreeSurfer. NeuroImage, 62(2), 774–781. [DOI:10.1016/j.neuroimage.2012.01.021] [PMID]
Fu, H., Nicolet, D., Mrózek, K., Stone, R. M., Eisfeld, A., & Byrd, J. C., et al. (2022). Controlled variable selection in Weibull mixture cure models for high‐dimensional data. Statistics in Medicine, 41(22), 4340-4366. [DOI:10.1002/sim.9513] [PMID]
Fu, H., Nicolet, D., Mrózek, K., Stone, R. M., Eisfeld, A. K., & Byrd, J. C., et al. (2022). Controlled variable selection in Weibull mixture cure models for high-dimensional data. Statistics in Medicine, 41(22), 4340-4366. [DOI:10.1002/sim.9513] [PMID]
Hampel, H., & Lista, S. (2016). The rising global tide of cognitive impairment. Nature Reviews. Neurology, 12(3), 131-132. [DOI:10.1038/nrneurol.2015.250] [PMID]
Jack, C. R., Bennett, D. A., Blennow, K., Carrillo, M. C., Dunn, B., & Haeberlein, S. B., et al. (2018). NIA‐AA research framework: Toward a biological definition of Alzheimer’s disease. Alzheimer’s & Dementia, 14(4), 535-562. [DOI:10.1016/j.jalz.2018.02.018] [PMID]
Kim, S., Kim, Y., & Park, S. M. (2016). Body Mass Index and decline of cognitive function. Plos One, 11(2), e0148908. [DOI:10.1371/journal.pone.0148908] [PMID]
LaMontagne, P. J., Benzinger, T. L., Morris, J. C., Keefe, S., Hornbeck, R., & Xiong, C., et al. (2019). OASIS-3: Longitudinal neuroimaging, clinical, and cognitive dataset for normal aging and Alzheimer disease. MedRxiv. [Preprint]. [DOI:10.1101/2019.12.13.19014902]
Liu, C. C., Liu, C. C., Kanekiyo, T., Xu, H., & Bu, G. (2013). Apolipoprotein E and Alzheimer disease: Risk, mechanisms and therapy. Nature Reviews. Neurology, 9(2), 106–118. [DOI:10.1038/nrneurol.2012.263] [PMID]
Maller, R. A., Zhou, X., & NetLibrary, I. (1996). Survival analysis with long-term survivors. Hoboken: Wiley. [Link]
Mallo, S. C., Patten, S. B., Ismail, Z., Pereiro, A. X., Facal, D., & Otero, C., et al. (2020). Does the neuropsychiatric inventory predict progression from mild cognitive impairment to dementia? A systematic review and meta-analysis. Ageing Research Reviews, 58, 101004. [DOI:10.1016/j.arr.2019.101004] [PMID]
Morris J. C. (1993). The clinical dementia rating (CDR): Current version and scoring rules. Neurology, 43(11), 2412–2414. [DOI: 10.1212/wnl.43.11.2412-a] [PMID]
Needham, D. M., Davidson, J., Cohen, H., Hopkins, R. O., Weinert, C., & Wunsch, H., et al. (2012). Improving long-term outcomes after discharge from intensive care unit: Report from a stakeholders’ conference. Critical Care Medicine, 40(2), 502–509. [DOI:10.1097/CCM.0b013e318232da75] [PMID]
Rabin, J. S., Neal, T. E., Nierle, H. E., Sikkes, S. A. M., Buckley, R. F., & Amariglio, R. E., et al. (2020). Multiple markers contribute to risk of progression from normal to mild cognitive impairment. NeuroImage. Clinical, 28, 102400. [DOI:10.1016/j.nicl.2020.102400] [PMID]
Riedel, B. C., Thompson, P. M., & Brinton, R. D. (2016). Age, APOE and sex: Triad of risk of Alzheimer’s disease. The Journal of Steroid Biochemistry and Molecular Biology, 160, 134-147. [DOI:10.1016/j.jsbmb.2016.03.012] [PMID]
Rolls, E. T. (2019). The Orbitofrontal Cortex. Oxford: Oxford University Press. [DOI:10.1093/oso/9780198845997.001.0001]
Sattari, N., Faeghi, F., Shekarchi, B., & Heidari, M. H. (2022). Assessing the changes of cortical thickness in Alzheimer Disease With MRI Using Freesurfer Software. Basic and Clinical Neuroscience, 13(2), 185-192. [DOI:10.32598/bcn.2021.1779.1] [PMID]
Sperling, R. A., Mormino, E. C., Schultz, A. P., Betensky, R. A., Papp, K. V., & Amariglio, R. E., et al. (2019). The impact of amyloid-beta and tau on prospective cognitive decline in older individuals. Annals of Neurology, 85(2), 181-193. [DOI:10.1002/ana.25395] [PMID]
Stern, Y. (2002). What is cognitive reserve? Theory and research application of the reserve concept. Journal of the International Neuropsychological Society, 8(3), 448-460. [DOI:10.1017/S1355617702813248] [PMID]
Stuss, D. T., & Levine, B. (2002). Adult clinical neuropsychology: Lessons from studies of the frontal lobes. Annual Review of Psychology, 53, 401-433. [DOI:10.1146/annurev.psych.53.100901.135220] [PMID]
Teng, E., Becker, B. W., Woo, E., Knopman, D. S., Cummings, J. L., & Lu, P. H. (2010). Utility of the functional activities questionnaire for distinguishing mild cognitive impairment from very mild Alzheimer disease. Alzheimer Disease & Associated Disorders, 24(4), 348-353. [DOI:10.1097/WAD.0b013e3181e2fc84] [PMID]
Wilks, H., Benzinger, T. L. S., Schindler, S. E., Cruchaga, C., Morris, J. C., & Hassenstab, J. (2024). Predictors and outcomes of fluctuations in the clinical dementia rating scale. Alzheimer’s & Dementia: The Journal of the Alzheimer’s Association, 20(3), 2080-2088. [DOI:10.1002/alz.13679] [PMID]
Williams, M. E., Elman, J. A., Bell, T. R., Dale, A. M., Eyler, L. T., & Fennema-Notestine, C., et al. (2023). Higher cortical thickness/volume in Alzheimer’s-related regions: Protective factor or risk factor? Neurobiology of Aging, 129, 185-194. [DOI:10.1016/j.neurobiolaging.2023.05.004] [PMID]
Zatorre, R. J., Fields, R. D., & Johansen-Berg, H. (2012). Plasticity in gray and white: Neuroimaging changes in brain structure during learning. Nature Neuroscience, 15(4), 528-536. [DOI:10.1038/nn.3045] [PMID]
Zhao, X., & Zhou, X. (2008). Discrete-time survival models with long-term survivors. Statistics in Medicine, 27(8), 1261–1281. [PMID]
Type of Study: Original |
Subject:
Cognitive Neuroscience
Received: 2025/01/20 | Accepted: 2025/04/27 | Published: 2025/07/1
Received: 2025/01/20 | Accepted: 2025/04/27 | Published: 2025/07/1
Send email to the article author
| Rights and permissions | |
 |
This work is licensed under a Creative Commons Attribution-NonCommercial 4.0 International License. |

Copyright © The Author(s);
This is an open access article distributed under the terms of the Creative Commons Attribution License (CC-By-NC), which permits use, distribution, and reproduction in any medium, provided the original work is properly cited and is not used for commercial purposes.
Contact Information