

Volume 16, Issue 5 (September & October 2025)
BCN 2025, 16(5): 929-940 |
Back to browse issues page


Download citation:
BibTeX | RIS | EndNote | Medlars | ProCite | Reference Manager | RefWorks
Send citation to:


BibTeX | RIS | EndNote | Medlars | ProCite | Reference Manager | RefWorks
Send citation to:
Mansouri V, Arjmand B, Asri N, Razzaghi Z, Rezaei-Tavirani M, Razi F, et al . Human Gene Expression Profile Analysis of Insomnia and Pre-insomnia Disorders: A Cellular Study. BCN 2025; 16 (5) :929-940
URL: http://bcn.iums.ac.ir/article-1-3099-en.html
URL: http://bcn.iums.ac.ir/article-1-3099-en.html
Vahid Mansouri1 

 , Babak Arjmand2 , Nastaran Asri3 , Zahra Razzaghi4 , Mostafa Rezaei-Tavirani *1 , Farideh Razi5 , Fatemeh Bandarian6 , Reza M Robati7 , Mitra Rezaei8
, Babak Arjmand2 , Nastaran Asri3 , Zahra Razzaghi4 , Mostafa Rezaei-Tavirani *1 , Farideh Razi5 , Fatemeh Bandarian6 , Reza M Robati7 , Mitra Rezaei8
1- Proteomics Research Center, School of Paramedical Sciences, Shahid Beheshti University of Medical Sciences, Tehran, Iran.
2- Cell Therapy and Regenerative Medicine Research Center, Endocrinology and Metabolism Molecular-Cellular Sciences Institute, Tehran University of Medical Sciences, Tehran, Iran. & Iranian Cancer Control Center (MACSA), Tehran, Iran.
3- Celiac Disease and Gluten-Related Disorders Research Center, School of Medicine, Research Institute for Gastroenterology and Liver Disease, Shahid Beheshti University of Medical Sciences, Tehran, Iran.
4- Laser Application in Medical Sciences Research Center, Shahid Beheshti University of Medical Sciences, Tehran, Iran.
5- Diabetes Research Center, Endocrinology and Metabolism Clinical Sciences Institute, Tehran University of Medical Sciences, Tehran, Iran.
6- Endocrinology and Metabolism Research Center, Endocrinology and Metabolism Clinical Sciences Institute, Tehran University of Medical Sciences, Tehran, Iran.
7- Skin Research Center, Shahid Beheshti University of Medical Sciences, Tehran, Iran.
8- Genomic Research Center, Shahid Beheshti University of Medical Sciences, Tehran, Iran. & Clinical Tuberculosis and Epidemiology Research Center, National Research Institute of Tuberculosis and Lung Diseases (NRITLD), Shahid Beheshti University of Medical Sciences, Tehran, Iran.
Full-Text [PDF 4870 kb]
| Abstract (HTML)
Full-Text:
Introduction
leep is a fundamental process for restoring brain function and is recognized as a basic dimension of physical and mental health (Baglioni et al., 2016). On the other hand, sleep disturbances, such as insomnia, are associated with an increased risk of dementia (Shi et al., 2018), a higher likelihood of dying from cardiovascular diseases (Sofi et al., 2014), and an elevated risk of mental disorders (Hertenstein et al., 2019). The association between insomnia and depression has been acknowledged, with key indicators including high levels of negative emotion and low levels of positive emotion dysregulation (Tomaso et al., 2021). Franzen et al. revealed that 90% of individuals with major depression report disturbances in normal sleep (Franzen & Buysse, 2008). However, recent meta-analytic data concluded no consistent evidence for an intervention effect between sleep disturbances and improvement in depressive symptoms (Mitter et al., 2022). Circadian systems and sleep are key modulators of immune system function, and experimental sleep deprivation leads to increased expression of interleukin (IL)-6 and tumor necrosis factor (TNF) from nighttime to daytime (Vgontzas et al., 2002). Sleep loss may activate nuclear factor-kappa B, a key regulatory pathway in the inflammatory response, increasing levels of IL-6 and TNF (Irwin et al., 2008). Interventional studies have revealed an association between insomnia and inflammation (Carroll et al., 2015). Evidence suggests that inflammation caused by insomnia may be related to hypothalamic-pituitary-adrenal axis activation and glucocorticoid resistance (Irwin, 2019). Genome-wide association studies of insomnia have identified MEIS1 as having a strong association signal, suggesting that MEIS1 may play a role in insomnia and restless leg syndrome (Hammerschlag et al., 2017). However, the inflammation associated with insomnia and depression has not been thoroughly analyzed and remains largely hypothetical (Palagini et al., 2022).
Today, with the assistance of bioinformatics knowledge and powerful data analysis software, gene network analysis and the interpretation of gene interactions are possible (Hammerschlag et al., 2017). Since bioinformatics tools are suitable for detecting the molecular mechanisms of diseases (Arjmand et al., 2024), this study aims to investigate the molecular mechanisms of insomnia and identify the key genes that are dysregulated in relation to it. The findings may be important for managing individuals with insomnia or related disorders.
Materials and Methods
Data collection
To study the molecular mechanisms of insomnia, data were collected from the Gene Expression Omnibus (GEO) database (GSE208668). Total RNA was obtained from the peripheral blood mononuclear cells of 17 individuals with insomnia disorder and compared to 25 controls for analysis. The data are linked to the published document by Piber et al., titled “sleep disturbance and activation of cellular and transcriptional mechanisms of inflammation in older adults” (Piber et al., 2022). There is evidence that patient cells are a suitable source for studying the molecular mechanisms of the studied disorder or disease (Liu et al., 2023; Zaman et al., 2021).
Pre-evaluation of data
Data were evaluated using the GEO2R program (National Center for Biotechnology Information, NCBI) to identify potential comparisons between samples through box plots, uniform manifold approximation and projection (UMAP) plots, expression density diagrams, and Venn diagrams (Piber et al., 2022). The gene expression profiles that did not match statistically were normalized using the “force normalization” option of the GEO2R program. UMAP plot analysis indicated that normalization had no unfavorable consequence. Significantly differentially expressed genes (DEGs) were selected based on adjusted P<0.05 and a fold change >2. The data were cleaned, and individuals without a characterization were excluded from further analysis.
Protein-protein interaction (PPI) network analysis
The selected significant DEGs were included in a directed PPI network using the CluePedia plugin of Cytoscape software, considering co-expression interactions. The main connected components of the network that were eligible for network topology analysis were assessed using the “Network Analyzer” application of Cytoscape software in “direct” mode. The main connected components were laid out based on outdegree and indegree centrality parameters to identify the critical actor and controlled genes, respectively. The central nodes and their centrality parameters were visualized to highlight the crucial genes.
Statistical analysis
The significant DEGs were selected based on (adjusted P<0.05 and fold change >2. Data analysis was conducted using the GEO2R program (NCBI, version 1.0) to evaluate gene expression profiles from the GEO database (GSE208668). Directed PPI network analysis was performed using the CluePedia plugin (version 1.5.7) of Cytoscape software (version 3.9.1) to evaluate significant DEGs, incorporating co-expression interactions. Central nodes, identified as the most influential and regulated genes, were determined through network topology analysis using the "Network Analyzer" application within Cytoscape, with results visualized to highlight key genes.
Results
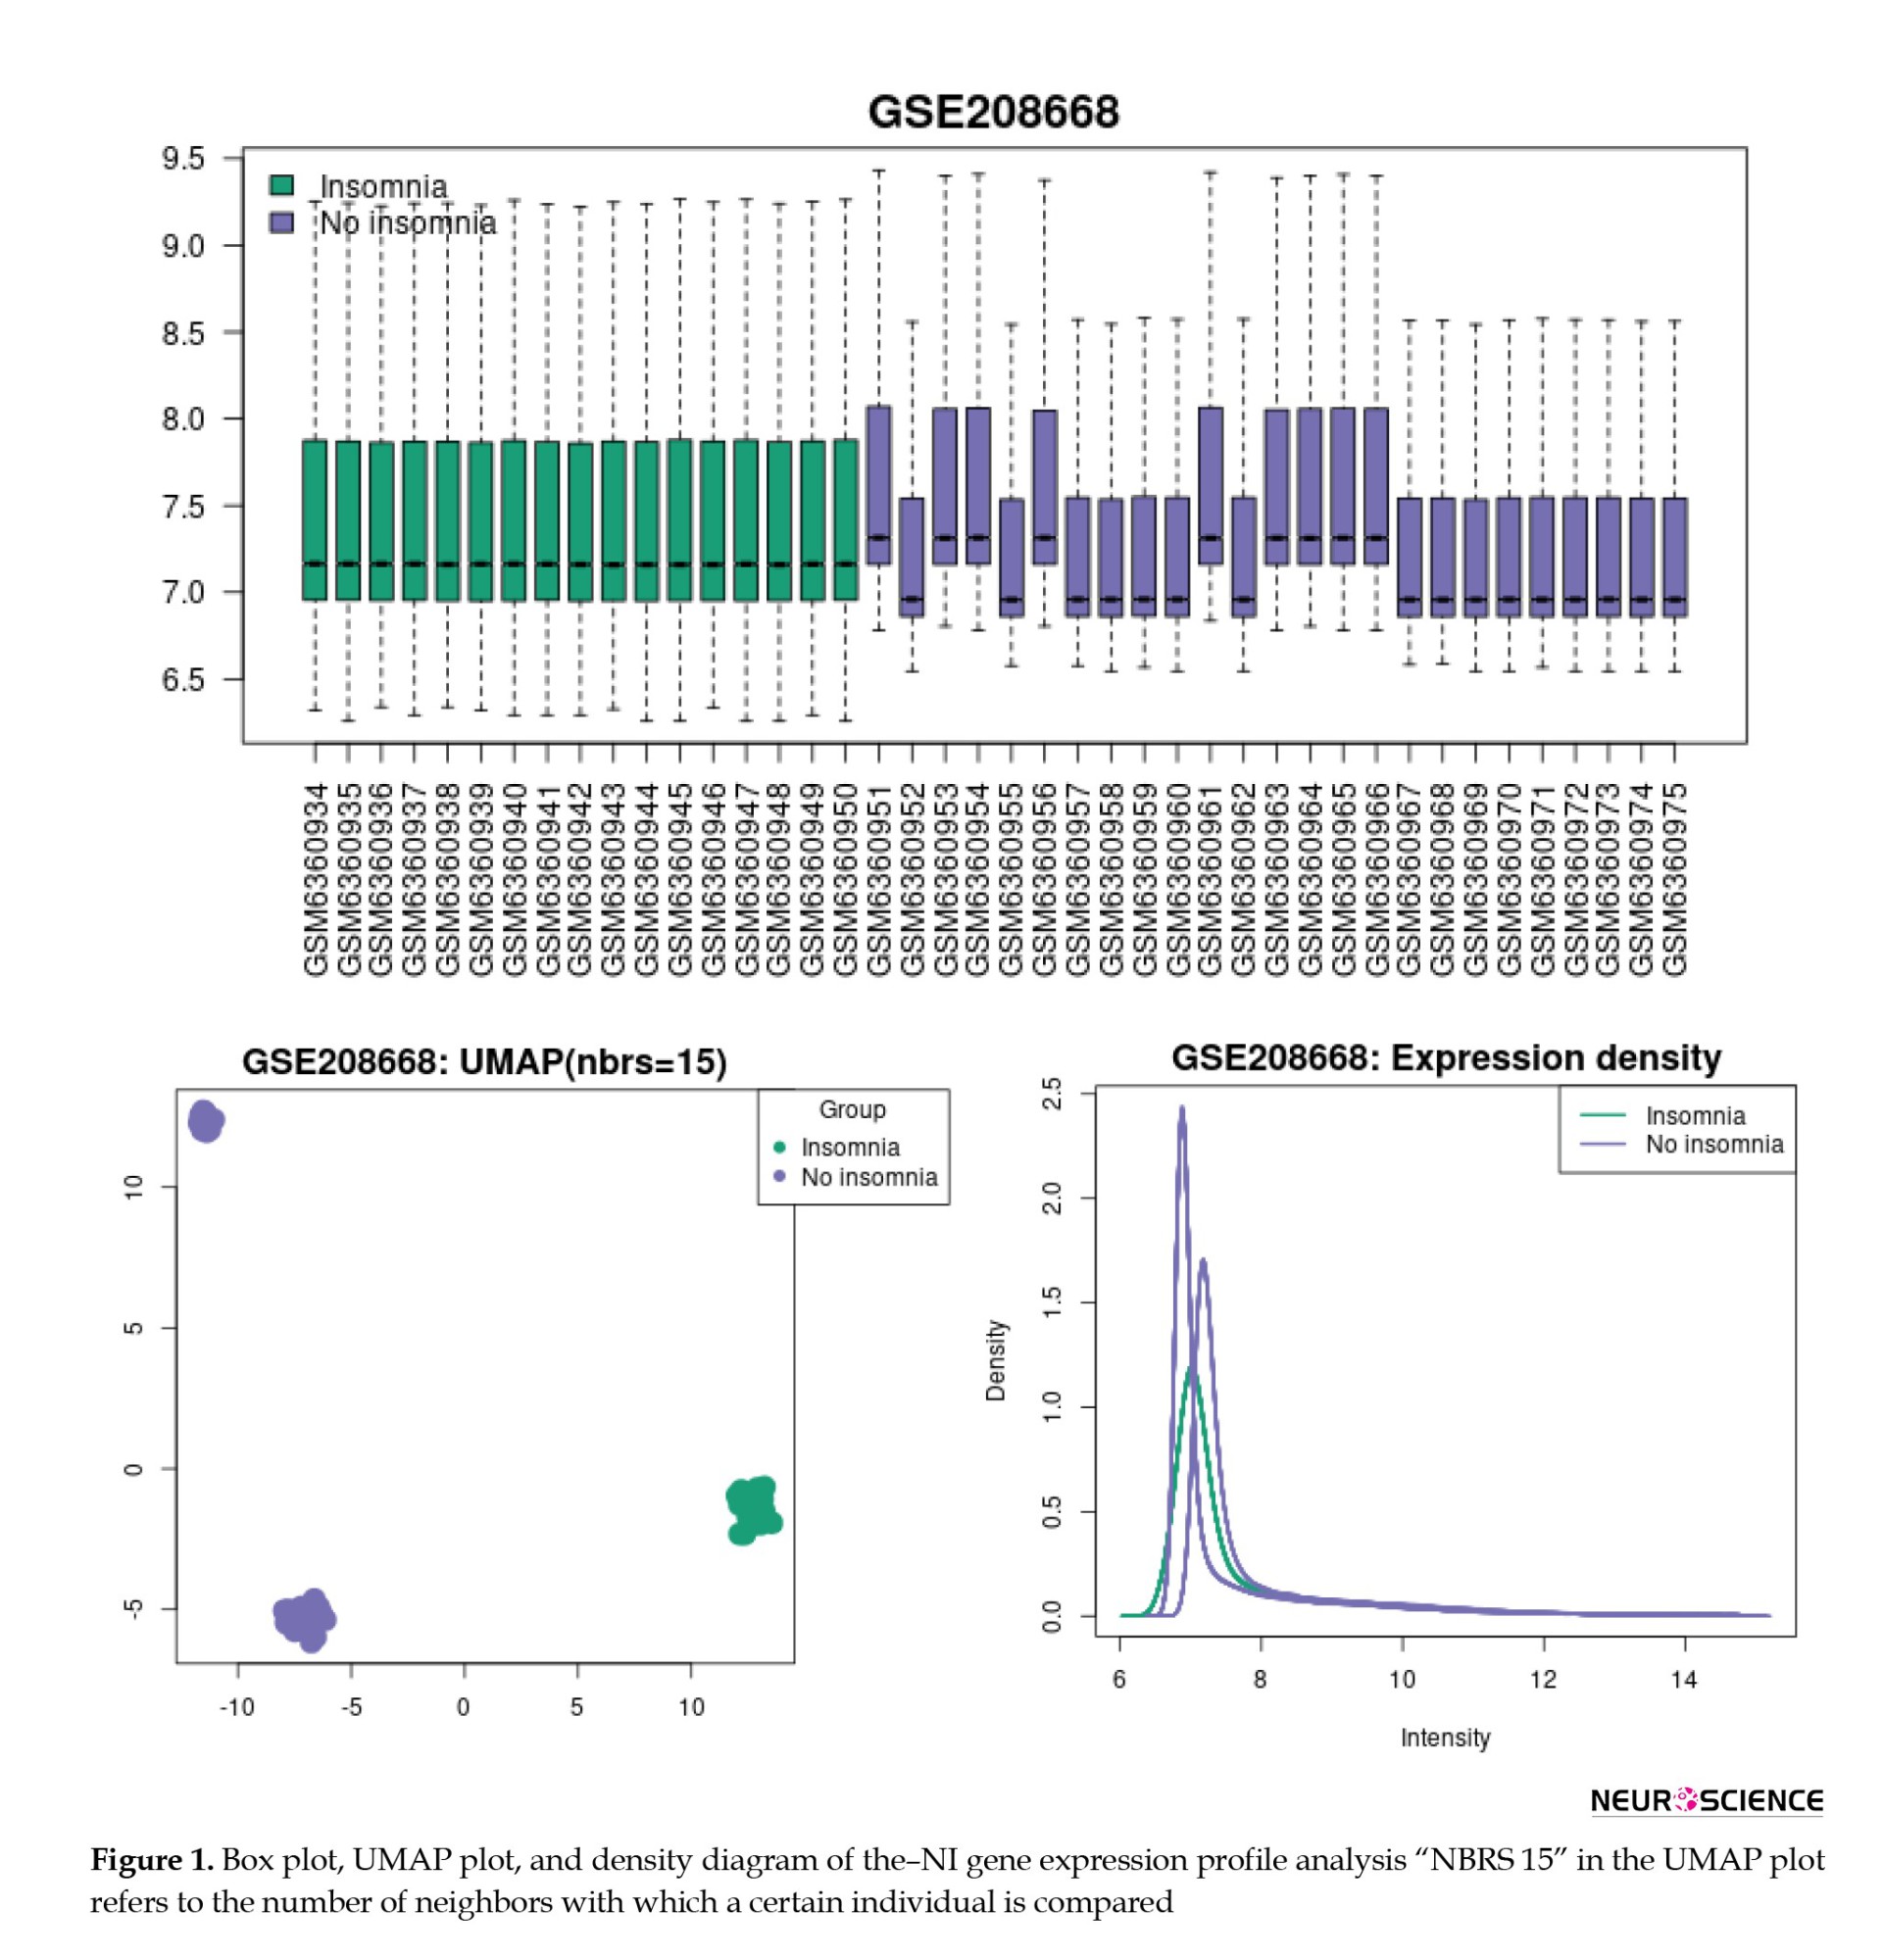
Figure 1 presents the visualization of insomnia, consisting of no insomnia (I-NI) samples, using box plots, UMAP plots, and expression density diagrams. As depicted in Figure 1, the NI samples are not uniform and do not match individuals with insomnia. The UMAP plot and density diagram correspond to the two sets of samples in the NI group. Based on the box plot in Figure 1, the gene expression profiles of the NI group were divided into two groups: No Insomnia 1 (NI1) and no insomnia 2 (NI2). NI1 includes GSM6360952, GSM6360955, GSM6360957-60, GSM6360962, and GSM6360967-75, while, GSM6360951, GSM6360953-4, GSM6360956, GSM63609561, and GSM6360963-6 are grouped as NI2.
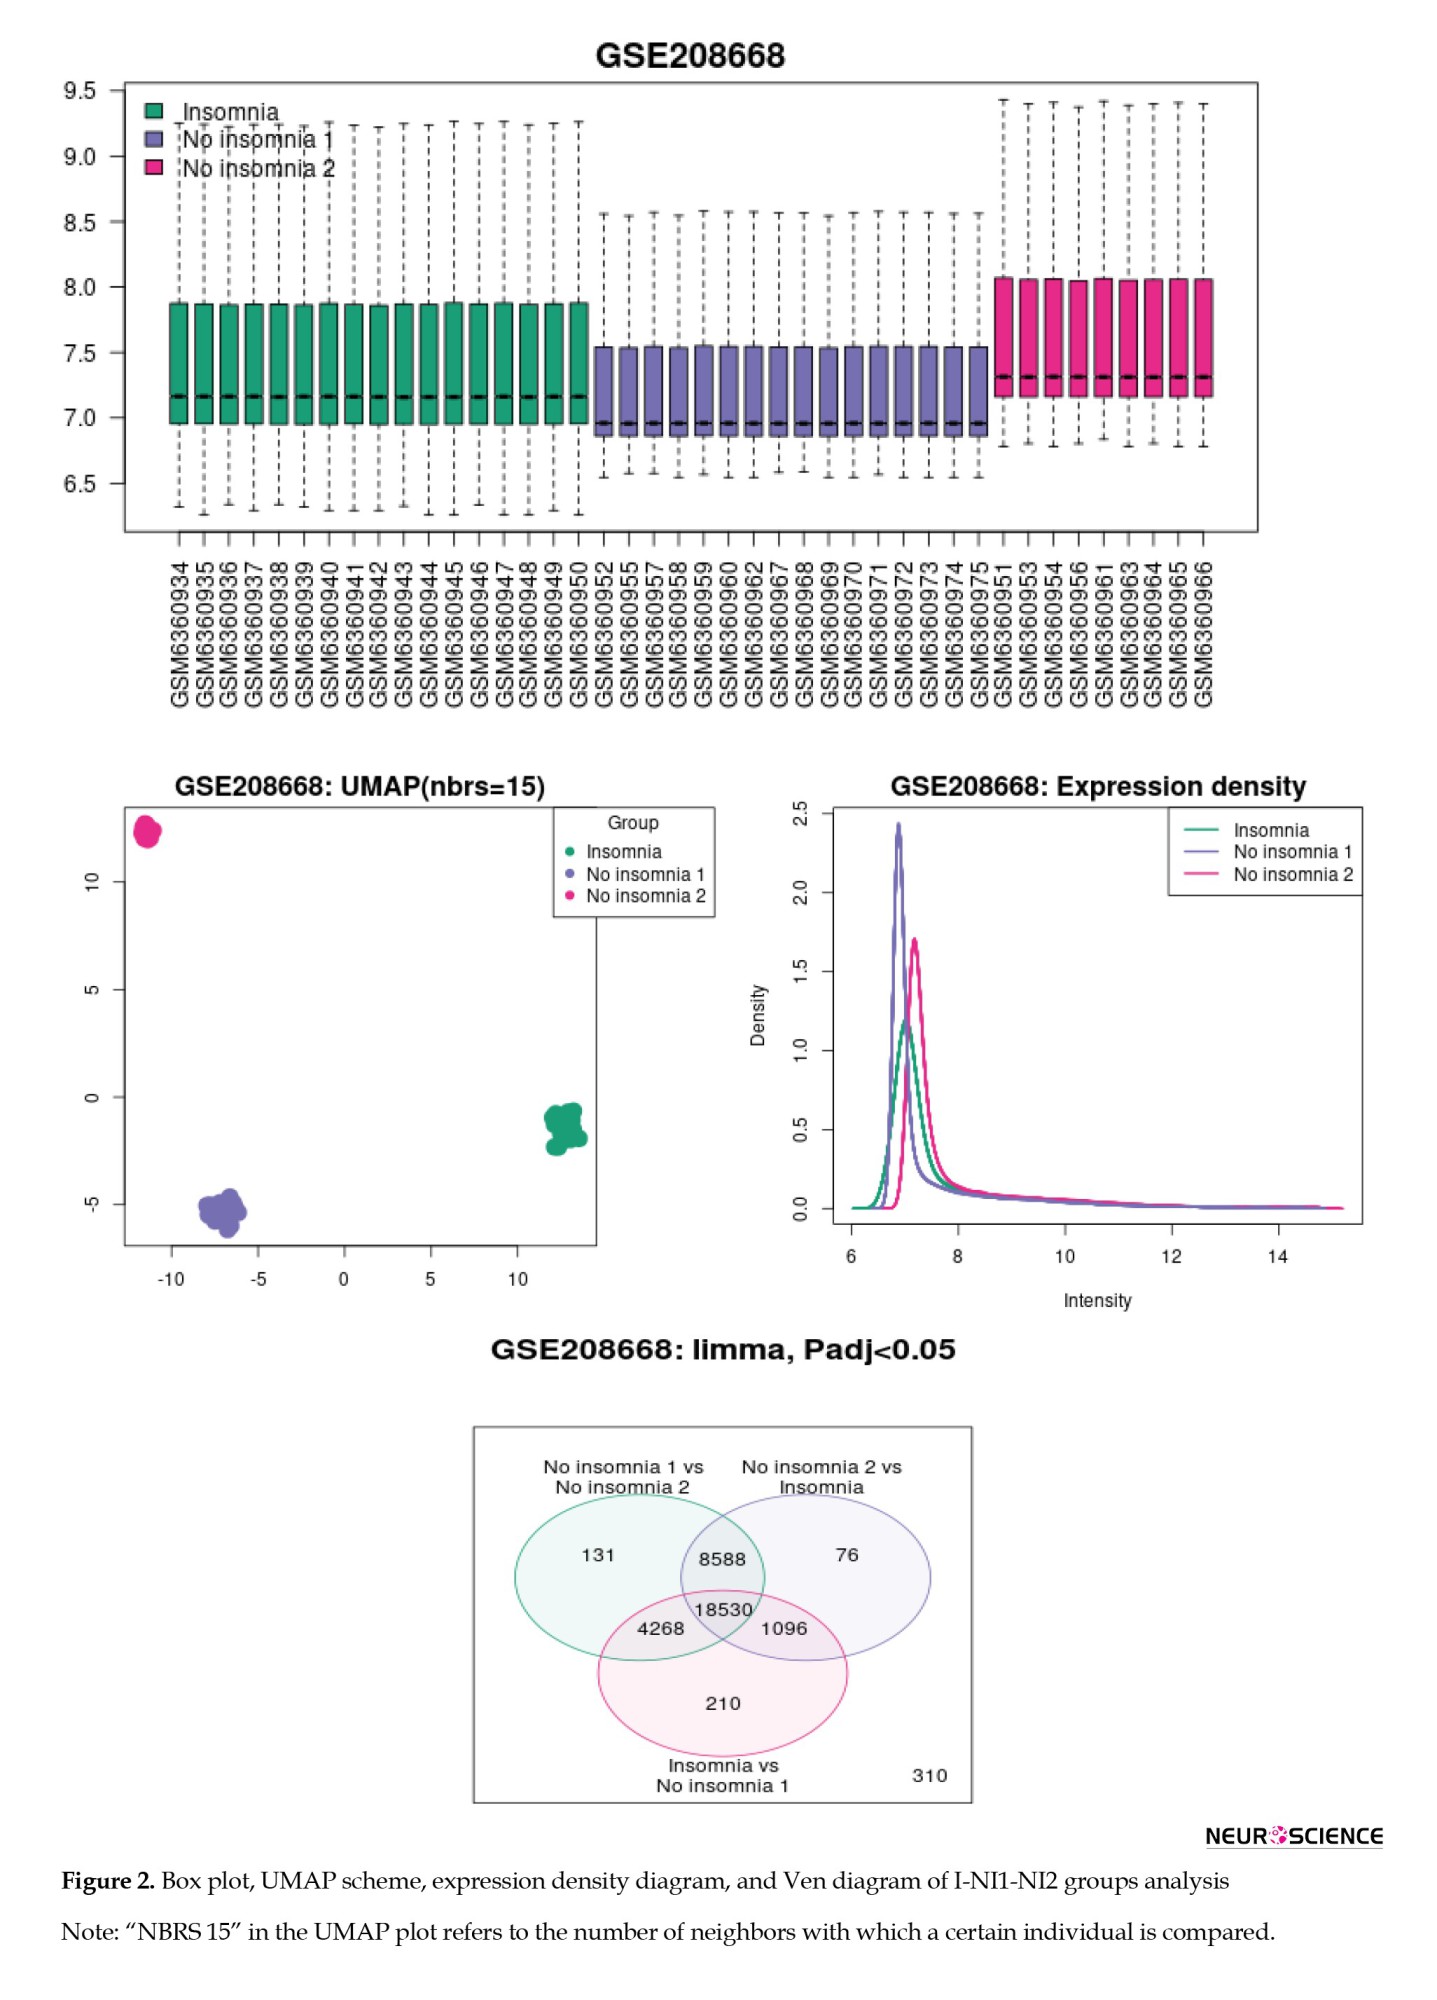
The box plot, UMAP scheme, expression density diagram, and Venn diagram of the I-NI1-NI2 analysis indicate that the two groups of NI gene expression profiles are completely separated from the insomnia group (Figure 2).
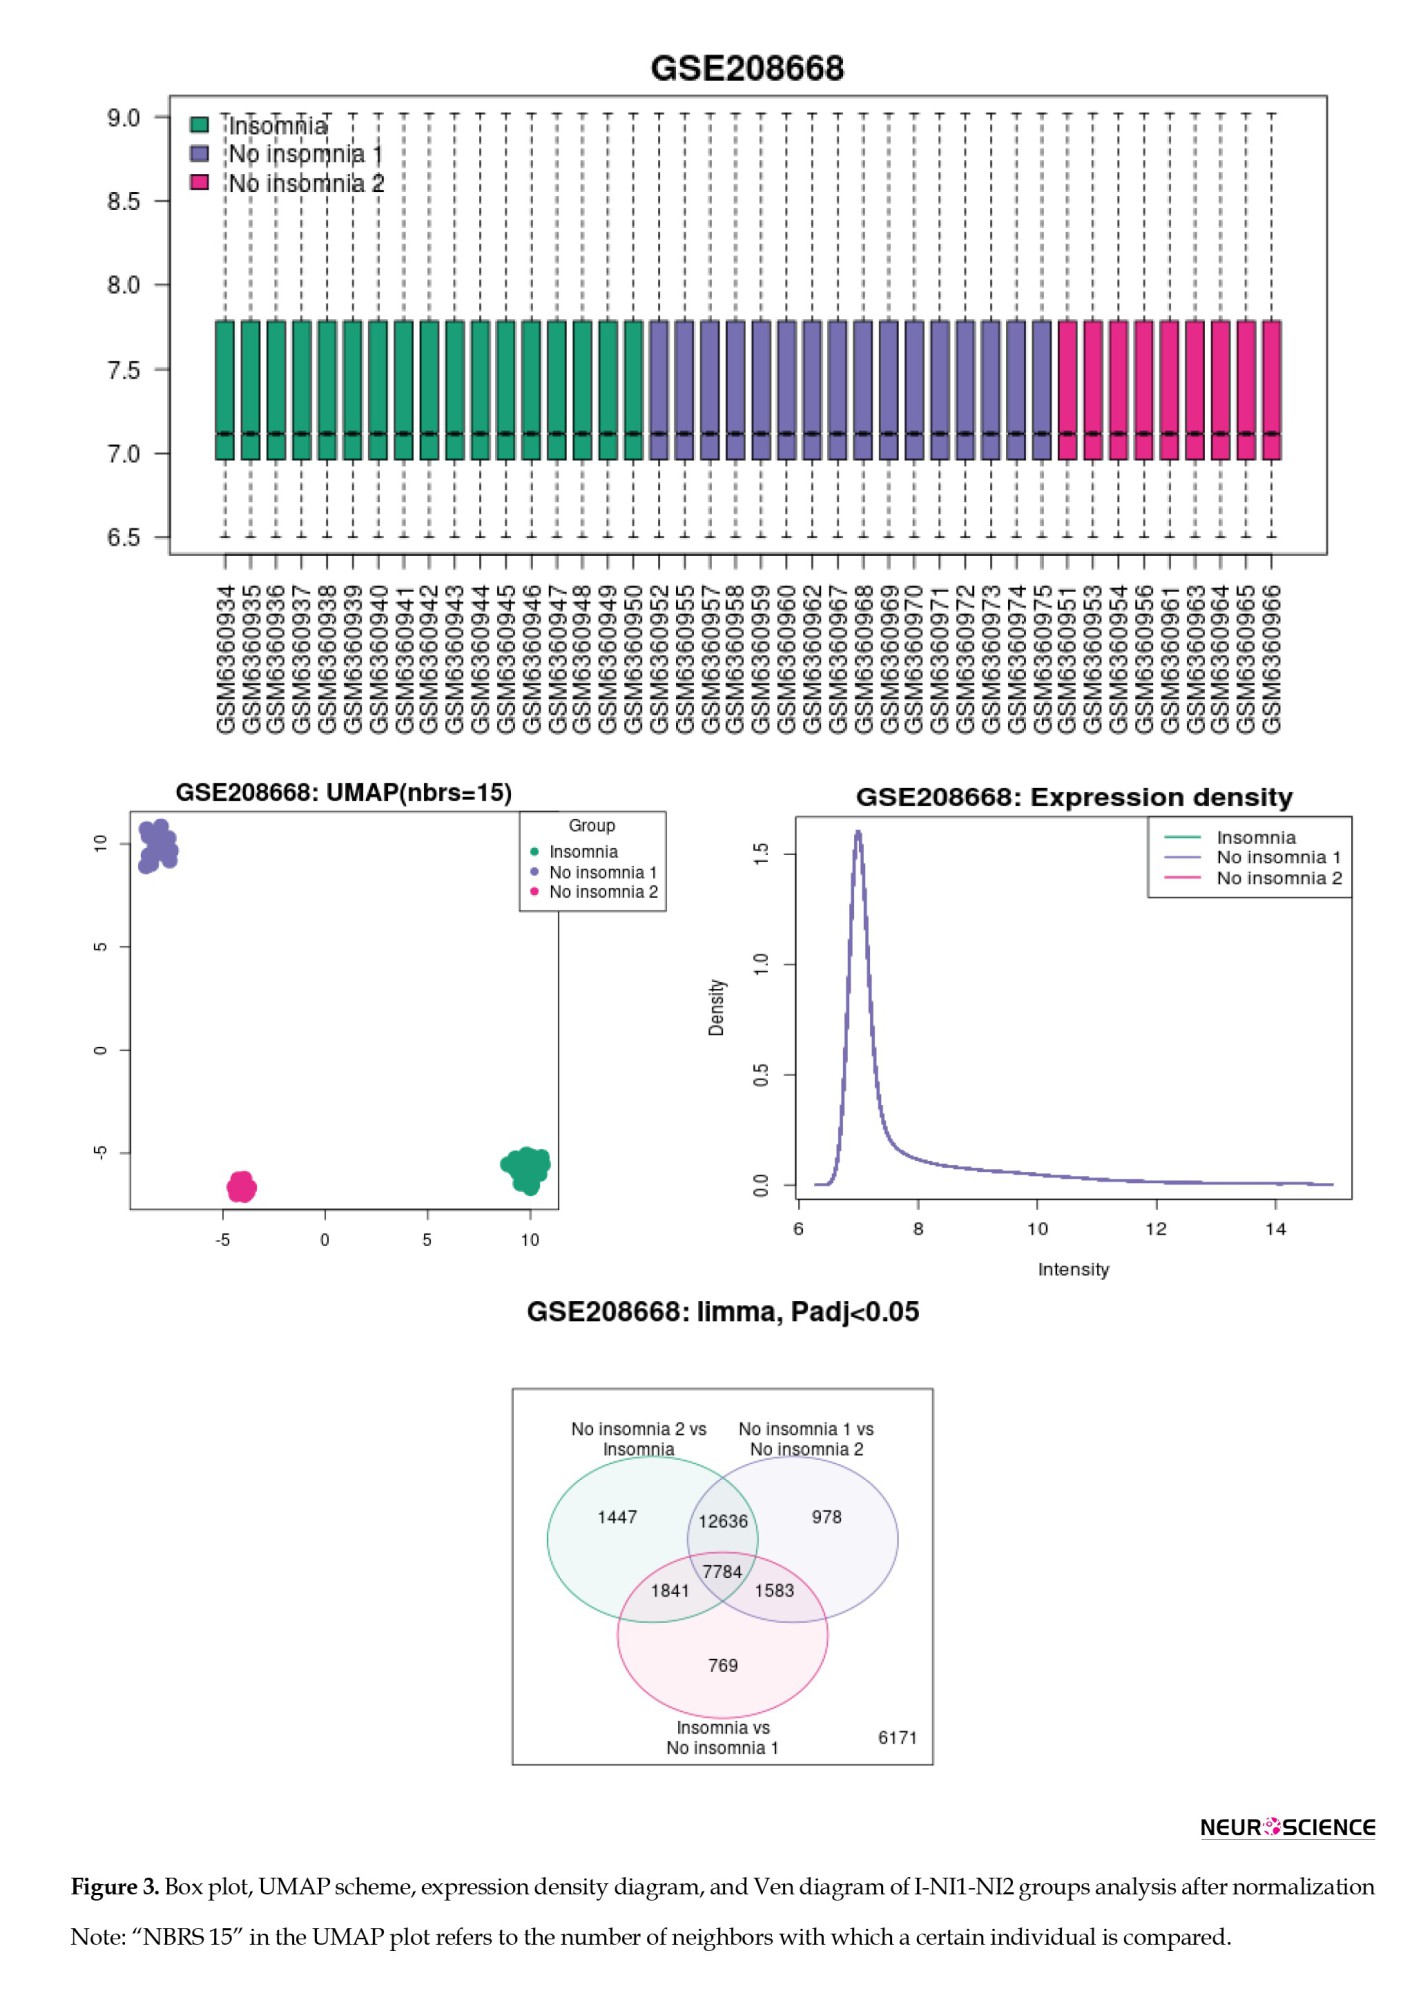
The samples were normalized and compared, and the results of the I-NI1-NI2 reanalysis are shown in Figure 3. As depicted in Figure 3, the three groups are distinguished by their gene expression profiles (see UMAP plot). Since the intensity diagrams of the samples have a similar pattern, the gene expression profiles of the studied groups are comparable. The UMAP plot demonstrated exactly two distinct groups of no-insomnia samples.
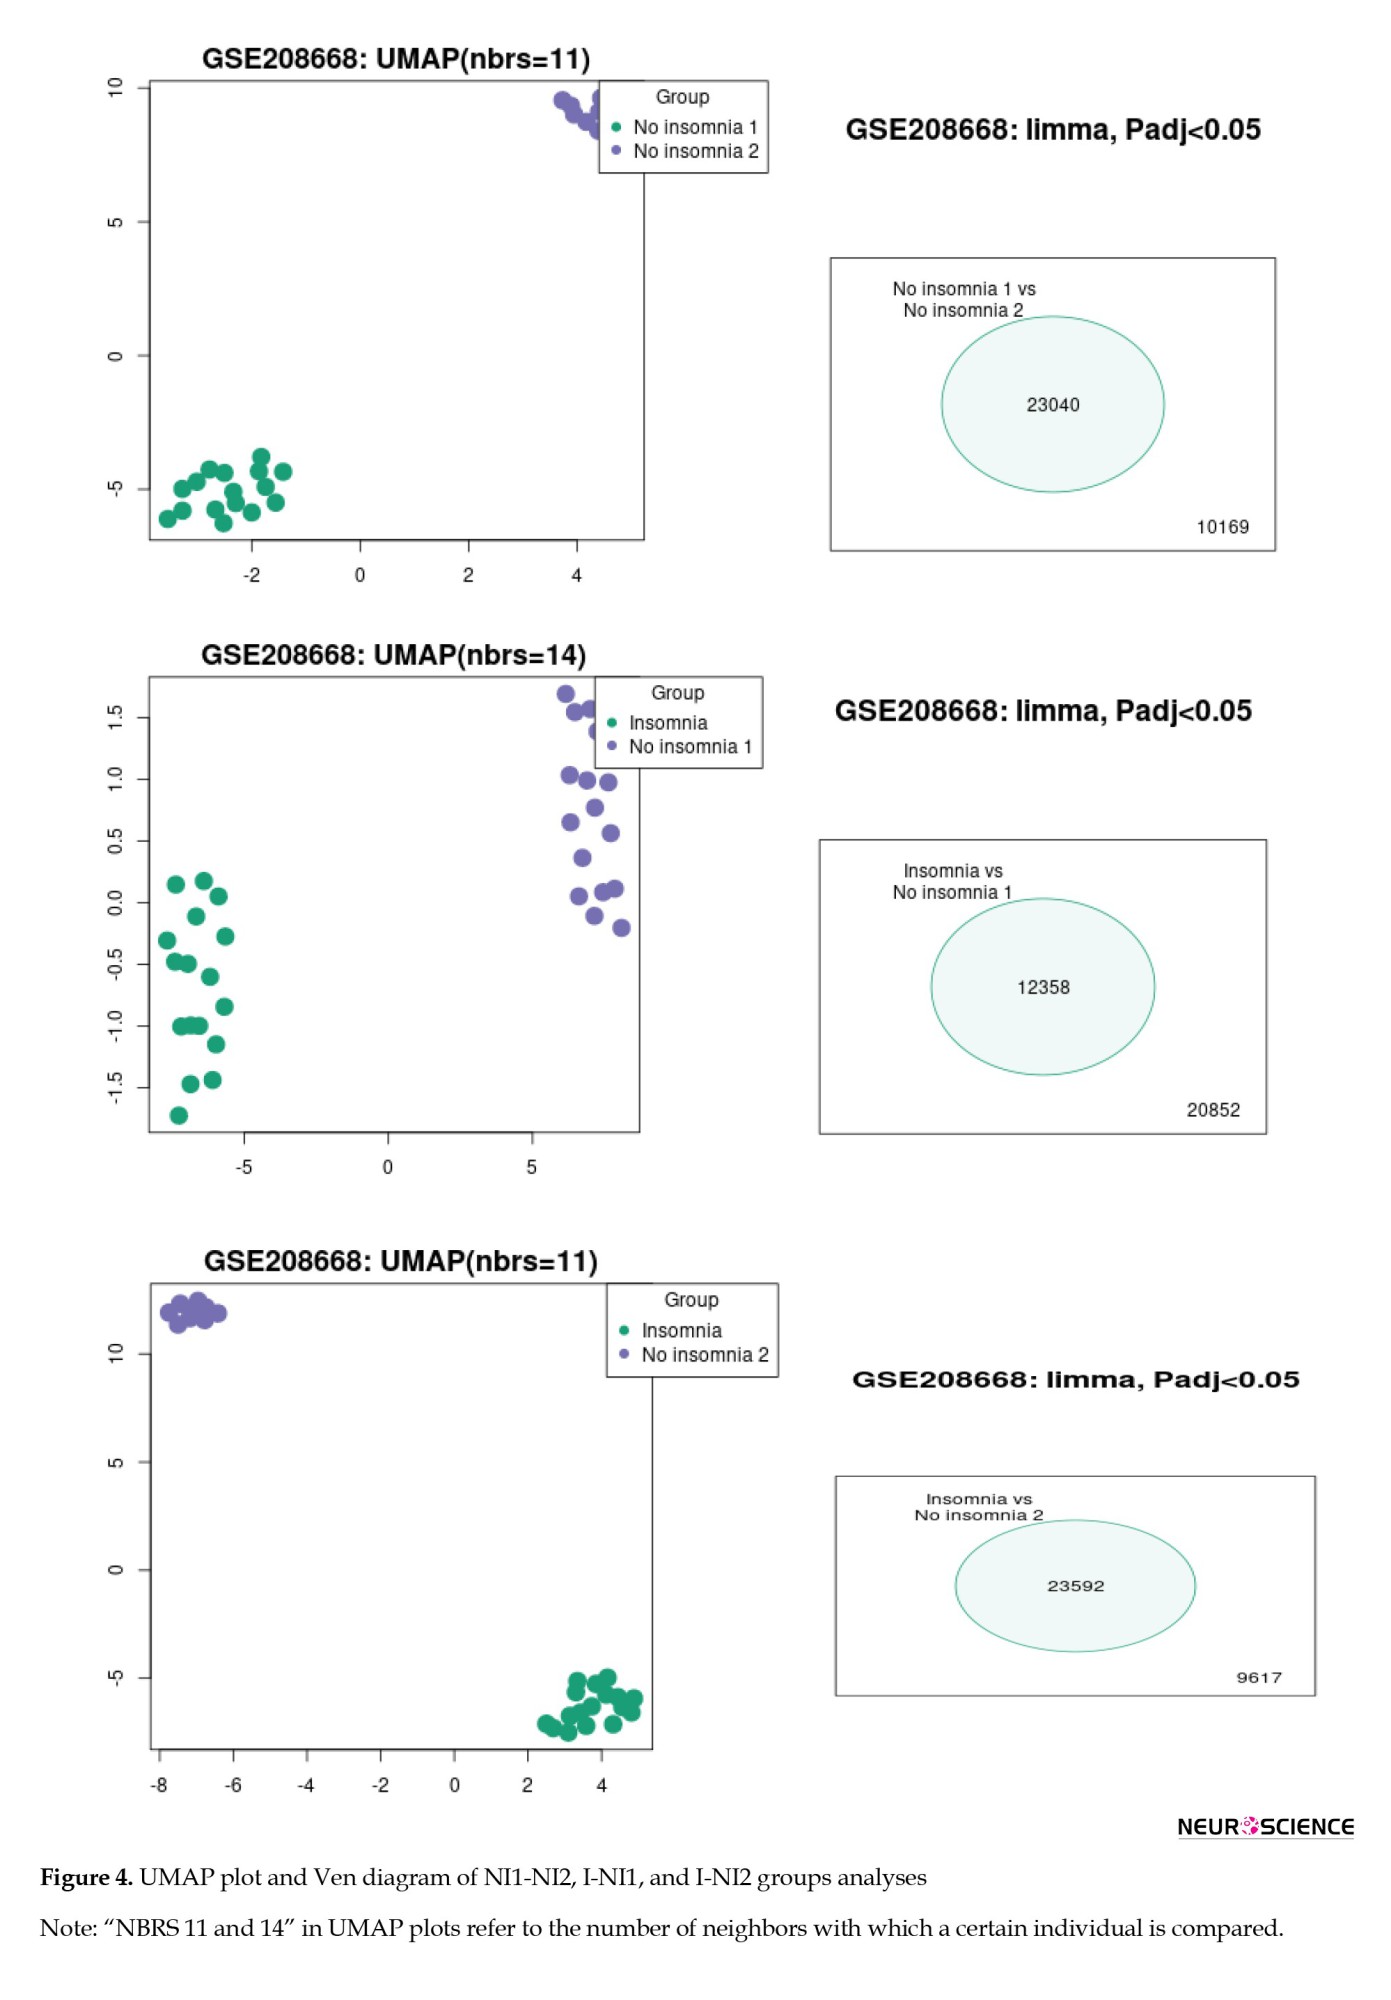
To identify the differentiation among the NI1, NI2, and insomnia groups, the gene expression profiles of each group were compared with those of the others. The results of this analysis are depicted in Figure 4. As shown in Figure 4, the three groups are completely separated from each other based on the significant DEGs. As depicted in Figures 2-4 (the Venn diagrams), many DEGs are dysregulated significantly.
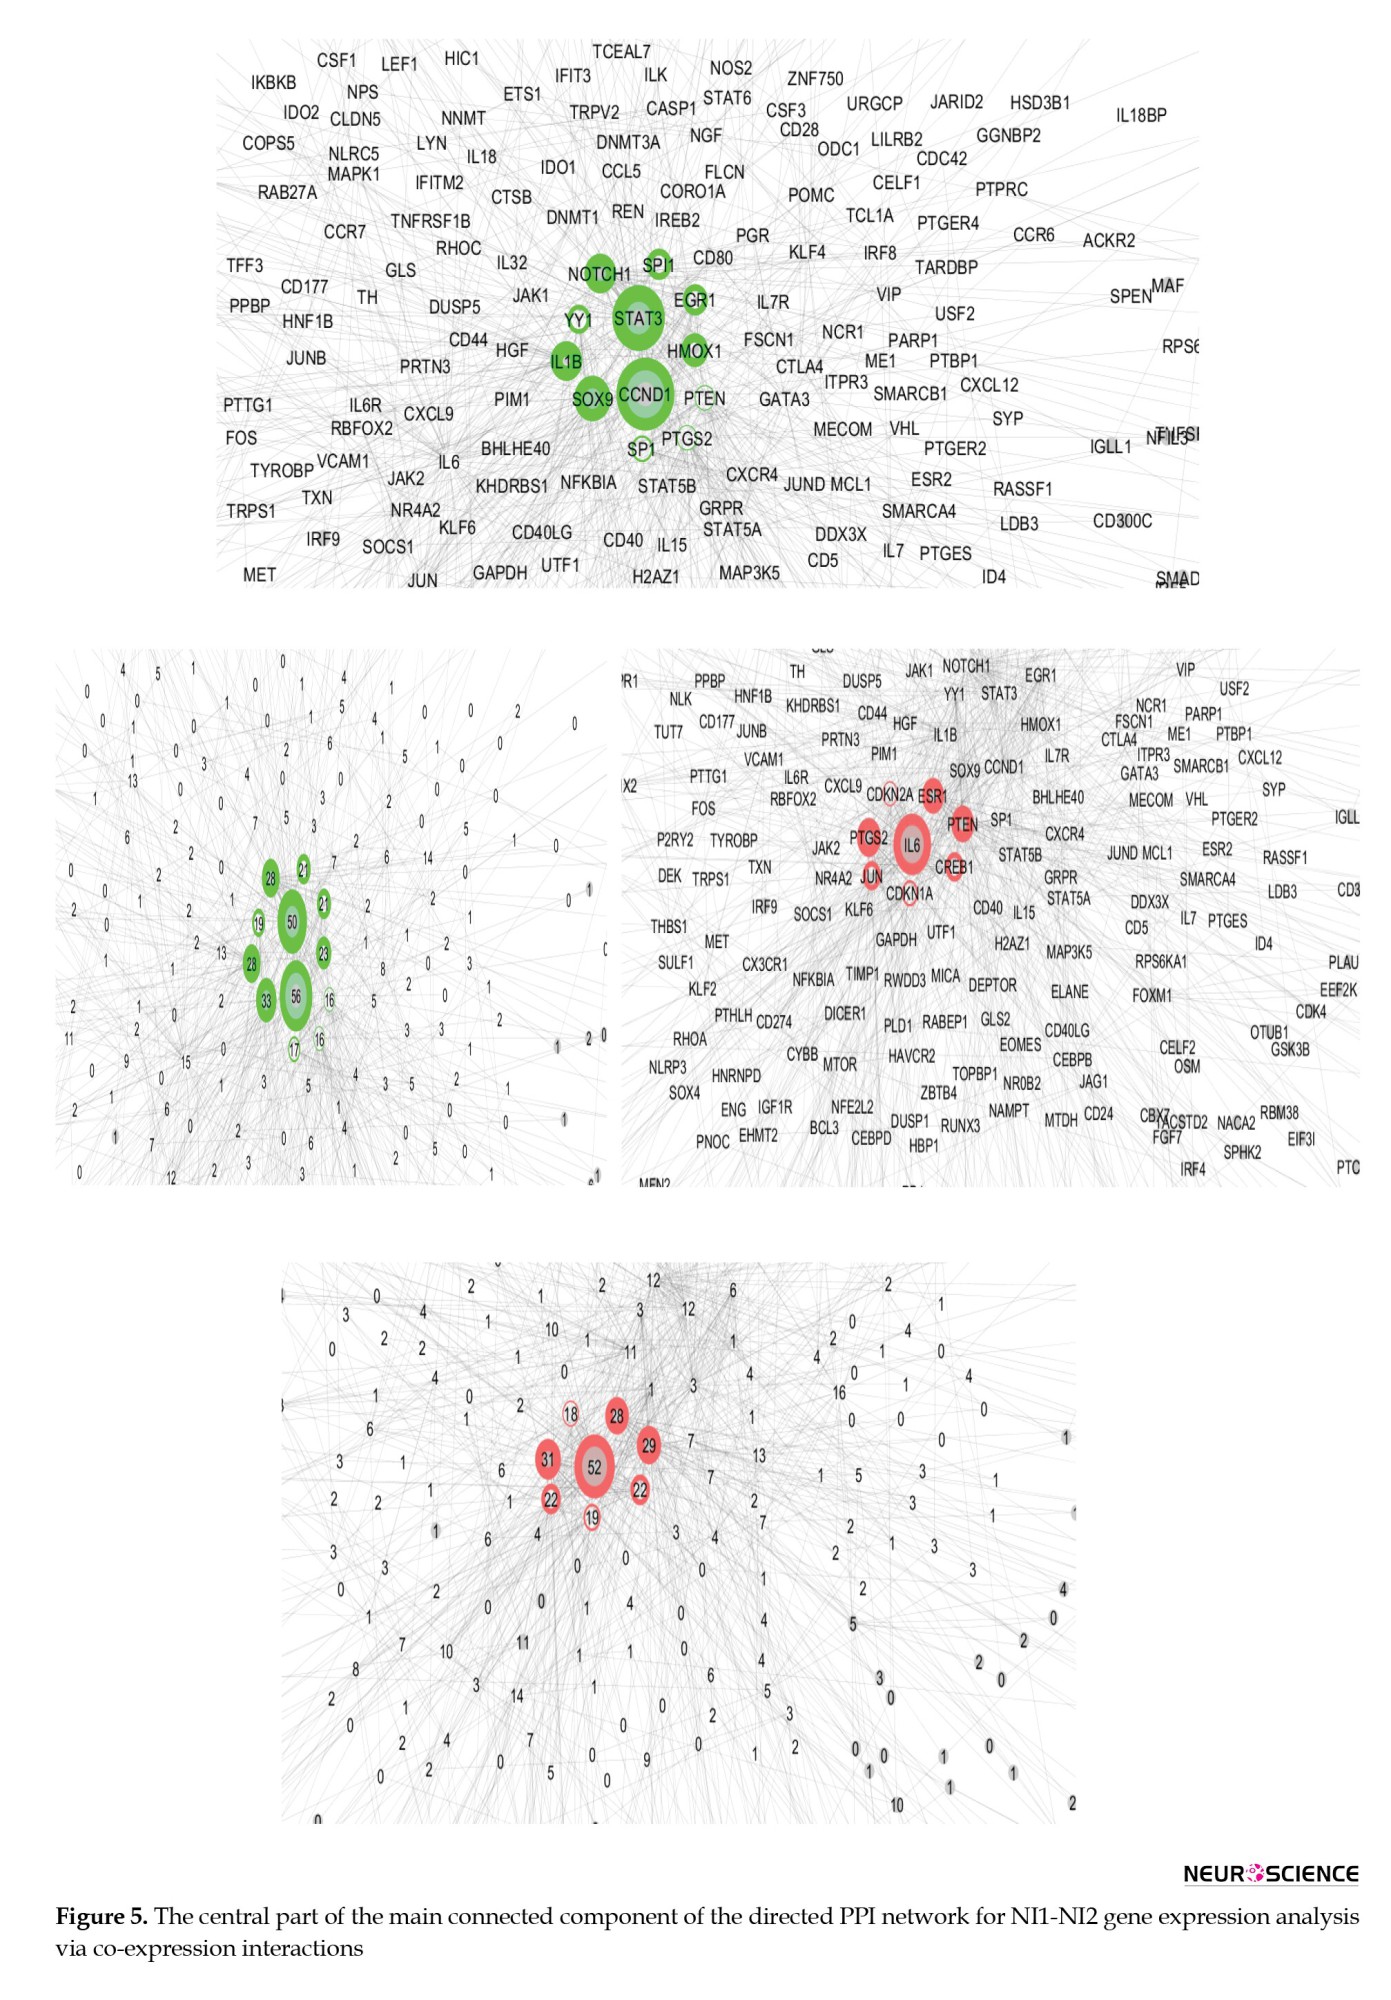
The central part of the main connected component of the NI1-NI2 PPI network is shown in Figure 5. According to Figure 5, the genes CCND1, STAT3, SOX9, NOTCH1, IL1B, HMOX1, EGR1, SPI1, YY1, SP1, PTGS2, and PTEN are identified as the main actors that differentiate the two groups from the NI group. These genes are arranged in descending order based on their outdegree values, with CCND1 and PTEN being the strongest and weakest actors, respectively. Next, IL6, PTGS2, PTEN, ESR1, JUN, CREB1, CDKN1A, and CDKN2A were highlighted as the critical controlled DEGs, with IL6 and CDKN2A identified as the most and least influential controlled DEGs, respectively. The genes are laid out based on outdegree and indegree values, using color to represent the related amounts of the central parameters.
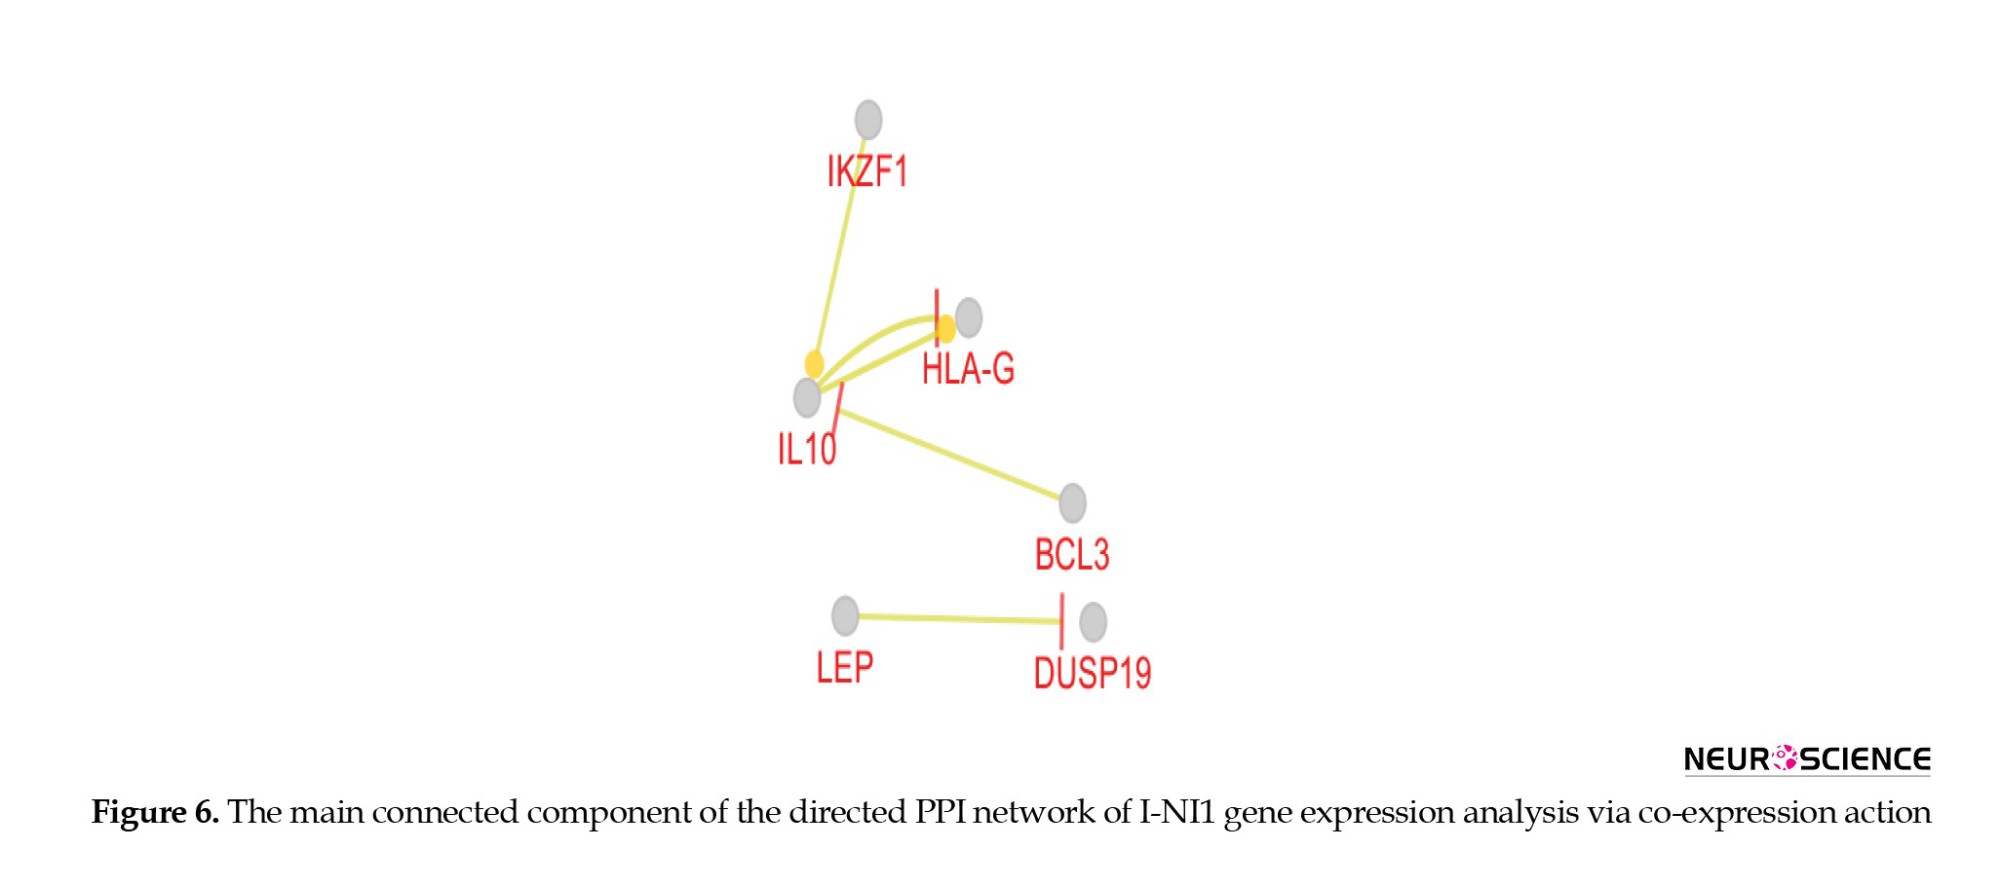
As presented in Figure 6, there are no crucial DEGs that separate the insomnia samples from those in the NI1 group.
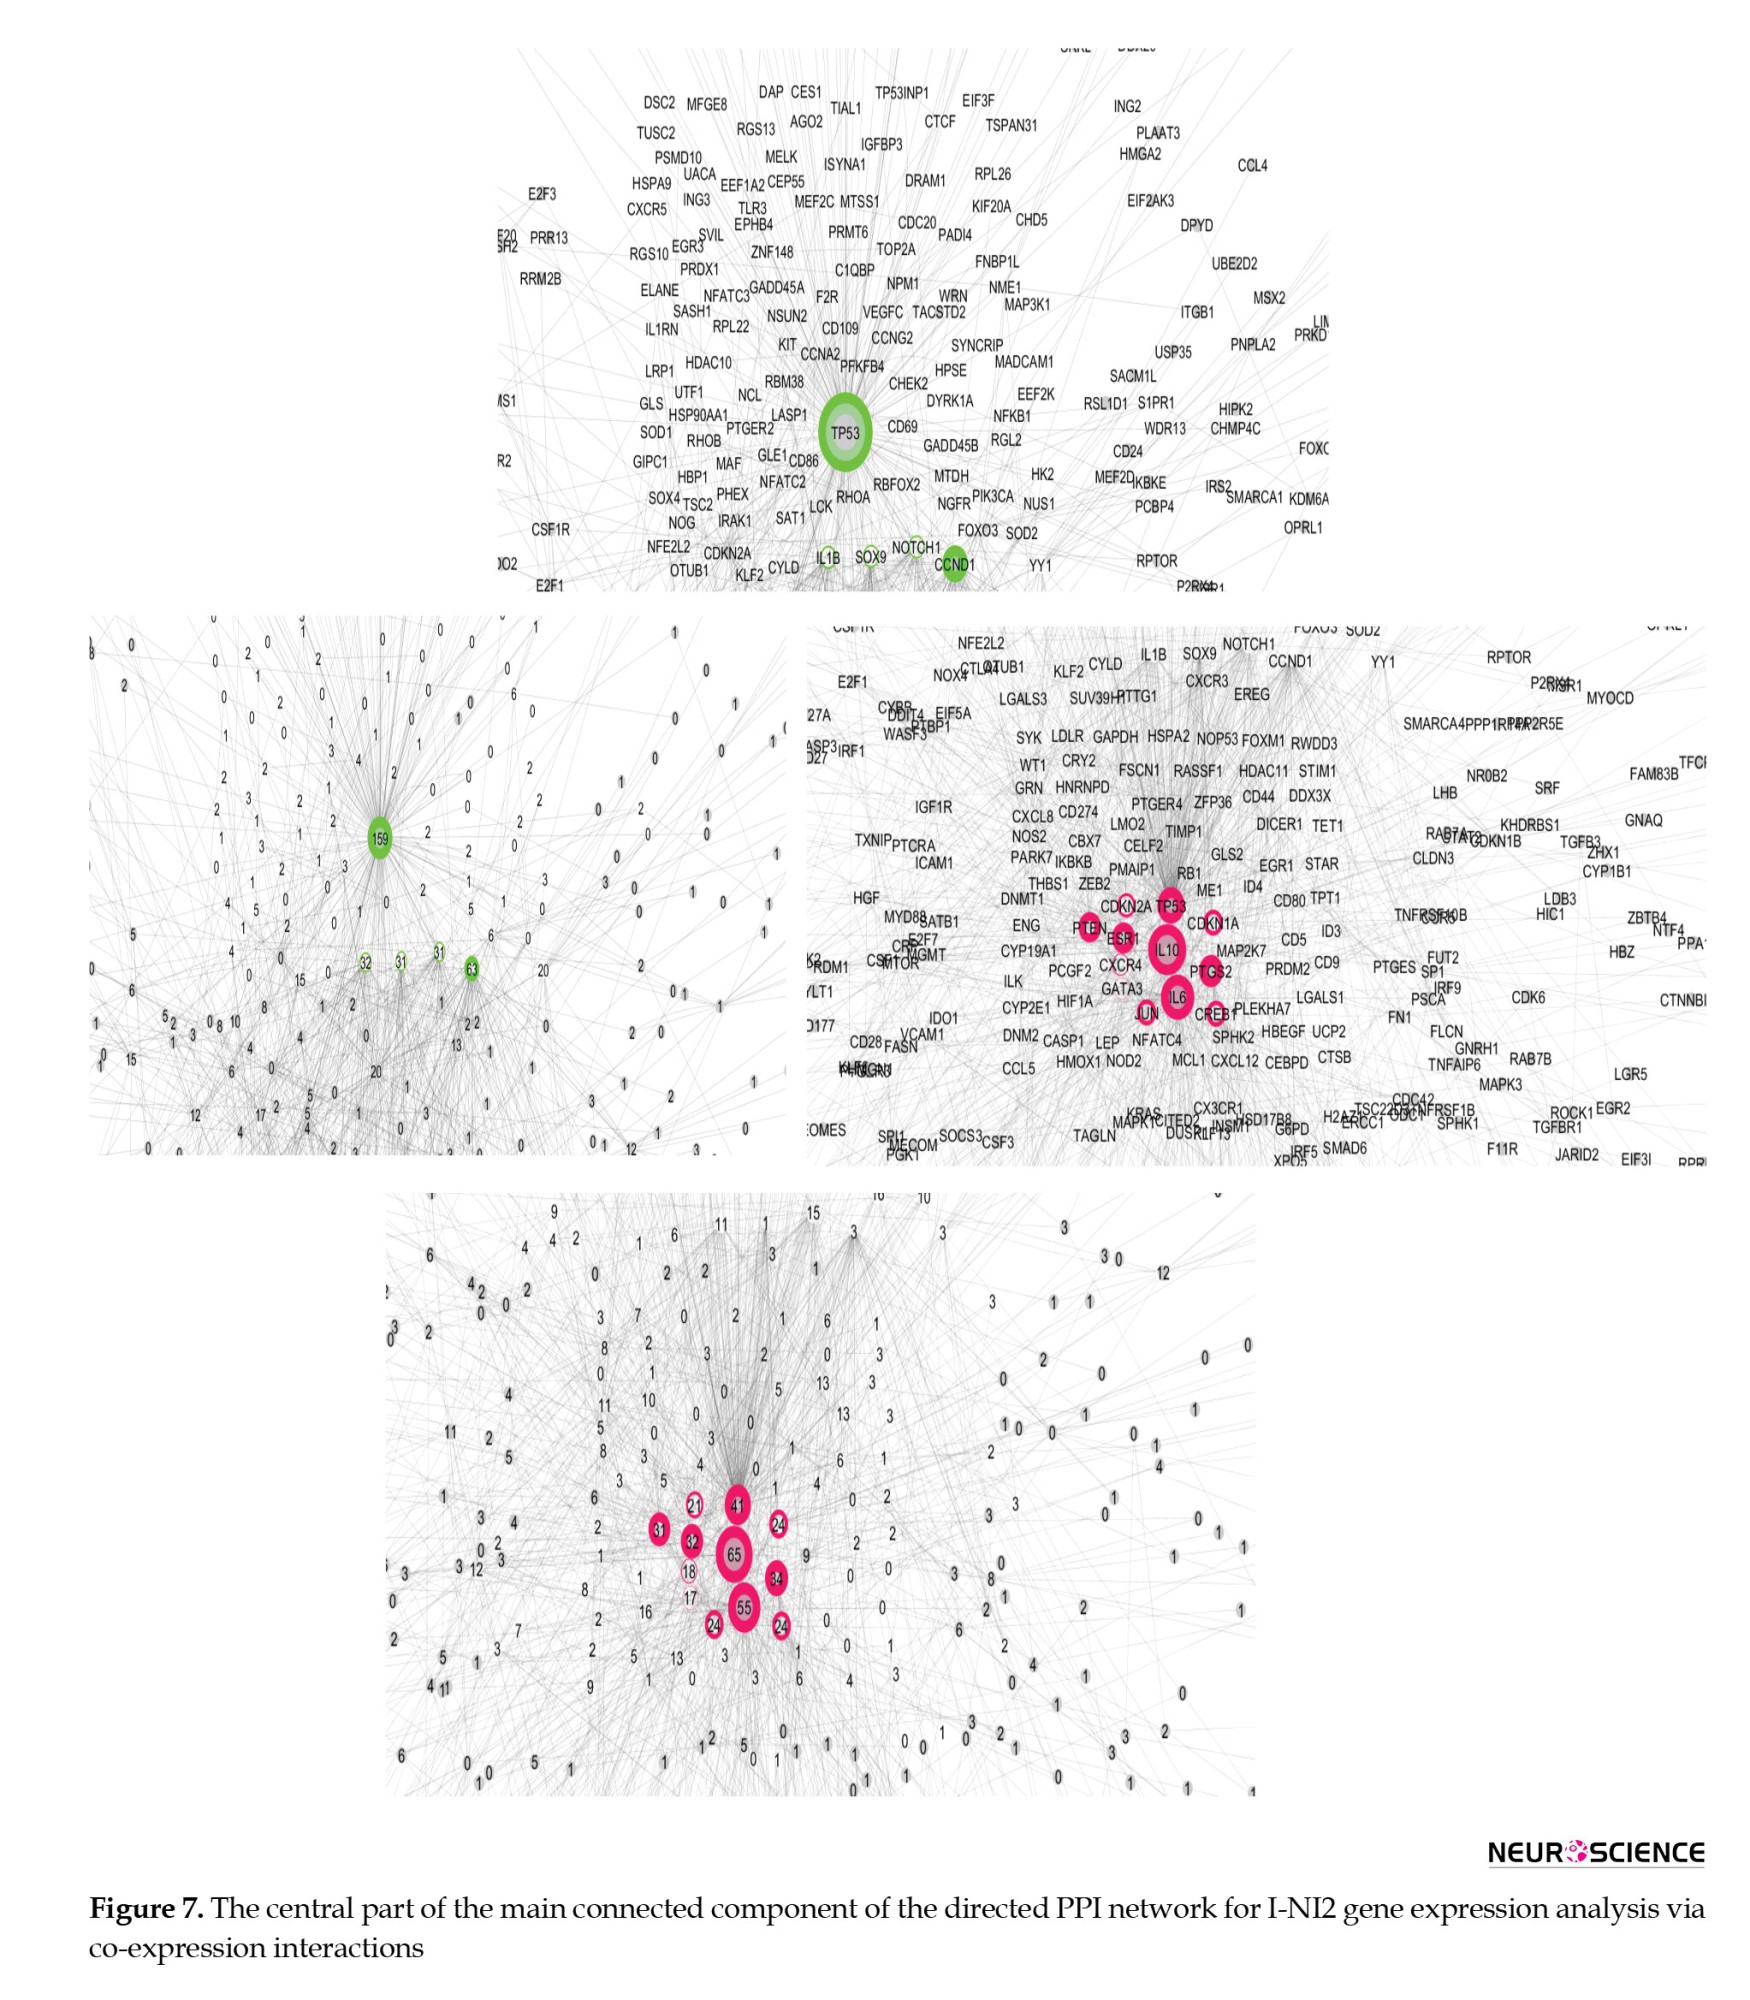
The central part of the main connected component of the PPI network from the I-NI2 analysis, which is laid out based on outdegree and indegree values (via color and amounts of central parameters), is shown in Figure 7. Thus, TP53, CCND1, IL1B, SOX1, and NOTCH1 are identified as the principal actors in the analyzed network, with TP53 being the most influential among them. Finally, IL10, IL6, TP53, PTGS2, ESR1, PTEN, JUN, CREB1, CDKN1A, CDKN2A, CXCR4, and GATA3 are the key controlled DEGs.
The network was formed from 6611 recognized significantly DEGs (including 5692 isolated nodes) and 1522 edges. The actor genes and the related outdegree values are shown in green, while the controlled individuals and the associated indegree values are shown in red.
The network was formed from 6958 recognized significantly DEGs (including 5910 isolated nodes) and 1882 edges. The actor genes and the related outdegree values are shown in green, while the controlled individuals and the associated indegree values are shown in red.
Discussion
Insomnia disorder is reported to be associated with abnormalities in brain function and structure in patients. The investigation has established an association between these abnormalities and gene expression. A study by Zhang et al. revealed the involvement of insomnia disorder-related genes in functions such as brain development, endocrine regulation, and ion transport (Zhang et al., 2024). In the present study, the gene expression of patients was analyzed and compared with that of controls. As depicted in Figures 1, 2, 3 and 4, the analyses revealed heterogeneity in gene expression profiles among the control samples. Although the control samples exhibited heterogeneity, they could be clustered into distinct groups: NI1 and NI2. The issue of sample heterogeneity is addressed in many studies, and various methods have been suggested to resolve it (Feczko & Fair, 2020; Nunes et al., 2020). As shown in Figure 4, the control samples are divided into distinct groups, allowing for comparison with one another.
The genes CCND1, STAT3, SOX9, NOTCH1, IL1B, HMOX1, EGR1, SPI1, YY1, SP1, PTGS2, and PTEN serve as crucial actors, while IL6, PTGS2, PTEN, ESR1, JUN, CREB1, CDKN1A, and CDKN2A function as key controlled genes that differentiate the two compared groups of control samples (Figure 5). This suggests that the clustered control samples exhibit significant differences, at least at the gene expression level, which cannot be overlooked in the analysis of insomnia disorder samples. Since the categorization of insomnia disorder is considered a “work in progress” (Poon et al., 2021), some control samples are classified as normal but may actually belong to the insomnia patient group. This finding suggests that a portion of the normal samples may include individuals who have insomnia. The results, as illustrated in Figure 6, support this notion. As shown in Figure 6, there are no significant differences between the insomnia group and the NI1 group. The main differences are detected between the insomnia patients and the control group of 9 samples (Figure 7). The genes TP53, CCND1, IL1B, SOX1, and NOTCH1 are identified as the main actors, while IL10, IL6, TP53, PTGS2, ESR1, PTEN, JUN, CREB1, CDKN1A, CDKN2A, CXCR4, and GATA3 are recognized as the key controlled genes that distinguish insomnia disorder patients from normal controls. Liang et al.’s investigation, utilizing PPI network analysis and molecular complex detection, introduced 10 hub genes related to insomnia (Liang et al., 2024). The crucial genes in our study, including TP53, JUN, IL6, and CREB1, are part of this set of hub genes. As depicted in Figure 7, TP53 is the primary actor in the I-NI2 analysis. Experiments indicate that ketamine has behavioral effects on exposed animals. Exposure of zebrafish larvae to ketamine resulted in difficulty initiating sleep, which was associated with the upregulation of the TP53 gene, a key component of the apoptotic pathway. After a week of recovery, a shorter duration of sleep (insomnia-like behavior) was observed in the treated zebrafish larvae (Guo et al., 2024). In the present study, TP53 is upregulated twofold in the insomnia group compared to the NI2 group. Several cytokines and immune genes, such as IL-6, IL-10, and IL-1β, have been highlighted in mammals for their association with sleep regulation (Palagini et al., 2014). As mentioned, IL1B ranks as the third most significant actor in our analysis, while IL10 and IL6 are the first and second-ranked controlled genes, respectively. Cyclin D1 (CCND1) is an oncogene, and its role in several cancers, including melanoma, breast cancer, and hepatocellular carcinoma, has been highlighted (Ding et al., 2020; González-Ruiz et al., 2021; Valla et al., 2022). CCND1 appears as the second most significant actor in insomnia. Furthermore, literature suggests a correlation between positive anti-SOX1 in the serum of individuals with fatal familial insomnia, a condition characterized by dysautonomia, motor disorder, and disturbed sleep (Gong et al., 2022). SOX1 is identified as the fourth actor in insomnia. The last actor introduced is NOTCH1, which is regulated by melatonin in rats (Wang et al., 2023). The significant role of melatonin in sleep quality has been both investigated and confirmed (Fatemeh et al., 2022). PTGS2 and chemokine receptor CXCR4 are identified as critical genes in the control of insomnia. As reported in the literature, both PTGS2 and CXCR4 are involved in the inflammatory process (Gallego et al., 2021; Martín-Vázquez et al., 2023). These findings, alongside the presence of the other mentioned interleukins, underscore the prominent role of inflammation in insomnia.
A comparison of critical genes between the NI1-NI2 and I-NI2 analyses reveals that CCND1, IL1B, NOTCH1, and members of the SOX gene family are common actors in both analyses. This finding suggests that 80% of the actors identified in the I-NI2 analysis overlap with those of the NI1-NI2 analysis. It can be concluded that a significant number of control samples may be involved in insomnia and could develop insomnia disorder soon. The controlled genes further support this idea; 100% of the controlled genes in the NI1-NI2 analysis (IL6, PTGS2, PTEN, ESR1, JUN, CREB1, CDKN1A, and CDKN2A) are common to the individuals assessed in the I-NI2 analysis. As highlighted in previous investigations, insomnia is categorized as severe, moderate, and mild (Hohagen et al., 1993). Additionally, sleep duration is classified as very short, short, normal, or long (Rhee et al., 2021). Based on these findings, the term “pre-insomnia” is suitable to describe the situation of the NI1 group.
Conclusion
In conclusion, the findings indicate that many people may potentially be involved in an insomnia disorder. It can be concluded that pre-insomnia occurs before the onset of insomnia. There is a close relationship between the molecular mechanisms of pre-insomnia and insomnia. The genes TP53, CCND1, IL1B, SOX1, and NOTCH1 were highlighted as critical actors in insomnia disorder. Apoptosis, inflammation, and immunological responses, as well as changes in sleep quality (resulting from melatonin dysregulation), were highlighted as prominent events in insomnia disorder.
Ethical Considerations
Compliance with ethical guidelines
This study was approved by the Ethics Committee of Shahid Beheshti University of Medical Sciences, Tehran, Iran (Code: IR.SBMU.RETECH.REC.1403.196).
Funding
This study was supported by Shahid Beheshti University of Medical Sciences, Tehran, Iran.
Authors' contributions
All authors contributed equally to the conception and design of the study, data collection and analysis, interception of the results and drafting of the manuscript. Each author approved the final version of the manuscript for submission.
Conflict of interest
The authors declared no conflict of interest.
References
leep is a fundamental process for restoring brain function and is recognized as a basic dimension of physical and mental health (Baglioni et al., 2016). On the other hand, sleep disturbances, such as insomnia, are associated with an increased risk of dementia (Shi et al., 2018), a higher likelihood of dying from cardiovascular diseases (Sofi et al., 2014), and an elevated risk of mental disorders (Hertenstein et al., 2019). The association between insomnia and depression has been acknowledged, with key indicators including high levels of negative emotion and low levels of positive emotion dysregulation (Tomaso et al., 2021). Franzen et al. revealed that 90% of individuals with major depression report disturbances in normal sleep (Franzen & Buysse, 2008). However, recent meta-analytic data concluded no consistent evidence for an intervention effect between sleep disturbances and improvement in depressive symptoms (Mitter et al., 2022). Circadian systems and sleep are key modulators of immune system function, and experimental sleep deprivation leads to increased expression of interleukin (IL)-6 and tumor necrosis factor (TNF) from nighttime to daytime (Vgontzas et al., 2002). Sleep loss may activate nuclear factor-kappa B, a key regulatory pathway in the inflammatory response, increasing levels of IL-6 and TNF (Irwin et al., 2008). Interventional studies have revealed an association between insomnia and inflammation (Carroll et al., 2015). Evidence suggests that inflammation caused by insomnia may be related to hypothalamic-pituitary-adrenal axis activation and glucocorticoid resistance (Irwin, 2019). Genome-wide association studies of insomnia have identified MEIS1 as having a strong association signal, suggesting that MEIS1 may play a role in insomnia and restless leg syndrome (Hammerschlag et al., 2017). However, the inflammation associated with insomnia and depression has not been thoroughly analyzed and remains largely hypothetical (Palagini et al., 2022).
Today, with the assistance of bioinformatics knowledge and powerful data analysis software, gene network analysis and the interpretation of gene interactions are possible (Hammerschlag et al., 2017). Since bioinformatics tools are suitable for detecting the molecular mechanisms of diseases (Arjmand et al., 2024), this study aims to investigate the molecular mechanisms of insomnia and identify the key genes that are dysregulated in relation to it. The findings may be important for managing individuals with insomnia or related disorders.
Materials and Methods
Data collection
To study the molecular mechanisms of insomnia, data were collected from the Gene Expression Omnibus (GEO) database (GSE208668). Total RNA was obtained from the peripheral blood mononuclear cells of 17 individuals with insomnia disorder and compared to 25 controls for analysis. The data are linked to the published document by Piber et al., titled “sleep disturbance and activation of cellular and transcriptional mechanisms of inflammation in older adults” (Piber et al., 2022). There is evidence that patient cells are a suitable source for studying the molecular mechanisms of the studied disorder or disease (Liu et al., 2023; Zaman et al., 2021).
Pre-evaluation of data
Data were evaluated using the GEO2R program (National Center for Biotechnology Information, NCBI) to identify potential comparisons between samples through box plots, uniform manifold approximation and projection (UMAP) plots, expression density diagrams, and Venn diagrams (Piber et al., 2022). The gene expression profiles that did not match statistically were normalized using the “force normalization” option of the GEO2R program. UMAP plot analysis indicated that normalization had no unfavorable consequence. Significantly differentially expressed genes (DEGs) were selected based on adjusted P<0.05 and a fold change >2. The data were cleaned, and individuals without a characterization were excluded from further analysis.
Protein-protein interaction (PPI) network analysis
The selected significant DEGs were included in a directed PPI network using the CluePedia plugin of Cytoscape software, considering co-expression interactions. The main connected components of the network that were eligible for network topology analysis were assessed using the “Network Analyzer” application of Cytoscape software in “direct” mode. The main connected components were laid out based on outdegree and indegree centrality parameters to identify the critical actor and controlled genes, respectively. The central nodes and their centrality parameters were visualized to highlight the crucial genes.
Statistical analysis
The significant DEGs were selected based on (adjusted P<0.05 and fold change >2. Data analysis was conducted using the GEO2R program (NCBI, version 1.0) to evaluate gene expression profiles from the GEO database (GSE208668). Directed PPI network analysis was performed using the CluePedia plugin (version 1.5.7) of Cytoscape software (version 3.9.1) to evaluate significant DEGs, incorporating co-expression interactions. Central nodes, identified as the most influential and regulated genes, were determined through network topology analysis using the "Network Analyzer" application within Cytoscape, with results visualized to highlight key genes.
Results
Figure 1 presents the visualization of insomnia, consisting of no insomnia (I-NI) samples, using box plots, UMAP plots, and expression density diagrams. As depicted in Figure 1, the NI samples are not uniform and do not match individuals with insomnia. The UMAP plot and density diagram correspond to the two sets of samples in the NI group. Based on the box plot in Figure 1, the gene expression profiles of the NI group were divided into two groups: No Insomnia 1 (NI1) and no insomnia 2 (NI2). NI1 includes GSM6360952, GSM6360955, GSM6360957-60, GSM6360962, and GSM6360967-75, while, GSM6360951, GSM6360953-4, GSM6360956, GSM63609561, and GSM6360963-6 are grouped as NI2.
The box plot, UMAP scheme, expression density diagram, and Venn diagram of the I-NI1-NI2 analysis indicate that the two groups of NI gene expression profiles are completely separated from the insomnia group (Figure 2).
The samples were normalized and compared, and the results of the I-NI1-NI2 reanalysis are shown in Figure 3. As depicted in Figure 3, the three groups are distinguished by their gene expression profiles (see UMAP plot). Since the intensity diagrams of the samples have a similar pattern, the gene expression profiles of the studied groups are comparable. The UMAP plot demonstrated exactly two distinct groups of no-insomnia samples.
To identify the differentiation among the NI1, NI2, and insomnia groups, the gene expression profiles of each group were compared with those of the others. The results of this analysis are depicted in Figure 4. As shown in Figure 4, the three groups are completely separated from each other based on the significant DEGs. As depicted in Figures 2-4 (the Venn diagrams), many DEGs are dysregulated significantly.
The central part of the main connected component of the NI1-NI2 PPI network is shown in Figure 5. According to Figure 5, the genes CCND1, STAT3, SOX9, NOTCH1, IL1B, HMOX1, EGR1, SPI1, YY1, SP1, PTGS2, and PTEN are identified as the main actors that differentiate the two groups from the NI group. These genes are arranged in descending order based on their outdegree values, with CCND1 and PTEN being the strongest and weakest actors, respectively. Next, IL6, PTGS2, PTEN, ESR1, JUN, CREB1, CDKN1A, and CDKN2A were highlighted as the critical controlled DEGs, with IL6 and CDKN2A identified as the most and least influential controlled DEGs, respectively. The genes are laid out based on outdegree and indegree values, using color to represent the related amounts of the central parameters.
As presented in Figure 6, there are no crucial DEGs that separate the insomnia samples from those in the NI1 group.
The central part of the main connected component of the PPI network from the I-NI2 analysis, which is laid out based on outdegree and indegree values (via color and amounts of central parameters), is shown in Figure 7. Thus, TP53, CCND1, IL1B, SOX1, and NOTCH1 are identified as the principal actors in the analyzed network, with TP53 being the most influential among them. Finally, IL10, IL6, TP53, PTGS2, ESR1, PTEN, JUN, CREB1, CDKN1A, CDKN2A, CXCR4, and GATA3 are the key controlled DEGs.
The network was formed from 6611 recognized significantly DEGs (including 5692 isolated nodes) and 1522 edges. The actor genes and the related outdegree values are shown in green, while the controlled individuals and the associated indegree values are shown in red.
The network was formed from 6958 recognized significantly DEGs (including 5910 isolated nodes) and 1882 edges. The actor genes and the related outdegree values are shown in green, while the controlled individuals and the associated indegree values are shown in red.
Discussion
Insomnia disorder is reported to be associated with abnormalities in brain function and structure in patients. The investigation has established an association between these abnormalities and gene expression. A study by Zhang et al. revealed the involvement of insomnia disorder-related genes in functions such as brain development, endocrine regulation, and ion transport (Zhang et al., 2024). In the present study, the gene expression of patients was analyzed and compared with that of controls. As depicted in Figures 1, 2, 3 and 4, the analyses revealed heterogeneity in gene expression profiles among the control samples. Although the control samples exhibited heterogeneity, they could be clustered into distinct groups: NI1 and NI2. The issue of sample heterogeneity is addressed in many studies, and various methods have been suggested to resolve it (Feczko & Fair, 2020; Nunes et al., 2020). As shown in Figure 4, the control samples are divided into distinct groups, allowing for comparison with one another.
The genes CCND1, STAT3, SOX9, NOTCH1, IL1B, HMOX1, EGR1, SPI1, YY1, SP1, PTGS2, and PTEN serve as crucial actors, while IL6, PTGS2, PTEN, ESR1, JUN, CREB1, CDKN1A, and CDKN2A function as key controlled genes that differentiate the two compared groups of control samples (Figure 5). This suggests that the clustered control samples exhibit significant differences, at least at the gene expression level, which cannot be overlooked in the analysis of insomnia disorder samples. Since the categorization of insomnia disorder is considered a “work in progress” (Poon et al., 2021), some control samples are classified as normal but may actually belong to the insomnia patient group. This finding suggests that a portion of the normal samples may include individuals who have insomnia. The results, as illustrated in Figure 6, support this notion. As shown in Figure 6, there are no significant differences between the insomnia group and the NI1 group. The main differences are detected between the insomnia patients and the control group of 9 samples (Figure 7). The genes TP53, CCND1, IL1B, SOX1, and NOTCH1 are identified as the main actors, while IL10, IL6, TP53, PTGS2, ESR1, PTEN, JUN, CREB1, CDKN1A, CDKN2A, CXCR4, and GATA3 are recognized as the key controlled genes that distinguish insomnia disorder patients from normal controls. Liang et al.’s investigation, utilizing PPI network analysis and molecular complex detection, introduced 10 hub genes related to insomnia (Liang et al., 2024). The crucial genes in our study, including TP53, JUN, IL6, and CREB1, are part of this set of hub genes. As depicted in Figure 7, TP53 is the primary actor in the I-NI2 analysis. Experiments indicate that ketamine has behavioral effects on exposed animals. Exposure of zebrafish larvae to ketamine resulted in difficulty initiating sleep, which was associated with the upregulation of the TP53 gene, a key component of the apoptotic pathway. After a week of recovery, a shorter duration of sleep (insomnia-like behavior) was observed in the treated zebrafish larvae (Guo et al., 2024). In the present study, TP53 is upregulated twofold in the insomnia group compared to the NI2 group. Several cytokines and immune genes, such as IL-6, IL-10, and IL-1β, have been highlighted in mammals for their association with sleep regulation (Palagini et al., 2014). As mentioned, IL1B ranks as the third most significant actor in our analysis, while IL10 and IL6 are the first and second-ranked controlled genes, respectively. Cyclin D1 (CCND1) is an oncogene, and its role in several cancers, including melanoma, breast cancer, and hepatocellular carcinoma, has been highlighted (Ding et al., 2020; González-Ruiz et al., 2021; Valla et al., 2022). CCND1 appears as the second most significant actor in insomnia. Furthermore, literature suggests a correlation between positive anti-SOX1 in the serum of individuals with fatal familial insomnia, a condition characterized by dysautonomia, motor disorder, and disturbed sleep (Gong et al., 2022). SOX1 is identified as the fourth actor in insomnia. The last actor introduced is NOTCH1, which is regulated by melatonin in rats (Wang et al., 2023). The significant role of melatonin in sleep quality has been both investigated and confirmed (Fatemeh et al., 2022). PTGS2 and chemokine receptor CXCR4 are identified as critical genes in the control of insomnia. As reported in the literature, both PTGS2 and CXCR4 are involved in the inflammatory process (Gallego et al., 2021; Martín-Vázquez et al., 2023). These findings, alongside the presence of the other mentioned interleukins, underscore the prominent role of inflammation in insomnia.
A comparison of critical genes between the NI1-NI2 and I-NI2 analyses reveals that CCND1, IL1B, NOTCH1, and members of the SOX gene family are common actors in both analyses. This finding suggests that 80% of the actors identified in the I-NI2 analysis overlap with those of the NI1-NI2 analysis. It can be concluded that a significant number of control samples may be involved in insomnia and could develop insomnia disorder soon. The controlled genes further support this idea; 100% of the controlled genes in the NI1-NI2 analysis (IL6, PTGS2, PTEN, ESR1, JUN, CREB1, CDKN1A, and CDKN2A) are common to the individuals assessed in the I-NI2 analysis. As highlighted in previous investigations, insomnia is categorized as severe, moderate, and mild (Hohagen et al., 1993). Additionally, sleep duration is classified as very short, short, normal, or long (Rhee et al., 2021). Based on these findings, the term “pre-insomnia” is suitable to describe the situation of the NI1 group.
Conclusion
In conclusion, the findings indicate that many people may potentially be involved in an insomnia disorder. It can be concluded that pre-insomnia occurs before the onset of insomnia. There is a close relationship between the molecular mechanisms of pre-insomnia and insomnia. The genes TP53, CCND1, IL1B, SOX1, and NOTCH1 were highlighted as critical actors in insomnia disorder. Apoptosis, inflammation, and immunological responses, as well as changes in sleep quality (resulting from melatonin dysregulation), were highlighted as prominent events in insomnia disorder.
Ethical Considerations
Compliance with ethical guidelines
This study was approved by the Ethics Committee of Shahid Beheshti University of Medical Sciences, Tehran, Iran (Code: IR.SBMU.RETECH.REC.1403.196).
Funding
This study was supported by Shahid Beheshti University of Medical Sciences, Tehran, Iran.
Authors' contributions
All authors contributed equally to the conception and design of the study, data collection and analysis, interception of the results and drafting of the manuscript. Each author approved the final version of the manuscript for submission.
Conflict of interest
The authors declared no conflict of interest.
References
Arjmand, B., Khodadoost, M., Jahani Sherafat, S., Rezaei Tavirani, M., Ahmadi, N., & Rezaei Tavirani, S. (2024). Introducing critical proteins related to liver ischemia/reperfusion injury. Gastroenterology and Hepatology from Bed to Bench, 17(1), 87–92. [PMID]
Baglioni, C., Nanovska, S., Regen, W., Spiegelhalder, K., Feige, B., & Nissen, C., et al. (2016). Sleep and mental disorders: A meta-analysis of polysomnographic research. Psychological Bulletin, 142(9), 969–990. [DOI:10.1037/bul0000053] [PMID]
Carroll, J. E., Seeman, T. E., Olmstead, R., Melendez, G., Sadakane, R., & Bootzin, R., et al. (2015). Improved sleep quality in older adults with insomnia reduces biomarkers of disease risk: pilot results from a randomized controlled comparative efficacy trial. Psychoneuroendocrinology, 55, 184–192. [DOI:10.1016/j.psyneuen.2015.02.010] [PMID]
Ding, H., Wang, Y., & Zhang, H. (2020). CCND1 silencing suppresses liver cancer stem cell differentiation and overcomes 5-Fluorouracil resistance in hepatocellular carcinoma. Journal of Pharmacological Sciences, 143(3), 219–225. [DOI:10.1016/j.jphs.2020.04.006] [PMID]
Fatemeh, G., Sajjad, M., Niloufar, R., Neda, S., Leila, S., & Khadijeh, M. (2022). Effect of melatonin supplementation on sleep quality: a systematic review and meta-analysis of randomized controlled trials. Journal of Neurology, 269(1), 205–216. [DOI:10.1007/s00415-020-10381-w] [PMID]
Feczko, E., & Fair, D. A. (2020). Methods and challenges for assessing heterogeneity. Biological Psychiatry, 88(1), 9-17. [DOI:10.1016/j.biopsych.2020.02.015] [PMID]
Franzen, P. L., & Buysse, D. J. (2008). Sleep disturbances and depression: risk relationships for subsequent depression and therapeutic implications. Dialogues in Clinical Neuroscience, 10(4), 473-481. [DOI:10.31887/DCNS.2008.10.4/plfranzen] [PMID]
Gallego, C., Vétillard, M., Calmette, J., Roriz, M., Marin-Esteban, V., & Evrard, M., et al. (2021). CXCR4 signaling controls dendritic cell location and activation at steady state and in inflammation. Blood, 137(20), 2770–2784. [DOI:10.1182/blood.2020006675] [PMID]
Gong, M., Wang, S., & Lin, H. (2022). Postural instability and backward leaning in a patient of familial fatal insomnia with positive SOX1 antibodies. Sleep Medicine, 91, 59-61. [DOI:10.1016/j.sleep.2022.02.010] [PMID]
González-Ruiz, L., González-Moles, M. Á., González-Ruiz, I., Ruiz-Ávila, I., & Ramos-García, P. (2021). Prognostic and clinicopathological significance of CCND1/cyclin D1 upregulation in melanomas: A systematic review and comprehensive meta-analysis. Cancers, 13(6), 1314. [DOI:10.3390/cancers13061314] [PMID]
Guo, T., He, Y., Mao, S., Yang, Y., Xie, H., & Zhang, S., et al. (2024). Ketamine induces insomnia-like symptom of zebrafish at environmentally relevant concentrations by mediating GABAergic synapse. Environmental Toxicology, 39(7), 3897–3905. [DOI:10.1002/tox.24227] [PMID]
Hammerschlag, A. R., Stringer, S., de Leeuw, C. A., Sniekers, S., Taskesen, E., & Watanabe, K., et al. (2017). Genome-wide association analysis of insomnia complaints identifies risk genes and genetic overlap with psychiatric and metabolic traits. Nature Genetics, 49(11), 1584–1592. [DOI:10.1038/ng.3888] [PMID]
Hertenstein, E., Feige, B., Gmeiner, T., Kienzler, C., Spiegelhalder, K., & Johann, A., et al. (2019). Insomnia as a predictor of mental disorders: A systematic review and meta-analysis. Sleep Medicine Reviews, 43, 96–105. [DOI:10.1016/j.smrv.2018.10.006] [PMID]
Hohagen, F., Rink, K., Käppler, C., Schramm, E., Riemann, D., & Weyerer, S., et al. (1993). Prevalence and treatment of insomnia in general practice. A longitudinal study. European Archives of Psychiatry and Clinical Neuroscience, 242(6), 329–336.[DOI:10.1007/BF02190245] [PMID]
Irwin, M. R. (2019). Sleep and inflammation: Partners in sickness and in health. Nature Reviews Immunology, 19(11), 702-715. [DOI:10.1038/s41577-019-0190-z] [PMID]
Irwin, M. R., Wang, M., Ribeiro, D., Cho, H. J., Olmstead, R., & Breen, E. C., et al. (2008). Sleep loss activates cellular inflammatory signaling. Biological Psychiatry, 64(6), 538–540. [DOI:10.1016/j.biopsych.2008.05.004] [PMID]
Liang, Y., Lv, Y., Qin, J., & Deng, W. (2024). Network pharmacology analysis of the potential pharmacological mechanism of a sleep cocktail. Biomolecules, 14(6), 630. [DOI:10.3390/biom14060630] [PMID]
Liu, Z., Liang, Q., Ren, Y., Guo, C., Ge, X., & Wang, L., et al. (2023). Immunosenescence: Molecular mechanisms and diseases. Signal Transduction and Targeted Therapy, 8(1), 200. [DOI:10.1038/s41392-023-01451-2] [PMID]
Martín-Vázquez, E., Cobo-Vuilleumier, N., López-Noriega, L., Lorenzo, P. I., & Gauthier, B. R. (2023). The PTGS2/COX2-PGE2 signaling cascade in inflammation: Pro or anti? A case study with type 1 diabetes mellitus. International Journal of Biological Sciences, 19(13), 4157–4165. [DOI:10.7150/ijbs.86492] [PMID]
Mitter, P., De Crescenzo, F., Loo Yong Kee, K., Xia, J., Roberts, S., & Chi, W., et al. (2022). Sleep deprivation as a treatment for major depressive episodes: A systematic review and meta-analysis. Sleep Medicine Reviews, 64, 101647. [DOI:10.1016/j.smrv.2022.101647] [PMID]
Nunes, A., Trappenberg, T., & Alda, M. (2020). The definition and measurement of heterogeneity. Translational Psychiatry, 10(1), 299. [DOI:10.1038/s41398-020-00986-0] [PMID]
Palagini, L., Biber, K., & Riemann, D. (2014). The genetics of insomnia-evidence for epigenetic mechanisms? Sleep Medicine Reviews, 18(3), 225-235. [DOI:10.1016/j.smrv.2013.05.002] [PMID]
Palagini, L., Geoffroy, P. A., Miniati, M., Perugi, G., Biggio, G., & Marazziti, D., et al. (2022). Insomnia, sleep loss, and circadian sleep disturbances in mood disorders: A pathway toward neurodegeneration and neuroprogression? A theoretical review. CNS Spectrums, 27(3), 298–308. [DOI:10.1017/S1092852921000018] [PMID]
Piber, D., Cho, J. H., Lee, O., Lamkin, D. M., Olmstead, R., & Irwin, M. R. (2022). Sleep disturbance and activation of cellular and transcriptional mechanisms of inflammation in older adults. Brain, Behavior, and Immunity, 106, 67-75. [DOI:10.1016/j.bbi.2022.08.004] [PMID]
Poon, S. H., Quek, S. Y., & Lee, T. S. (2021). Insomnia disorders: Nosology and classification past, present, and future. The Journal of Neuropsychiatry and Clinical Neurosciences, 33(3), 194-200. [DOI:10.1176/appi.neuropsych.20080206] [PMID]
Nuñez, A., Rhee, J. U., Haynes, P., Chakravorty, S., Patterson, F., & Killgore, W. D. S., et al. (2021). Smoke at night and sleep worse? The associations between cigarette smoking with insomnia severity and sleep duration. Sleep Health, 7(2), 177–182. [DOI:10.1016/j.sleh.2020.10.006] [PMID]
Shi, L., Chen, S. J., Ma, M. Y., Bao, Y. P., Han, Y., & Wang, Y. M., et al. (2018). Sleep disturbances increase the risk of dementia: A systematic review and meta-analysis. Sleep Medicine Reviews, 40, 4–16. [DOI:10.1016/j.smrv.2017.06.010] [PMID]
Sofi, F., Cesari, F., Casini, A., Macchi, C., Abbate, R., & Gensini, G. F. (2014). Insomnia and risk of cardiovascular disease: a meta-analysis. European Journal of Preventive Cardiology, 21(1), 57–64.[DOI:10.1177/2047487312460020] [PMID]
Tomaso, C. C., Johnson, A. B., & Nelson, T. D. (2021). The effect of sleep deprivation and restriction on mood, emotion, and emotion regulation: Three meta-analyses in one. Sleep, 44(6), zsaa289. [DOI:10.1093/sleep/zsaa289] [PMID]
Valla, M., Klæstad, E., Ytterhus, B., & Bofin, A. M. (2022). CCND1 Amplification in breast cancer -associations with proliferation, histopathological grade, molecular subtype and prognosis. Journal of Mammary Gland Biology and Neoplasia, 27(1), 67–77. [DOI:10.1007/s10911-022-09516-8] [PMID]
Vgontzas, A. N., Zoumakis, M., Papanicolaou, D. A., Bixler, E. O., Prolo, P., & Lin, H. M., et al. (2002). Chronic insomnia is associated with a shift of interleukin-6 and tumor necrosis factor secretion from nighttime to daytime. Metabolism: Clinical and Experimental, 51(7), 887–892. [DOI:10.1053/meta.2002.33357] [PMID]
Wang, P., Zhang, S., Hu, C., Ren, L., & Bi, J. (2023). Regulatory role of melatonin in Notch1 signaling pathway in cerebral cortex of Aβ1− 42-induced Alzheimer’s disease rat model. Molecular Biology Reports, 50(3), 2463-2469. [DOI:10.1007/s11033-022-08213-3] [PMID]
Zaman, V., Shields, D. C., Shams, R., Drasites, K. P., Matzelle, D., & Haque, A., et al. (2021). Cellular and molecular pathophysiology in the progression of Parkinson’s disease. Metabolic Brain Disease, 36(5), 815–827. [DOI:10.1007/s11011-021-00689-5] [PMID]
Zhang, H., Sun, H., Li, J., Lv, Z., Tian, Y., & Lei, X. (2025). Gene expression is associated with brain function of insomnia disorder, rather than brain structure. Progress in Neuro-Psychopharmacology & Biological Psychiatry, 136, 111209.[DOI:10.1016/j.pnpbp.2024.111209] [PMID]
Type of Study: Original |
Subject:
Behavioral Neuroscience
Received: 2024/12/14 | Accepted: 2025/01/7 | Published: 2025/09/1
Received: 2024/12/14 | Accepted: 2025/01/7 | Published: 2025/09/1
Send email to the article author
| Rights and permissions | |
 |
This work is licensed under a Creative Commons Attribution-NonCommercial 4.0 International License. |
![]()
Copyright © The Author(s);
This is an open access article distributed under the terms of the Creative Commons Attribution License (CC-By-NC), which permits use, distribution, and reproduction in any medium, provided the original work is properly cited and is not used for commercial purposes.
Contact Information
