

Volume 16, Issue 6 (November & December 2025)
BCN 2025, 16(6): 1051-1066 |
Back to browse issues page


Download citation:
BibTeX | RIS | EndNote | Medlars | ProCite | Reference Manager | RefWorks
Send citation to:


BibTeX | RIS | EndNote | Medlars | ProCite | Reference Manager | RefWorks
Send citation to:
Ghafoori S, Shalbaf A. Detecting Mild Cognitive Impairment to Alzheimer’s Disease Progression by fMRI Using Convolutional Neural Network and Long-short Term Memory. BCN 2025; 16 (6) :1051-1066
URL: http://bcn.iums.ac.ir/article-1-3081-en.html
URL: http://bcn.iums.ac.ir/article-1-3081-en.html


1- Department of Biomedical Engineering and Medical Physics, School of Medicine, Shahid Beheshti University of Medical Sciences, Tehran, Iran.
Keywords: Alzheimer’s disease (AD), Deep learning (DL), Convolutional neural network (CNN), Long-short term memory (LSTM), Mild cognitive impairment (MCI), Magnetic resonance imaging (MRI)
Full-Text [PDF 1979 kb]
| Abstract (HTML)
Full-Text:
Introduction
Alzheimer’s disease (AD) is the most common cause of dementia in old age and causes irreversible damage to the brain. However, if implemented early in the disease, proven treatments could be practical and help weaken the process by stopping or slowing the destruction of brain tissue (Weller & Budson, 2018; Yiannopoulou & Papageorgiou, 2020). Accurate diagnosis of various stages of Alzheimer’s is based on cerebrospinal fluid (CSF) pathology, an expensive and invasive procedure (Engelborghs et al., 2017; Anoop et al., 2010). Donepezil, memantine, galantamine, rivastigmine, and aducanumab are Food and Drug Administration (FDA)-approved drugs prescribed for AD treatment in the early stages of the disease (Li et al., 2018; Koola 2020; Ray et al., 2020; Padda & Parmar, 2024). Mild cognitive impairment (MCI) is a pre-Alzheimer’s stage in which some of the symptoms of Alzheimer’s are poorly experienced; therefore, there is a high risk of developing Alzheimer’s. However, this progression is not guaranteed, and the individual will likely return to normal or remain at this stage (Neugroschl & Wang, 2011; Sanford, 2017). Given that Alzheimer’s effects on the brain start years prior to clinical symptoms, it is critical and attainable to predict the conversion of MCI to AD using brain information (Devanand et al. 2008; Mantzavinos & Alexiou, 2017). In this case, people can prepare for the disease from different aspects and start treatment as early as possible to achieve the best results.
Researchers and clinicians frequently exploit brain imaging methods, such as magnetic resonance imaging (MRI), positron emission tomography (PET), and functional MRI (fMRI) for this task. MRI shows the brain structure with high spatial resolution. PET uses ionizing radiation to provide insight into the brain’s anatomy and function with lower spatial resolution than MRI. FMRI provides knowledge about the anatomy and metabolic mechanisms of the brain with higher temporal and spatial resolution than PET, while being harmless (Buttenschoen et al., 2008; Judenhofer & Cherry, 2013; Varghese et al., 2013). Other techniques, such as magnetoencephalography (MEG) have their advantages and disadvantages (Varghese et al., 2013). Finally, invasive data, such as genetic information and CSF, and the cheapest, most accessible, and safest data types, such as clinical cognitive tests, have been used to predict AD among patients with MCI.
In recent years, many studies have used machine learning (ML) methods to predict conversion from MCI to AD, combining neuroimaging and clinical data with relatively good results. Researchers have attempted to solve this problem using new ML techniques, such as deep learning (DL), since these methods can discover and learn hidden patterns and provide more accurate answers (DeTure & Dickson, 2019; Tible et al., 2020). There is much ML research in neuroimaging-related studies, including MRI, PET, and fMRI, and researchers often exploit machine learning techniques to analyze manually extracted features. Among the mentioned studies, some are as follows: Hojjati et al. (2017) used a connection matrix to extract graph properties from resting-state fMRI data. Several of these features were then selected for evaluation using a support vector machine (SVM). Hojjati et al. (2018) also combined the characteristics of the same fMRI and MRI data of the subjects. In recent years, DL strategies have been used to solve this problem. Abrol et al. (2019) extracted time-varying features from fMRI, then deployed a three-dimensional convolutional neural network (3D-CNN) to extract attributes from MRI data, and trained an SVM on the combined features. Gao et al., in 2020 developed a 3D-CNN (containing six layers of convolution and three layers of max-pooling) based on MRI images (Gao et al., 2020). Nanni et al. in 2020 planned to compare the performance of transfer learning models with a 3D-CNN in processing MRI images. To do this, she designed a simple one-layer convolutional model and fine-tuned several pre-trained models. Finally, an average ensemble model was designed on five retrained models (Nanni et al. 2020). Pan et al. (2020) developed a novel integrated CNN-based model called the multi-view separable pyramid network. In this model, slice-wise and spatial-wise CNNs were performed on three PET image views (axial, coronal, and sagittal), and the resulting outputs were combined for classification. Er & Goularas (2020) used a CNN model whose filters were trained with an autoencoder to extract prognostic features from each patient’s volume. Then these features were delivered to an SVM model for classification. Also, some of these machine learning studies have deployed invasive data, such as genetic information and CSF, to predict MCI to AD (Cui et al., 2011; Zhang et al., 2012; Gavidia-Bovadilla et al., 2017; Lin et al., 2020). Lin et al. in 2020 developed an SVM model by combining information extracted from PET, MRI, CSF, genetic data, and clinical cognitive tests (Lin et al., 2020). Finally, in some machine learning studies, clinical cognitive tests and brain signals have been used to predict Alzheimer’s (Grassi et al., 2018; Grassi et al., 2019; Poil et al., 2013). In these studies, large samples were required to obtain reliable results. Grassi et al. (2018) used clinical and demographic features. After applying the feature selection process, several machine learning algorithms were designed and the best model was an SVM with a kernel-based radial base function. Also, Grassi et al. (2019) used only demographic data and cognitive clinical tests. First, all the features were used; then three more feature sets were created using three feature selection methods; and 13 machine learning algorithms were developed according to these four sets, resulting in 52 final models. Furthermore, a weighted averaging model was designed, by which the results of 52 models were averaged and presented on the test data. Finally, Xu et al. (2021) used a general form of Graph2Gauss architecture, a DL-based method called multiple graph Gaussian embedding model (MG2G), to classify graph-based features derived from MEG regional time series.
Nevertheless, none of these studies contains enough information alone to decisively predict the prognosis of MCI to AD. Also, some studies have used invasive predictors, such as CSF and genetics (Cui et al., 2011; Zhang et al., 2012; Gavidia-Bovadilla et al., 2017; Lin et al., 2020). To the best of our knowledge, this is the first study to use DL methods, including three-dimensional CNNs and long short-term memory (LSTM) to process fMRI data and address the described problem. These methods automatically extract and classify features, which is their primary advantage over conventional machine-learning techniques. This study aimed to introduce a new approach that combines features extracted from clinical cognitive tests and neuroimaging data in a neuronal framework and examine its effectiveness in improving results.
Materials and Methods
Dataset
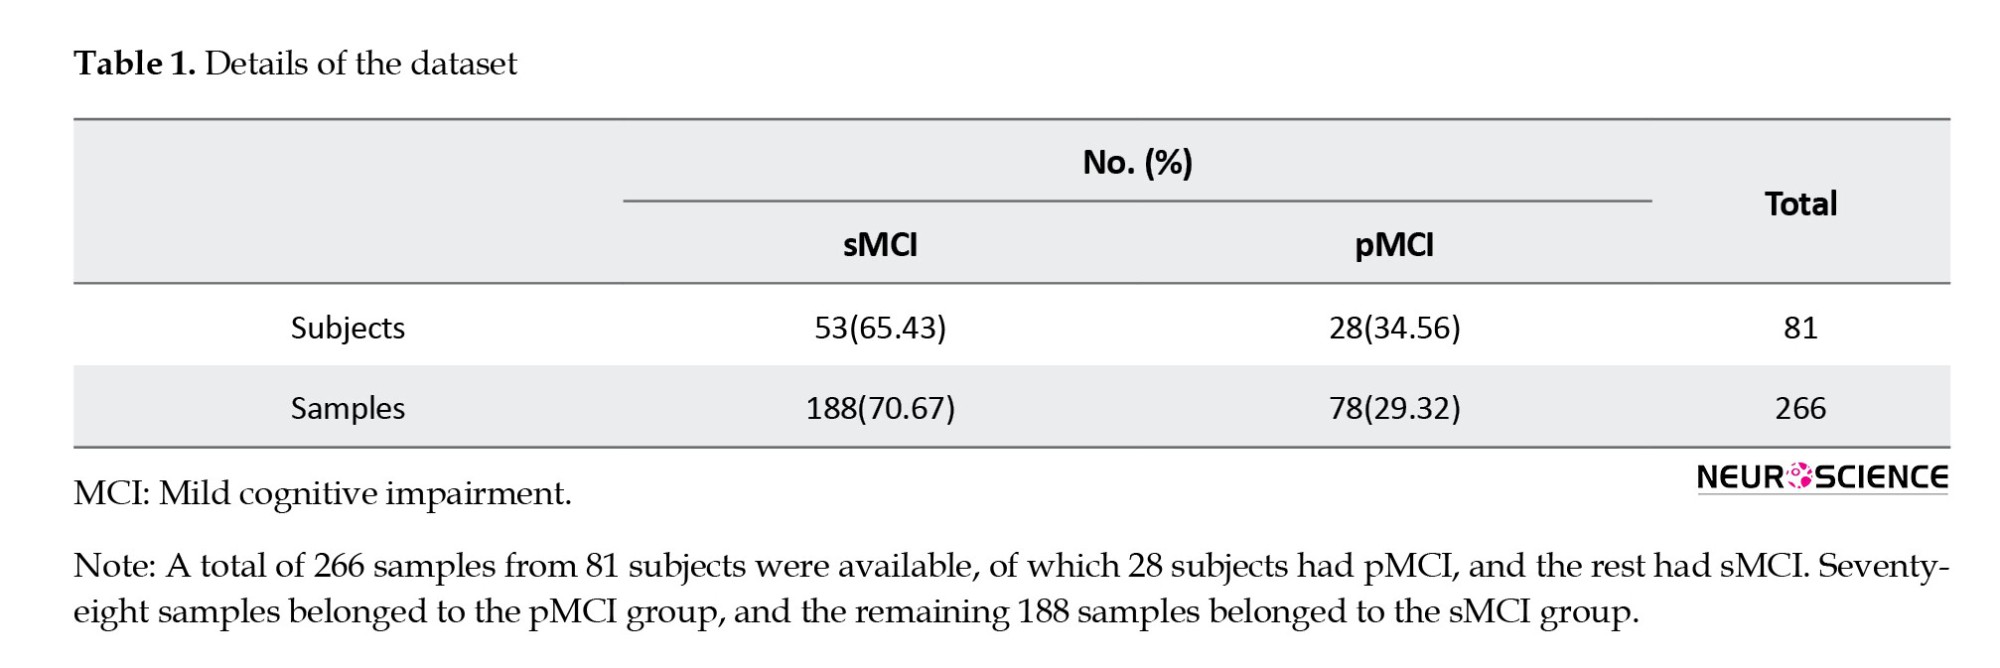
In this study, clinical and fMRI data from patients who had been in the MCI stage were collected from the AD Neuroimaging Initiative (ADNI) to predict MCI conversion to Alzheimer’s. ADNI is a multicenter study designed to develop clinical, imaging, genetic, and biochemical markers for the early diagnosis of AD. Since its inception, over a decade ago, public-private partnerships have played a significant role in Alzheimer’s research, enabling data sharing among researchers worldwide. In ADNI, when a person is admitted according to inclusion and exclusion criteria, an initial diagnosis is made based on CSF pathology. Clinical cognitive tests are performed approximately every six months, and the remaining biomarkers are collected at time intervals of one to two years. This process continues as long as the person remains in the study, and specialists constantly update the patient’s diagnostic status. This study aimed to predict the conversion of MCI to Alzheimer’s by combining clinical and fMRI data. Thus, information from patients who had primarily been in the MCI stage was gathered. Some of these individuals remained moderately in the MCI phase over the years or eventually returned to normal (stable MCI [sMCI] group); however, the rest progressed to Alzheimer’s after a while (progressive MCI [pMCI] group). In this study, we excluded subjects who had been in the study for less than a year. Furthermore, because we wanted to utilize a combination of imaging and clinical data, given the differences in recording dates, we first examined the imaging dates for each patient. Then we considered test results recorded around the same time (no more than one month apart). Therefore, the corresponding clinical data were collected for each imaging series on a single date. If any data were not available on a given date, the other data were not used. Finally, we had 81 subjects, 28 had progressed from MCI to AD, and 53 either remained in MCI or returned to normal. A total of 266 samples from these individuals were available, of which 78 belonged to the pMCI class and 188 to the sMCI class. Table 1 presents details of the data in the two groups.
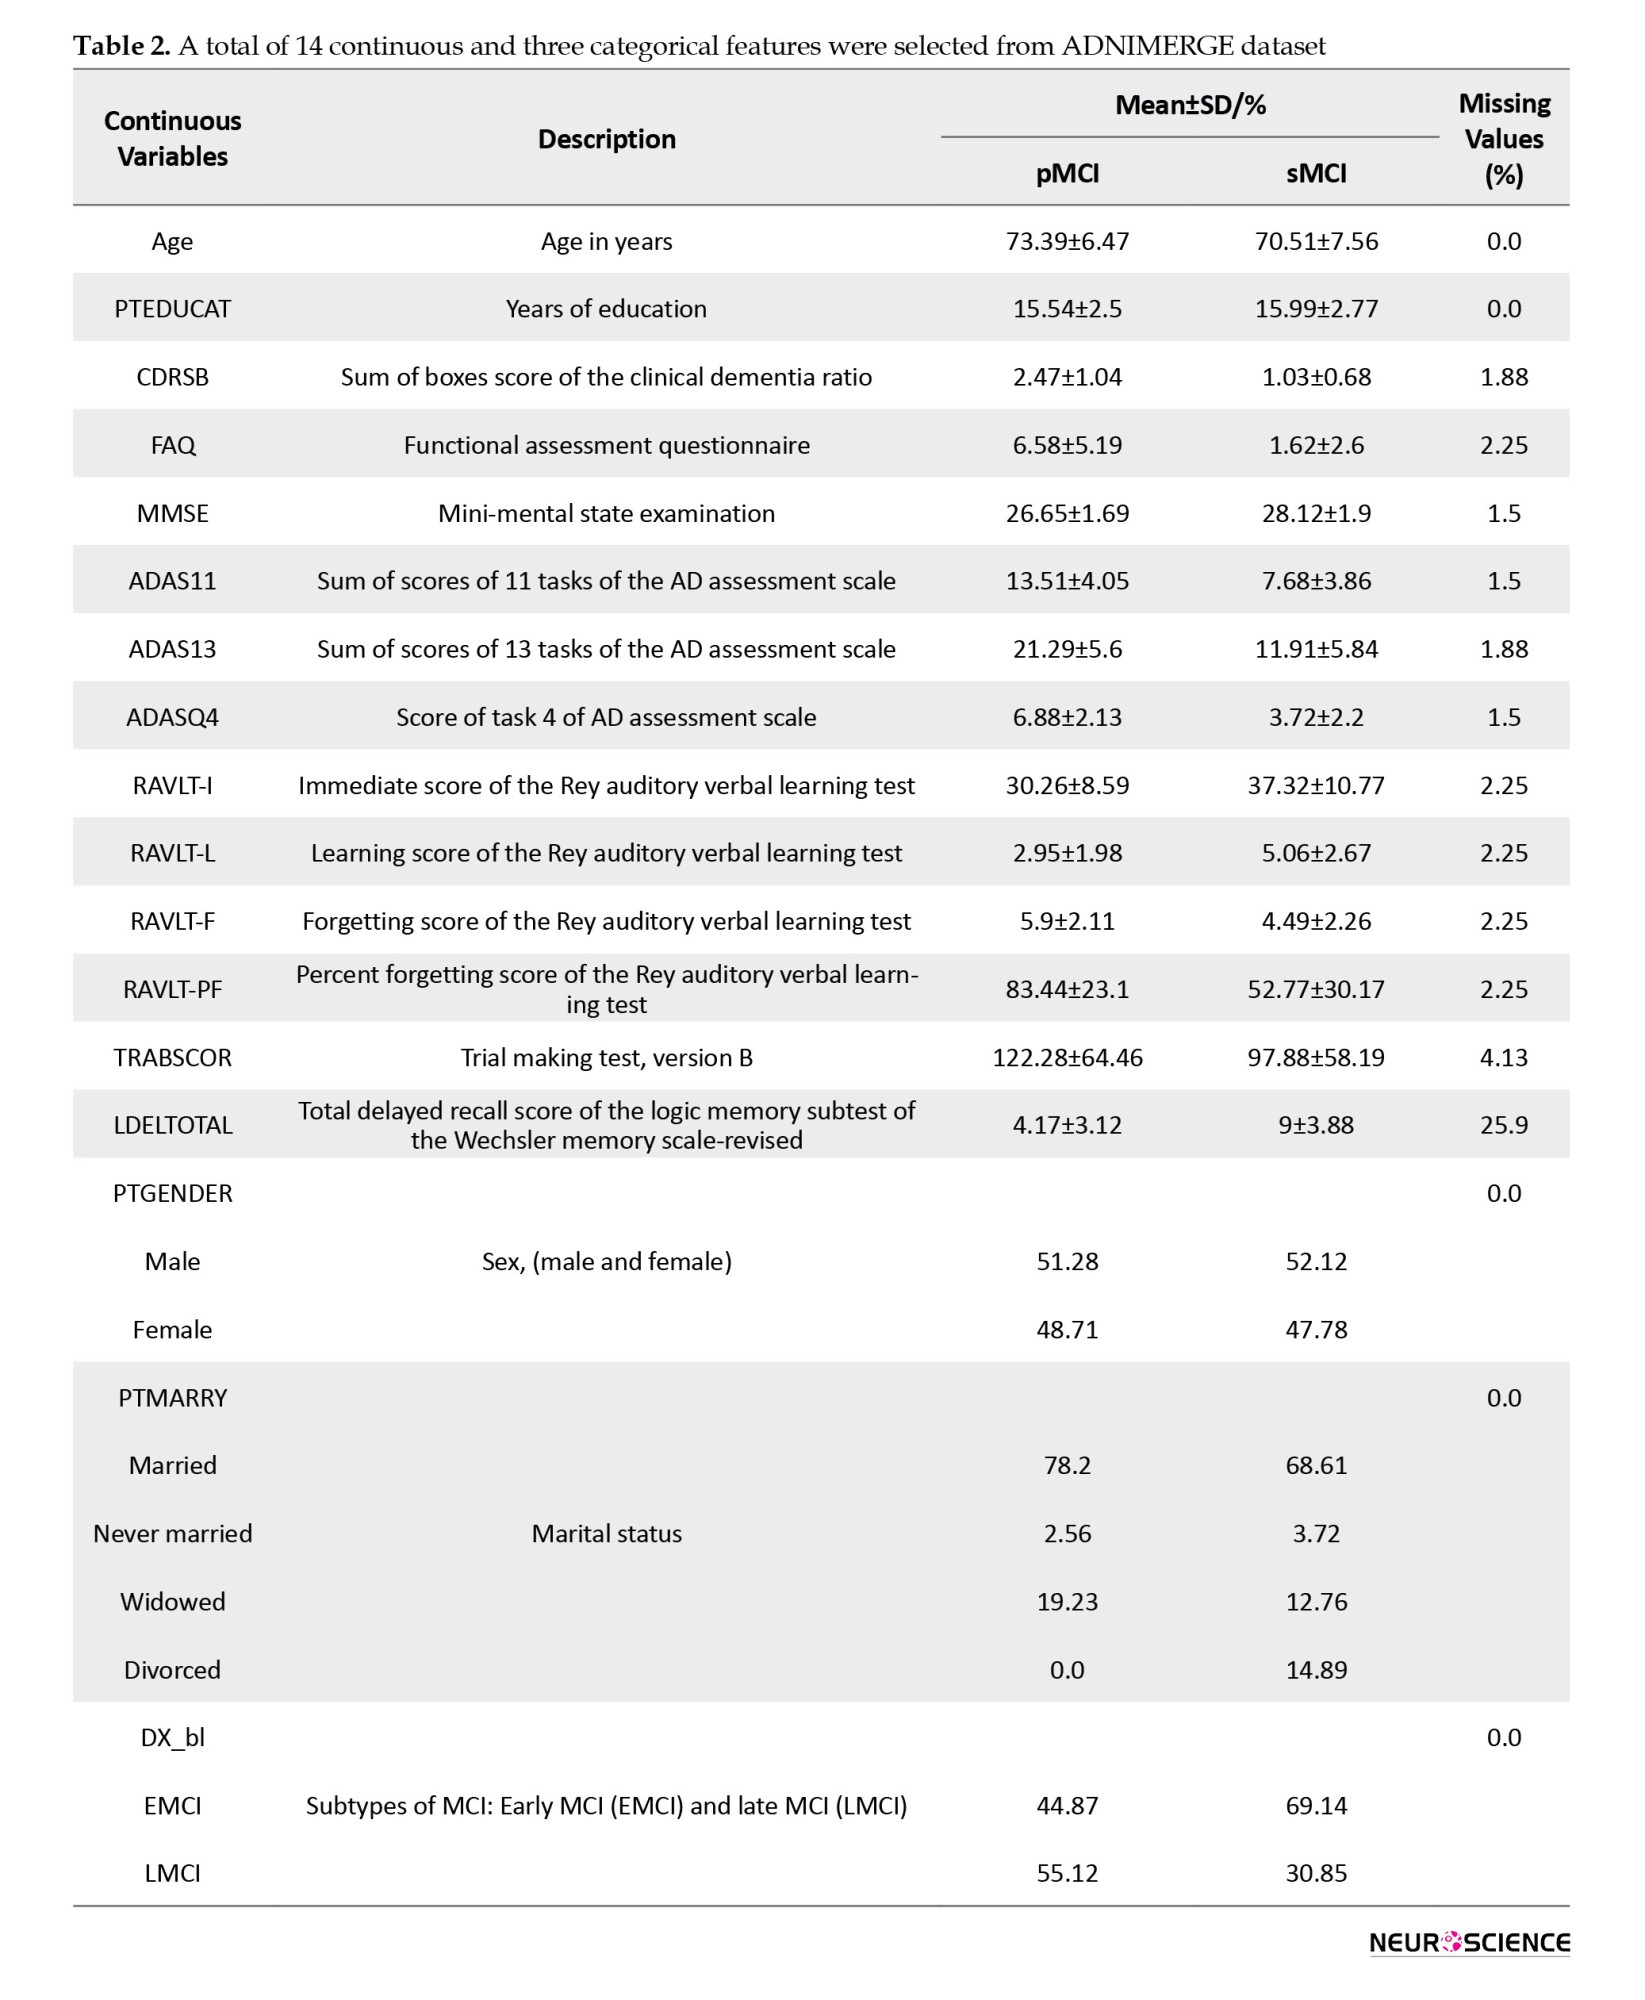
Tesla Phillips 3 Magnetic Resonance Imaging Scanner was used with echo planar image (EPI) to record functional and structural images while the participants were resting. The size of the functional image matrix was 64 by 64, and each 3D image of the brain volume was divided into 48 sections, each section being 3.3 mm, as well as an 80-degree rotation angle, a repetition time of three seconds, and a reflection time of 30 ms. Ultimately, 140 functional images were obtained for each participants. Moreover, we selected 17 clinical features from the ADNI database, including common demographic characteristics and cognitive neurophysiological test results. The AD neuroimaging initiative merge (ADNIMERGE) file, which the ADNI organization officially prepares, contains the essential variables of the data collected. Demographic information included age, gender, years of education, and marital status. Clinical cognitive tests are sum of boxes score of clinical dementia rate, functional activity questionnaire (FAQ), mini-mental state examination (MMSE), AD assessment scale (total of 11 activity scores [ADAS11]), ADAS13, ADASQ4, Rey auditory verbal learning test (RAVLT) scores (immediate [RAVLT-I], learning [RAVLT-L], forgetting [RAVLT-F], and percent-forgetting [RAVLT-PF]), trail making test version B (TRABSCOR) and the total delayed recall score of the logic memory subtest of the Wechsler memory scale-revised (LDELTOTAL) (Lynch et al., 2005; Chlebowski 2011; Salthouse 2011; Arevalo‐Rodriguez et al., 2015; Marshall et al., 2015; Fard et al., 2016; Kueper et al., 2018). We also examined the type of MCI in primary diagnosis (early or late). Dataset Details, reported in Table 2, show the names and abbreviations of the 17 clinical features, along with their statistics in the two groups.
Preprocessing
We first discarded the features, resulting in a loss of more than 5%. Therefore, the LDELTOTAL feature was discarded, while other clinical features were preserved. Then, we placed the missing values for the remaining features; we used the mean for numerical properties and the mode for categorical features (gender, marital status). We then normalized the numerical data and encoded the categorical features as one-hot vectors. Furthermore, we discarded the first ten measurements among the functional images recorded for each individual. Then, the following steps were performed to preprocess the images: Slice-timing correction to the last slice, realignment using a six-parameter rigid-body spatial transformation, EPI normalization, resampling to 3-mm isotropic voxels, detrending, smoothing using a Gaussian filter with FWHM (=4 mm), band-pass filtering (0.01–0.08 Hz) and elimination of destructive signals such as global mean signal, six head motion parameters, the CSF, and the white matter signals. Consequently, in the fMRI dataset, the original data dimensions were (64, 64, and 48) with a time dimension of 140. After the preprocessing step, the data dimensions were (61, 61, and 73) with a time dimension of 130. We used Python 3.8 to preprocess clinical features, SPM12, and the DPARSF toolbox to preprocess imaging data. Also, the clinical and imaging data values were normalized to be between zero and one.
CNN
A CNN is a DL model for processing data with a grid pattern, such as images. These networks are designed to learn spatial information and have three primary layers: Convolutional, pooling, and fully connected. The convolutional and pooling layers perform feature extraction, and the fully connected (dense) layer is the classification layer. This network can convert and reduce input data into a form that is easy to identify and examine without losing significant information. In the convolutional layer, a small matrix of numbers called a kernel is applied throughout the input by point multiplication to extract feature maps, which are then provided to a nonlinear activation function. Next, the pooling layer, which has no learnable parameters, down-sizes the results; for instance, the max-pooling layer, the most common type, retains the maximum value from each patch in a feature map and discards the remaining values. Finally, the last layers’ output is converted to a one-dimensional vector by a flatten layer and given to a (or more) fully connected layer. Each layer input is connected to the output by a learnable weight. Finally, in the output, we obtained the probability of belonging to each class for each case (Yamashita et al., 2018; Zhang et al., 2019).
LSTM
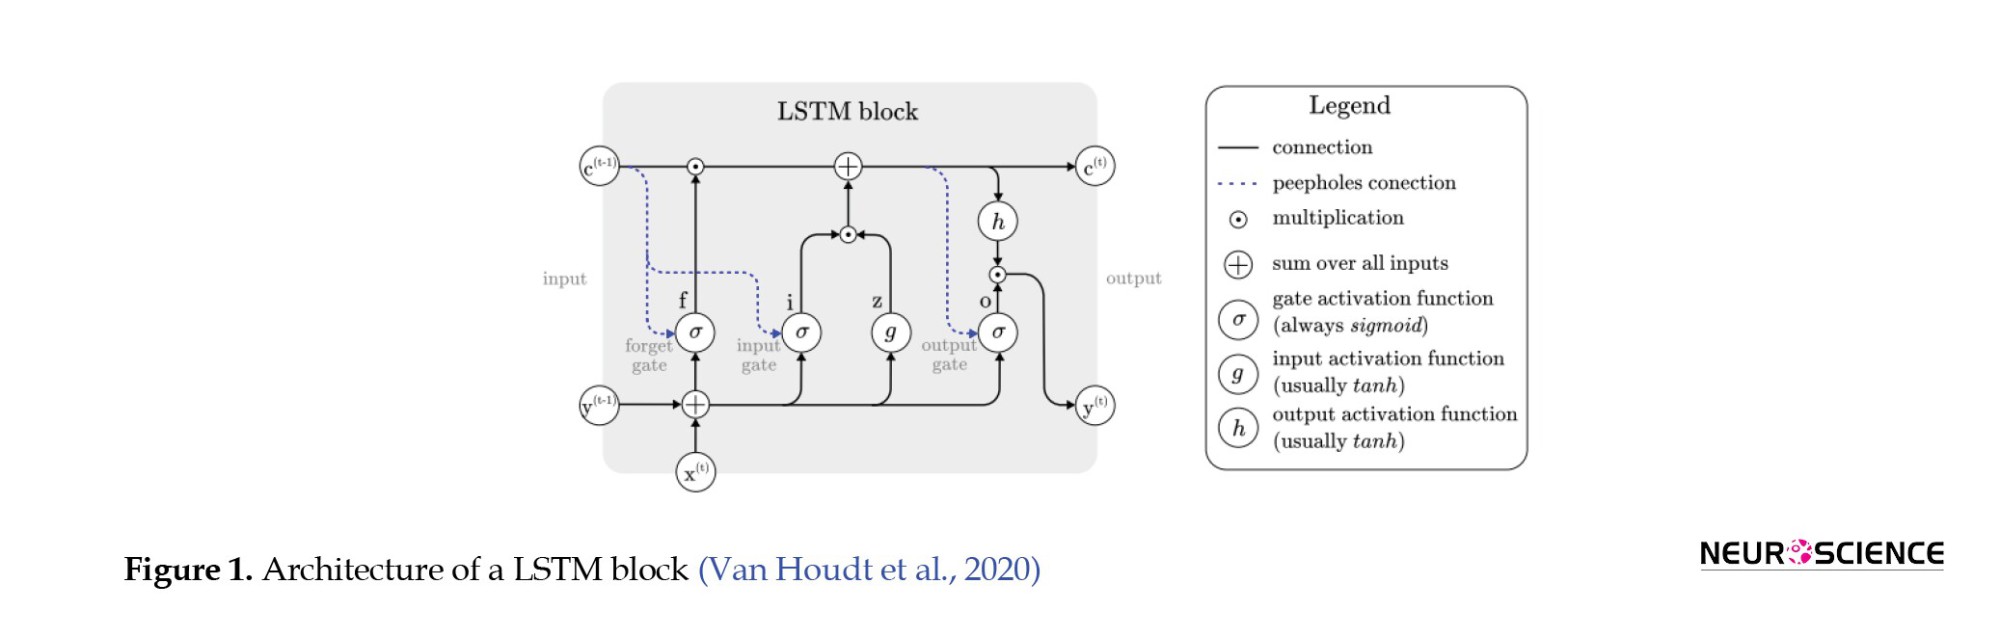
A LSTM network, a type of recurrent neural network, detects temporal dependencies in input data. In an LSTM network, at any time, the node receives its input, output, and hidden states from the previous time step. Then the output and the hidden state are delivered at their respective times. The hidden mode can be considered the LSTM’s node memory, which helps it remember input from previous time steps. Because the node structure is more complex than normal neuronal nodes, we call it a cell. This cell has four gates: Input, forget, output, and input modulation. Each gate has a weight to control how much information can pass through it, and the activation function determines that weight. Figure 1 shows the structure of an LSTM block and how it calculates its output (Zhang et al., 2019; Van Houdt et al., 2020).
Proposed model
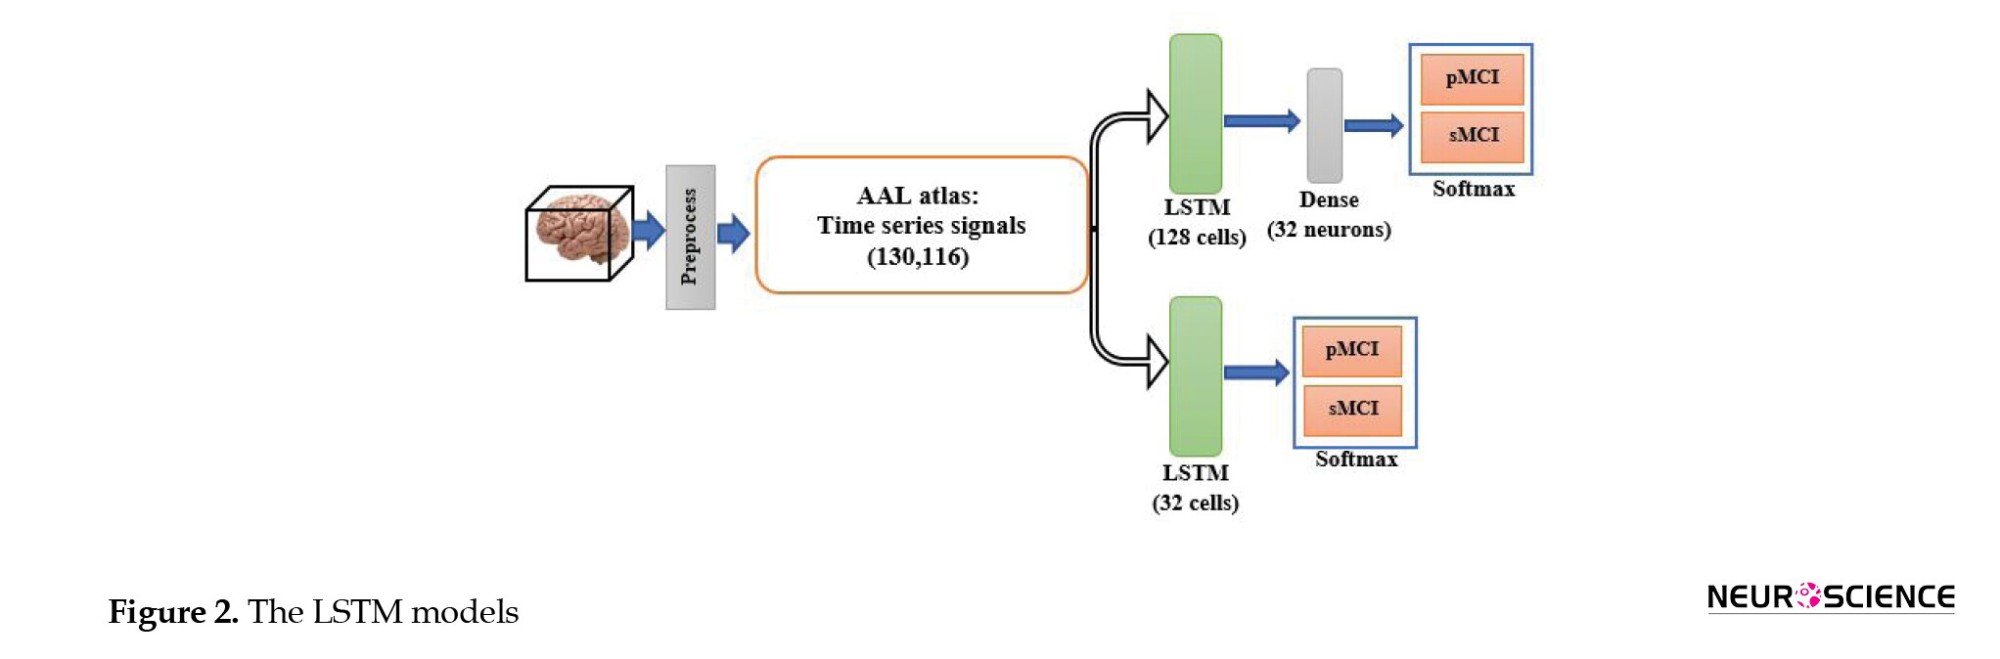
Functional MRI is a set of three-dimensional images recorded for a limited time. Therefore, CNN and LSTM models can be used to process the fMRI spatial and temporal aspects. To our knowledge, this is the first study to use DL methods for fMRI processing and to combine clinical information to predict MCI-to-AD conversion using the proposed method. First, we evaluated whether the temporal aspect alone provided sufficient discriminative information. Therefore, we used the automated anatomical atlas to define and divide the brain into 116 regions; thus, the LSTM network’s input was a 130-by-116 matrix (130 time points and 116 features). We designed two LSTM models with 32 and 128 cells to investigate the effect of the number of LSTM cells per layer on the model’s diagnostic performance. Since the output size of all models must have been the same and equal to 32, a fully connected layer with 32 neurons was added after the 128-cell layer. The outputs of both models were then fed into a dense layer with two neurons and a softmax activation function for classification. Figure 2 shows the LSTM model.
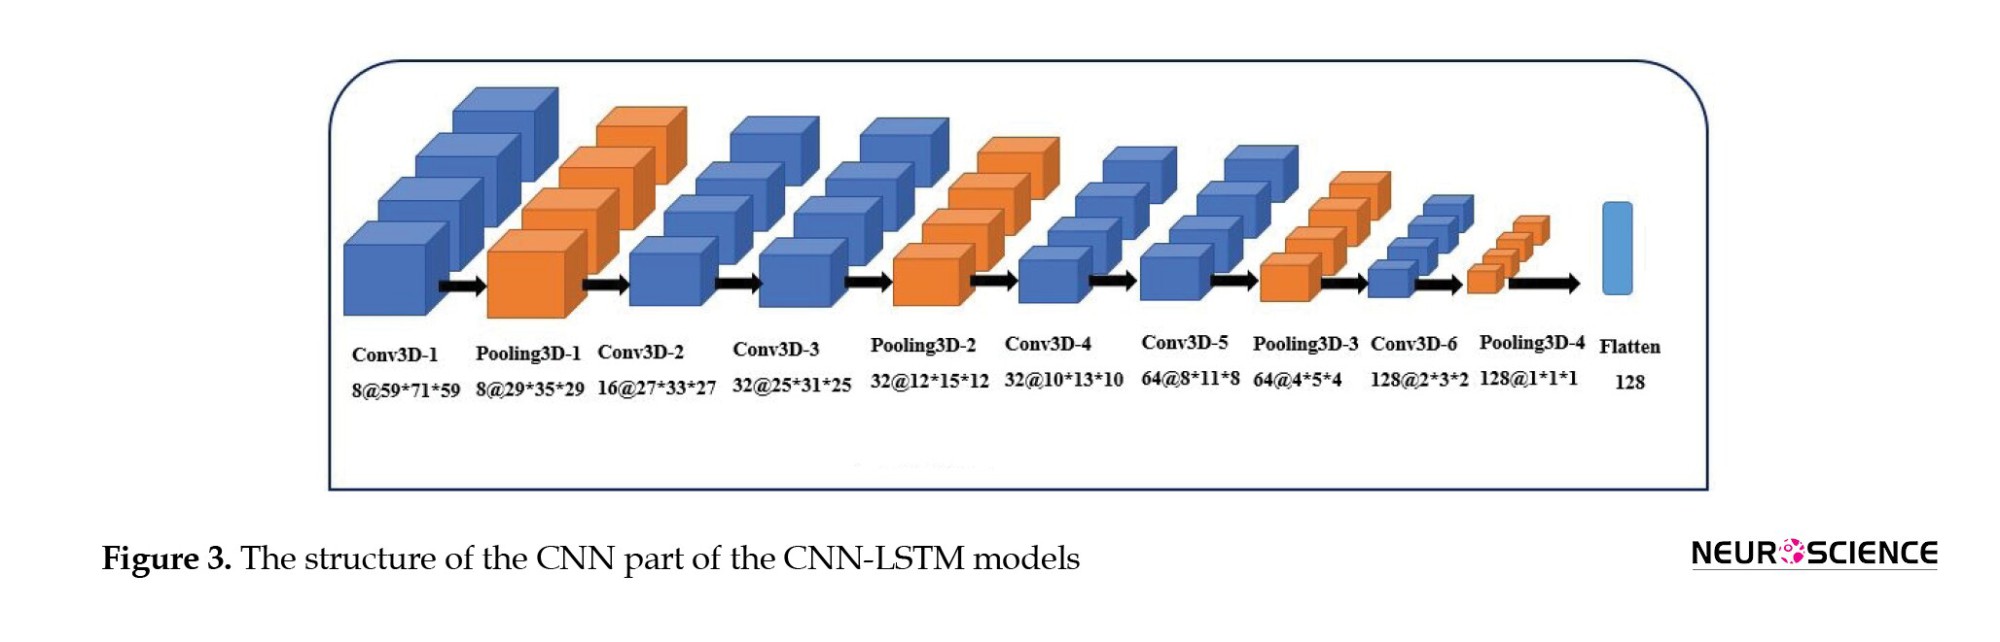
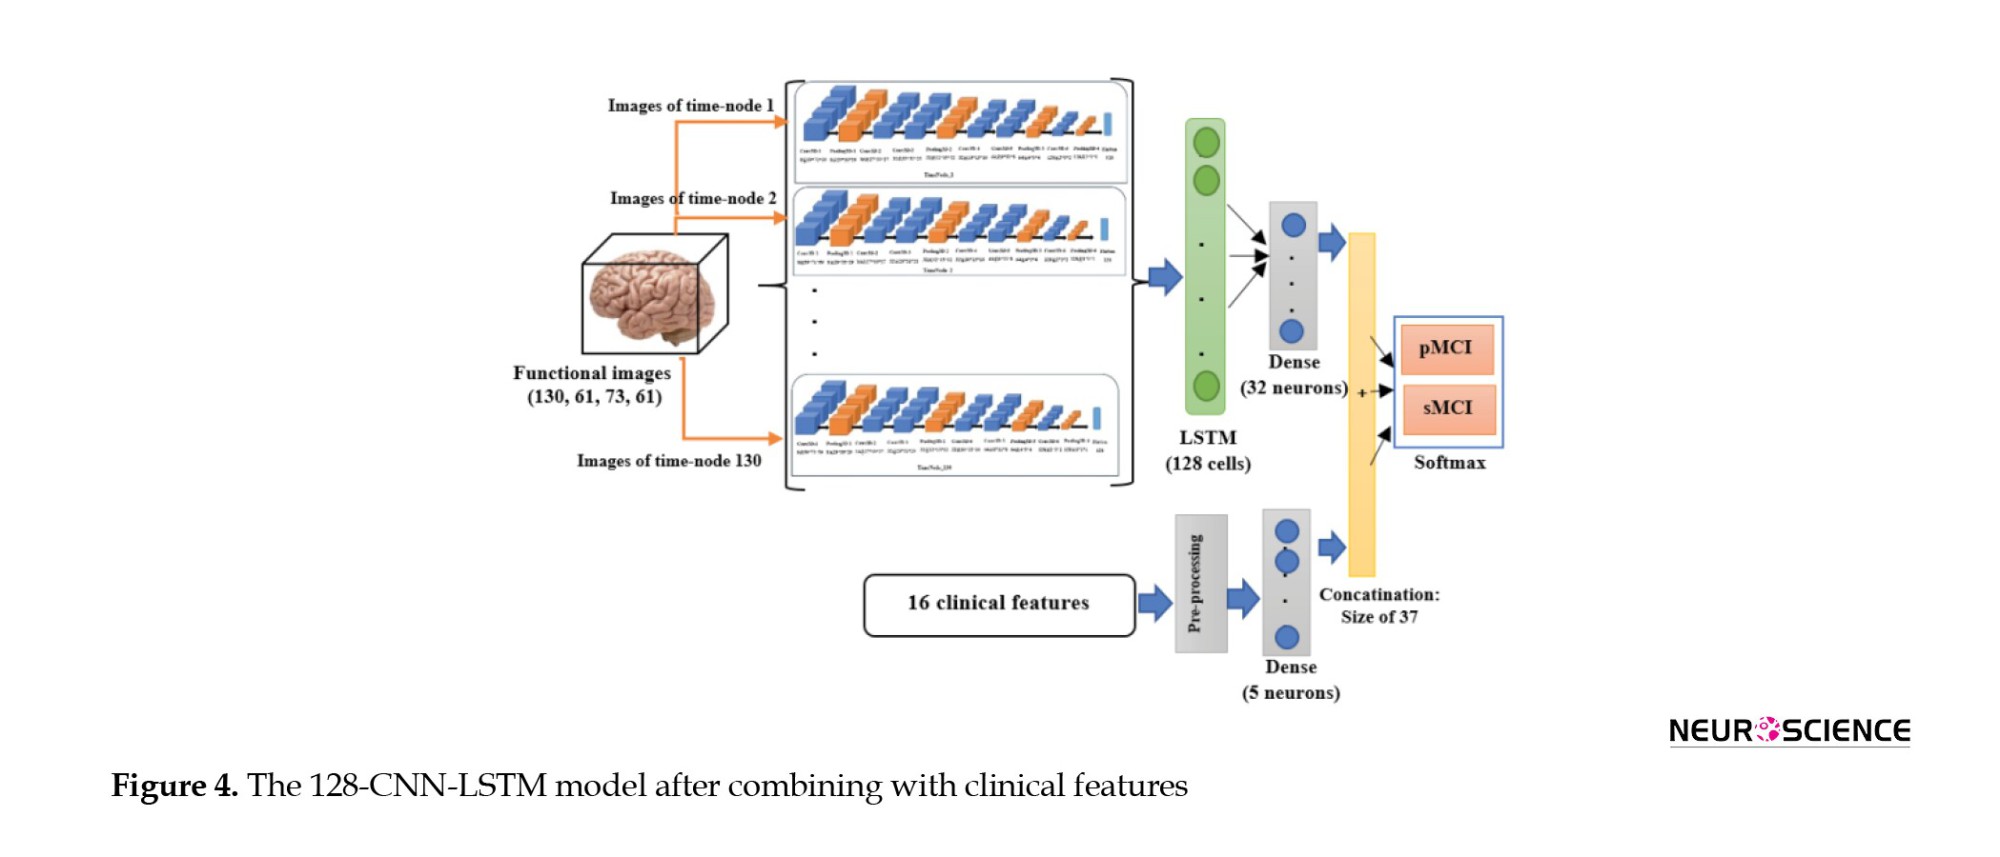
Second, when CNN and LSTM models are combined, the resulting model is called CNN-LSTM, composed of a CNN part to extract spatial features, followed by an LSTM layer to extract temporal information. Figure 3 illustrates the structure of the CNN part of the CNN-LSTM models. The convolutional part of our proposed model was three-dimensional to prevent initial information loss due to data transformation. It consisted of six convolutional layers, with a filter size of 3×3 and a stride of one, and four max-pooling layers with a filter size of 2×2 and a stride of two. The input of this network was single functional images (regardless of the time dimension). The output of the last layer was 128 extracted features. Since 130 images were available for each sample, we utilized 130 3D-CNN models, each analyzing images from a specific time point, and concatenated their outputs to feed an LSTM layer (Figure 4). We designed two CNN-LSTM models since we previously designed two LSTM models.
Moreover, to investigate the effect of combining clinical data on the results, in all these final models, the 32-element output of the imaging section was concatenated with the output of a shallow neural network layer whose input was clinical data. The dense layer had five neurons; thus, the effect of the image features was about six times greater than that of the clinical features. Consequently, a 37-size vector was inserted into the classification layer. Finally, eight networks were developed (two LSTM and two CNN-LSTM models with and without combining with the clinical information). Figure 4 shows the CNN-LSTM model with 128 LSTM cells, combined with clinical information.
The models were designed in Google Colaboratory (12 GB RAM) using the Keras framework with Tensorflow as the backend. The Adam optimizer was used to train the CNN-LSTM models with a learning rate of 0.0001. To control overfitting, dropout was used; its value was 20% for the inner layers (except the first layer) and the LSTM layer (32 cells), 30% for the last pooling, and 40% for the 128-cell LSTM layer. Also, L2 regulation was used for the dense layers (32 and 5 neurons) with a coefficient of 0.001. Due to hardware limitations, the data were delivered to the model in batches, with a maximum of three for the CNN-LSTM models.
Training and evaluation
We trained and tested our models using 5-fold stratified cross-validation (CV). In this method (Schaffer 1993), the dataset is divided into five folds; four for training, and one for testing. The folds could be stratified, meaning that the ratio of each class (sMCI, pMCI) is nearly equal across folds and the whole dataset. Our training and test sets needed to be independent. Therefore, we randomly divided all the data into five parts, each containing about 20% of the data, and ensured that the parts were independent across patients; in other words, samples from the same subject were assigned to the same set. In our dataset, several samples were available for each participant. Also, we attempted to ensure that 30% of the samples in each set belonged to class one. Consequently, we had 81 subjects: 28 in the pMCI class, and 53 in the sMCI class. A total of 266 samples from these individuals were available, of which 78 belonged to the pMCI class and the remaining 188 to the sMCI class. In 5-fold CV, in testing, approximately 16 subjects (5 pMCI and 11 sMCI) and 53 samples (15 pMCI and 38 sMCI) are used per fold. Eventually, five training and testing subsets were produced, and all models were trained on each training set and evaluated on its corresponding test set. Also, we reserved 10% of each training set for evaluation to assess the appropriateness of the models’ design during training. Thus, we had five sets of training, testing, and evaluation, with ratios of 70%, 20%, and 10%, respectively. Notably, clinical data preprocessing for the training and test sets was performed separately to preserve the independence of the two sets. Finally, to report and compare the performance of the models, the evaluation metrics of accuracy, sensitivity, specificity, area under the receiver operating characteristic (ROC) curve (AUC), and confusion matrix were calculated across the five test sets.
Results
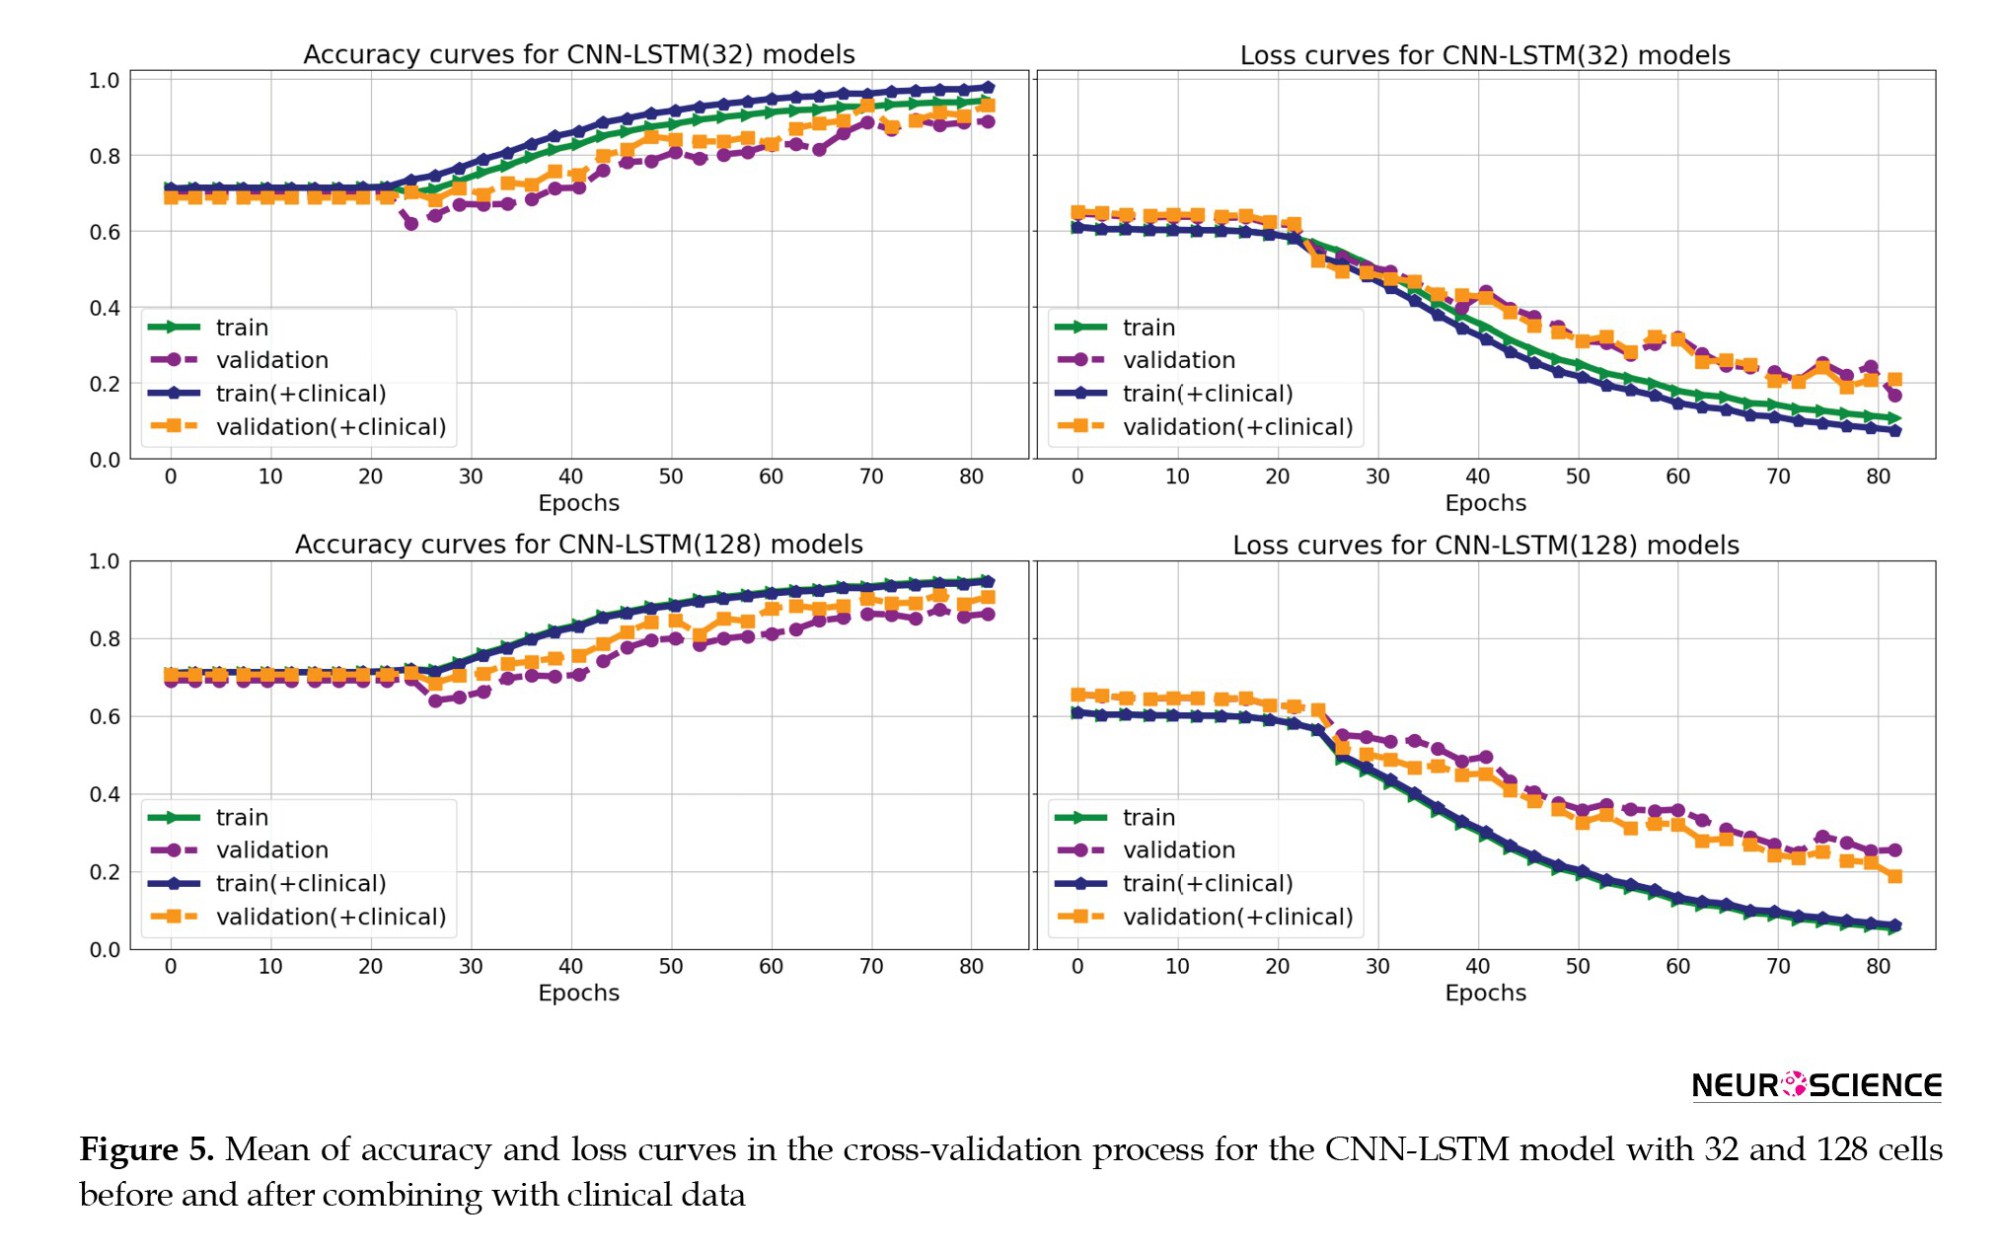
Figure 5 shows the mean accuracy and loss curves in the 5-fold CV training procedure of the CNN-LSTM models for the training and validation sets in four models (CNN-LSTM models with 32 and 128 cells and before and after combining with the clinical data). The models were trained for approximately 80 iterations. We optimized the model architecture and hyperparameters by trial and error, examining learning progress based on validation and training metrics to avoid overfitting.
The Mean±SD values of accuracy, sensitivity, specificity, and AUC metrics for the five test subsets are reported for eight models (LSTM models with 32 and 128 cells, CNN-LSTM networks with 32 and 128 cells, before and after combining with clinical data) in Table 3.
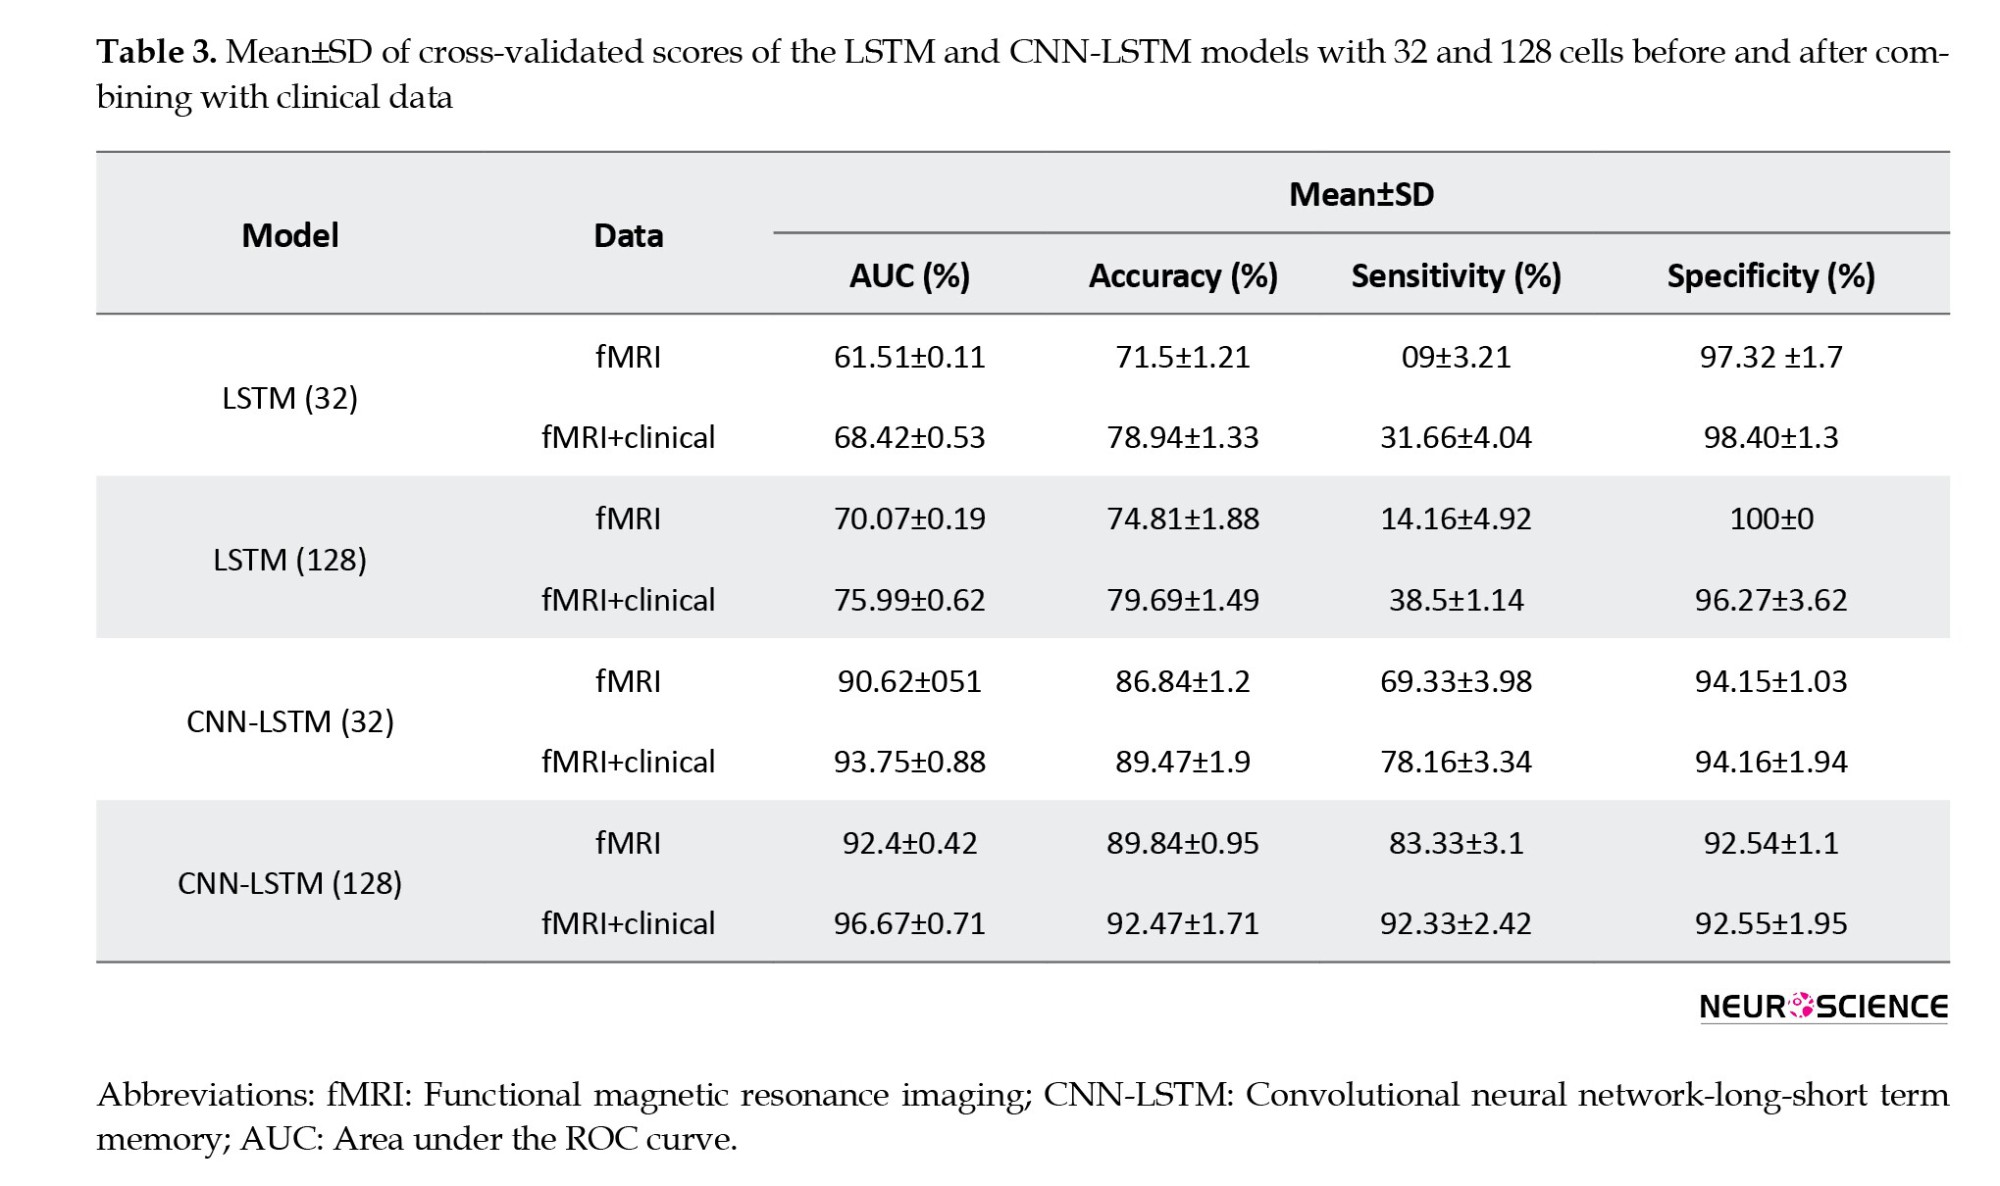
The evaluation values for the 32-cell LSTM network before combining with clinical features were 71.8% (accuracy), 9.00% (sensitivity), 97.32% (specificity), and 61.51% (AUC). In this model, we observed an increase in accuracy (78.94%), sensitivity (31.66%), specificity (98.4%), and AUC (68.42%) after combining with clinical information. In the next step, by increasing the LSTM model’s cell account to 128 before combining with clinical data, the accuracy, sensitivity, specificity, and AUC increased to 74.81%, 14.16%, 100%, and 70.07%, respectively. Finally, the 128-cell LSTM model, in combination with the clinical data, achieved the best performance among the LSTM models, with AUC (75.99%), accuracy (79.60%), and sensitivity (38.5%). For the CNN-LSTM networks, we also observed that increasing the number of recurrent layer cells improved results. The validation metrics for the 32-cell CNN-LSTM model before combining with clinical, were 86.84% (accuracy), 69.33% (sensitivity), 94.15% (specificity), and 90.62% (AUC). Then, by increasing the number of cells to 128, we observed improvements in accuracy (89.84%), sensitivity (83.33%), specificity (92.54%), and AUC (92.4%). As with the CNN-LSTM models, we also observed increased evaluation parameter values after adding clinical features, and both models achieved higher sensitivity, accuracy, and AUC. Finally, the 128-cell CNN-LSTM model achieved the best results when combined with the clinical data. It reached 92.47 % accuracy, 96.67% AUC, 92.33% sensitivity, and 92.55% specificity.
Figure 6 shows the ROC and AUC diagrams of the LSTM and CNN-LSTM models with 32 and 128 cells before and after combining with clinical data.
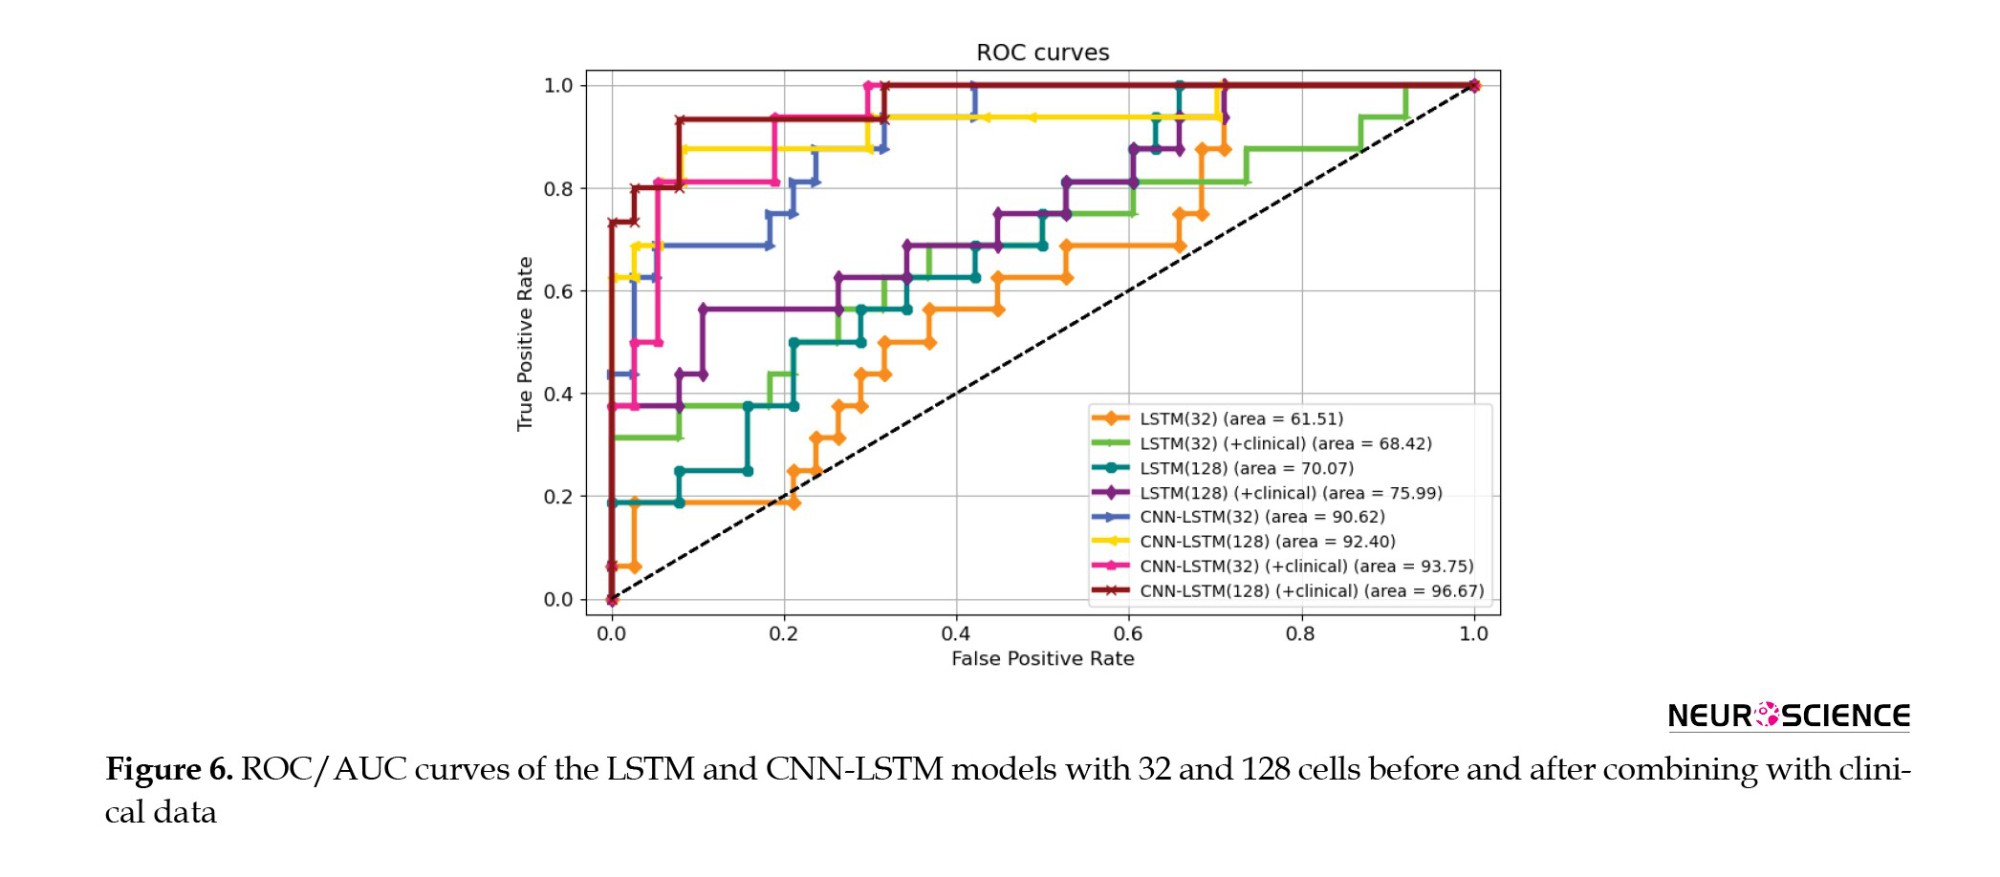
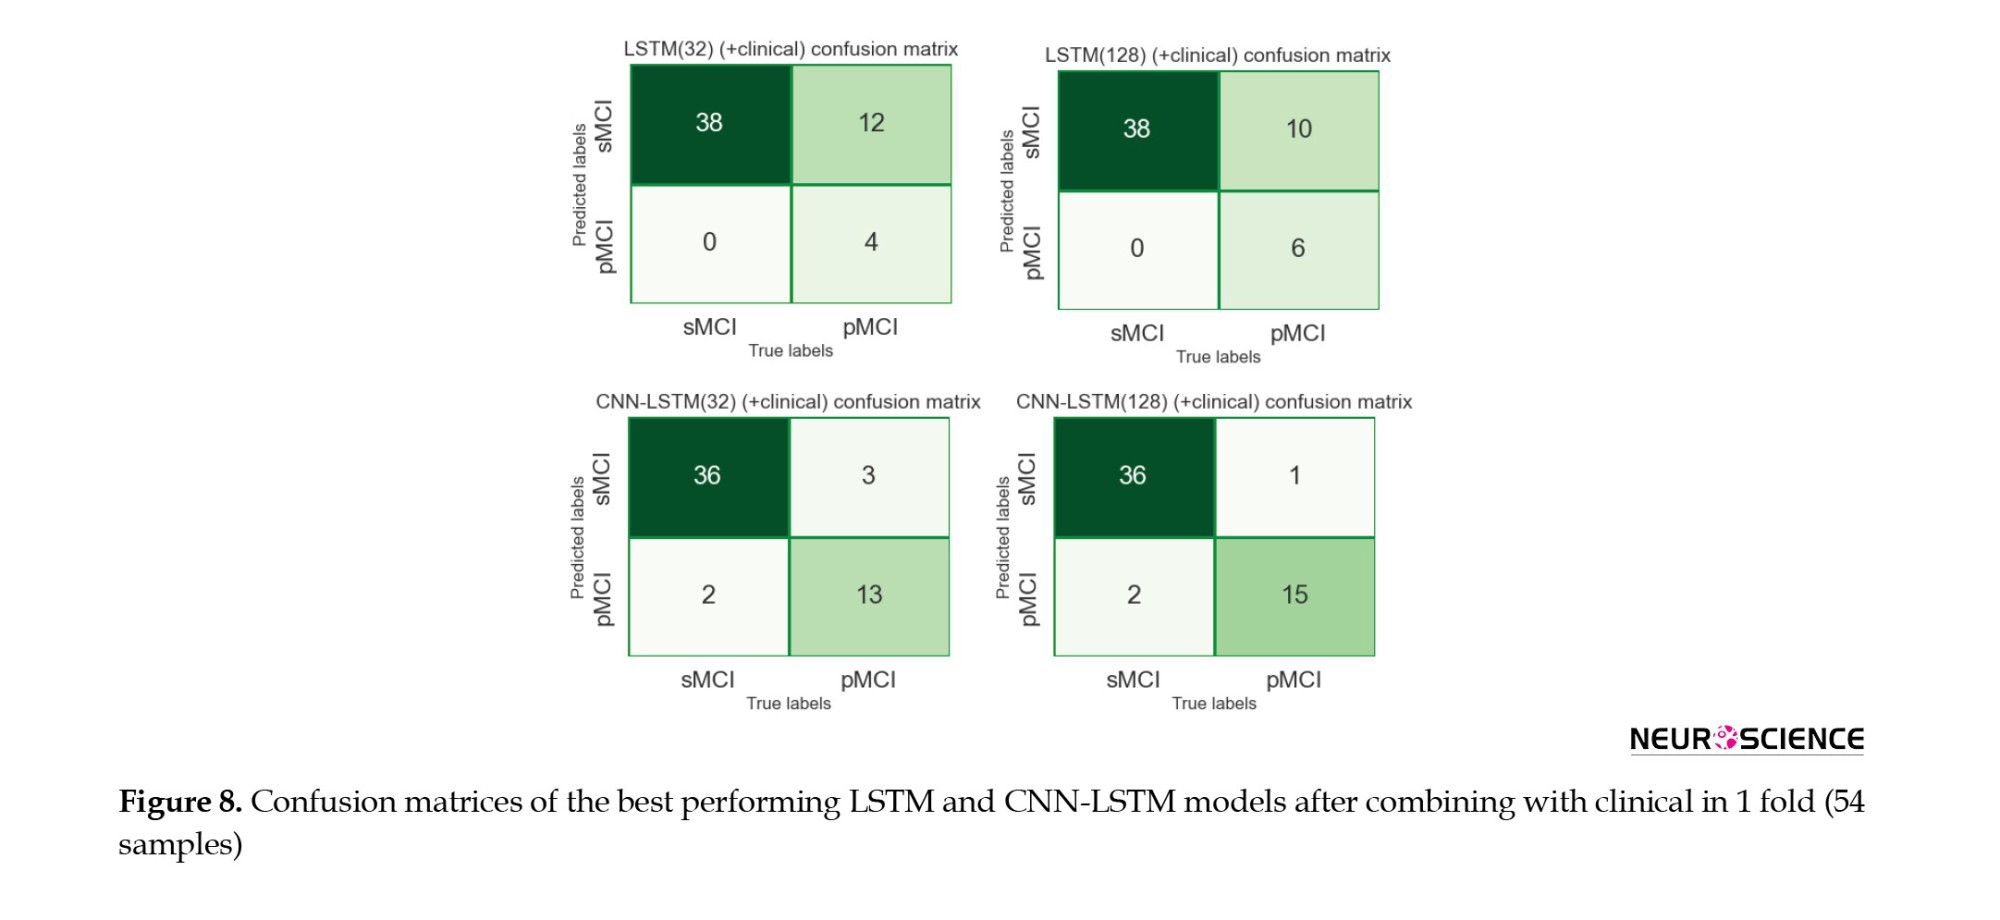
The 128-cell CNN-LSTM model, combining fMRI and clinical data, demonstrated the best results. Also, it is shown and concluded that the combination with the clinical predictors made the models more sensitive to the pMCI class since the curves started from points with higher true-positive rates. Finally, Figures 7 and 8 show confusion metrics of the best-performing LSTM and CNN-LSTM models (before adding clinical information) and (after adding clinical information).
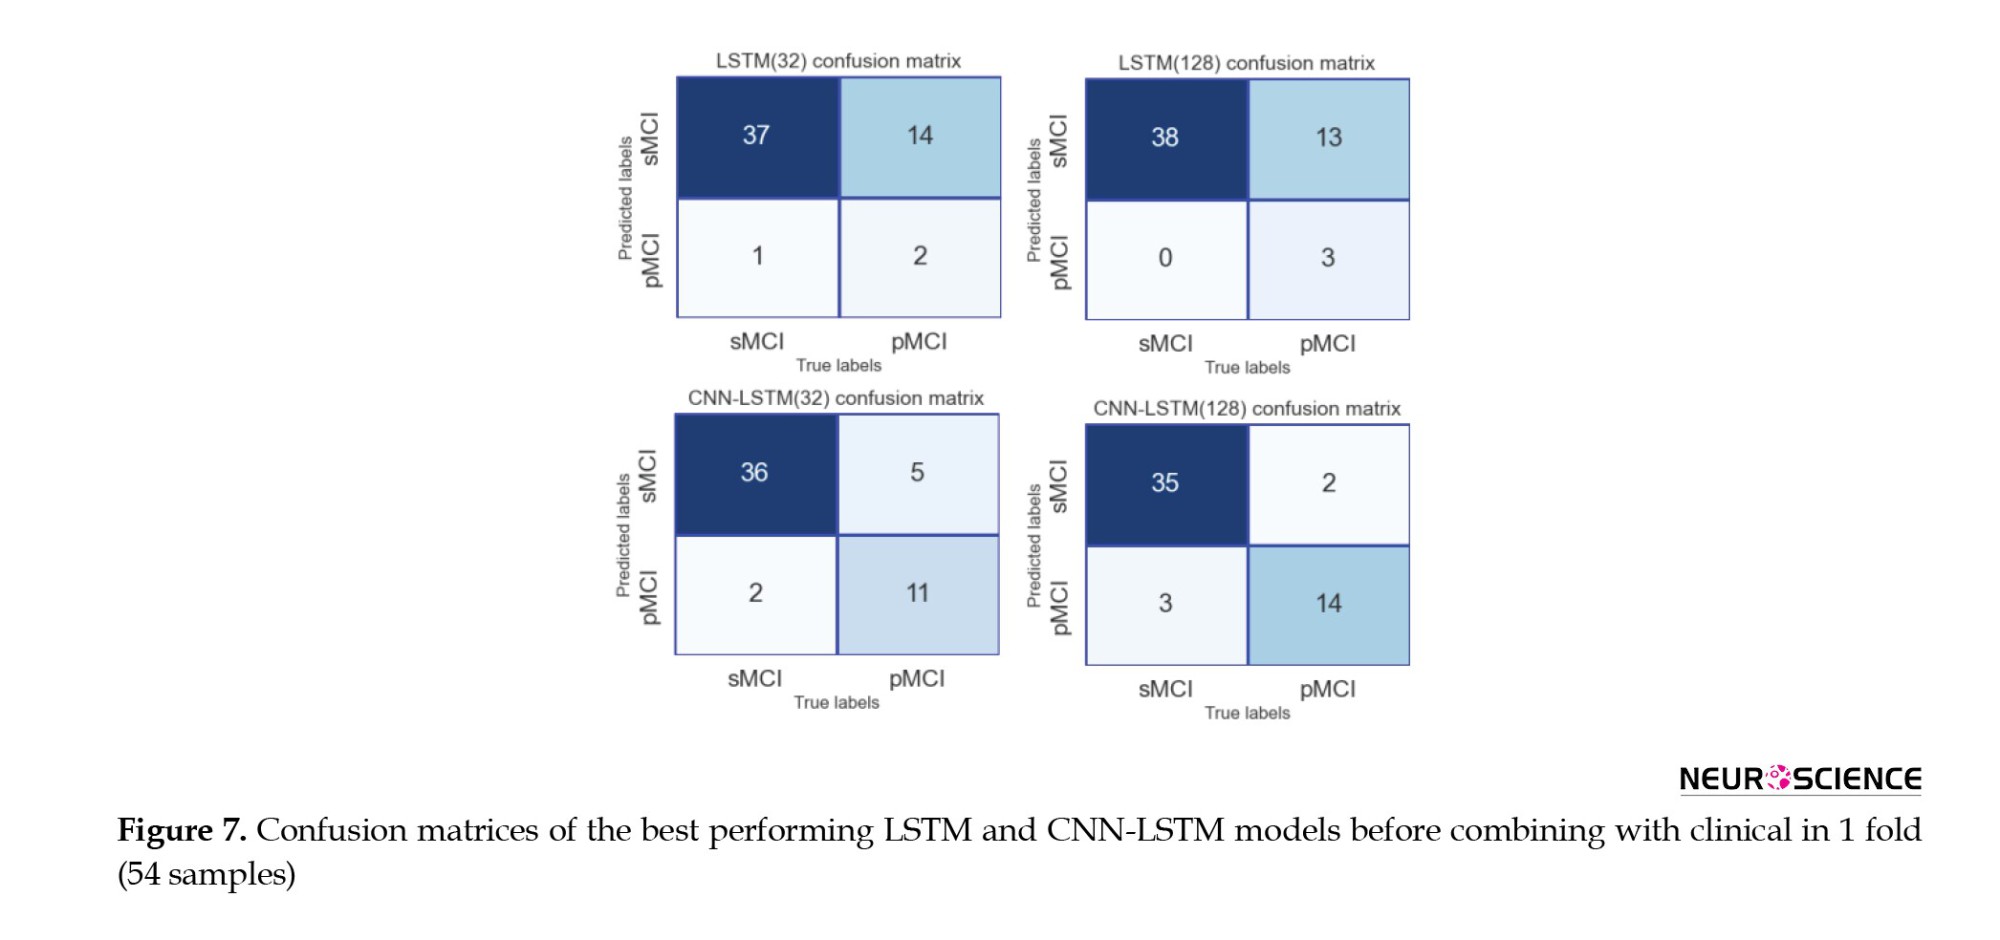
It is also illustrated that combining with clinical data increased the true-positive rates while decreasing false-negative rates, meaning that the models became more sensitive toward the pMCI cases after combining clinical attributes. Lastly, according to the confusion matrices, the 128-cell CNN-LSTM models were the only networks with more false-positive rates than false-negative rates. After combining with clinical data, this model misdiagnosed only three samples from about 50 test set cases. It is worth noting that a false-positive rate higher than a false-negative rate is desirable, especially in medical issues, since incorrectly diagnosing a patient as unwell is less medically expensive than the other way around.
Discussion
This study evaluated and compared the performance of DL techniques in diagnosing the conversion of MCI to Alzheimer’s over an average of five years. We used rs-fMRI, neurophysiological test results, and common demographic characteristics as noninvasive, clinically available predictors. Our primary focus was to extract appropriate, sufficient features from the imaging data and then improve the results by combining them with clinical information. Since fMRI data are a series of 3D images recorded over a limited time, it would make sense to use a 3D CNN to extract their spatial features, followed by an LSTM layer to learn their temporal information, resulting in a CNN-LSTM network. Also, to confirm that studying both spatial and temporal aspects of fMRI was required to achieve good results, LSTM models were separately trained for comparison. According to the results (Table 3), considering both aspects of the information contained in fMRI undoubtedly enhanced the performance. We also observed that the number of cells in the LSTM layers affected model performance. According to AUC and accuracy metrics, an improvement was observed when increasing the number of cells from 32 to 128. Finally, after combining with clinical information, the CNN-LSTM model with 128-cell outperformed other models based on an AUC of 96.67%, an accuracy of 92.47%, a sensitivity of 92.33%, and a specificity of 92.55%.
Among the results from all models (Table 3), the LSTM networks performed poorly compared to the CNN-LSTM models, suggesting that the LSTM did not extract suitable features from fMRI. This could be due to several factors. First, the structure of LSTM might not have been adequate. We tried to maintain consistency in our work; therefore, by deleting the CNN parts from the proposed CNN-LSTM models, we obtained our LSTM models. As a result, LSTM models with more layers, different numbers of units, and different structural architectures could achieve better performance. Second, it could be because of the atlas we used; other atlases divide the brain into different regions and provide us with more and different time series. One last possible factor is the type of fMRI used here, which was a resting-state rather than a task-related one. Given that LSTM is mainly concentrated on temporal details rather than spatial ones, it could be pointed out that resting-state form contains less valuable temporal data than task-related fMRI; thus, apparently, not much information was provided here. Therefore, we deduced that the spatial aspect of the fMRI data played a pivotal role in the diagnostic abilities of the models.
We have designed our models based on the characteristics extracted from a combination of imaging data and clinically available noninvasive information. In all of these final models, the output of the imaging section (32 in length) was connected to the output of a 5-neuron dense layer (clinical), delivering a vector containing 37 elements to the classification layer. All four models performed better than their basic form when combined with clinical information. Because the models had more information to make decisions, their final results improved. It was also observed that integrating clinical data with imaging increased the sensitivity of the models to class one (Table 3, Figure 6, and Figure 7). Finally, we observed that the proposed method for the combination affected two critical issues: First, the models reached the appropriate results faster (based on the performance of the models on the evaluation data) because, the model had more information to identify. Second, it could have led to overfitting if the number of neurons in the clinical layer increased or the training process lasted longer.
Many studies have attempted to solve the problem of predicting AD among patients with MCI. Even though some studies provided machine learning techniques with a good level of accuracy, the data used by their algorithms was a combination of invasive data, which makes the proposed methods less applicable in real life. Table 4 summarizes the articles that predicted conversion from MCI to AD. As mentioned in this table and in a review of studies using neuroimaging biomarkers for AD prediction (Valizadeh et al., 2025; Zarei et al., 2025), MRI, fMRI, and PET are the most commonly used modalities.
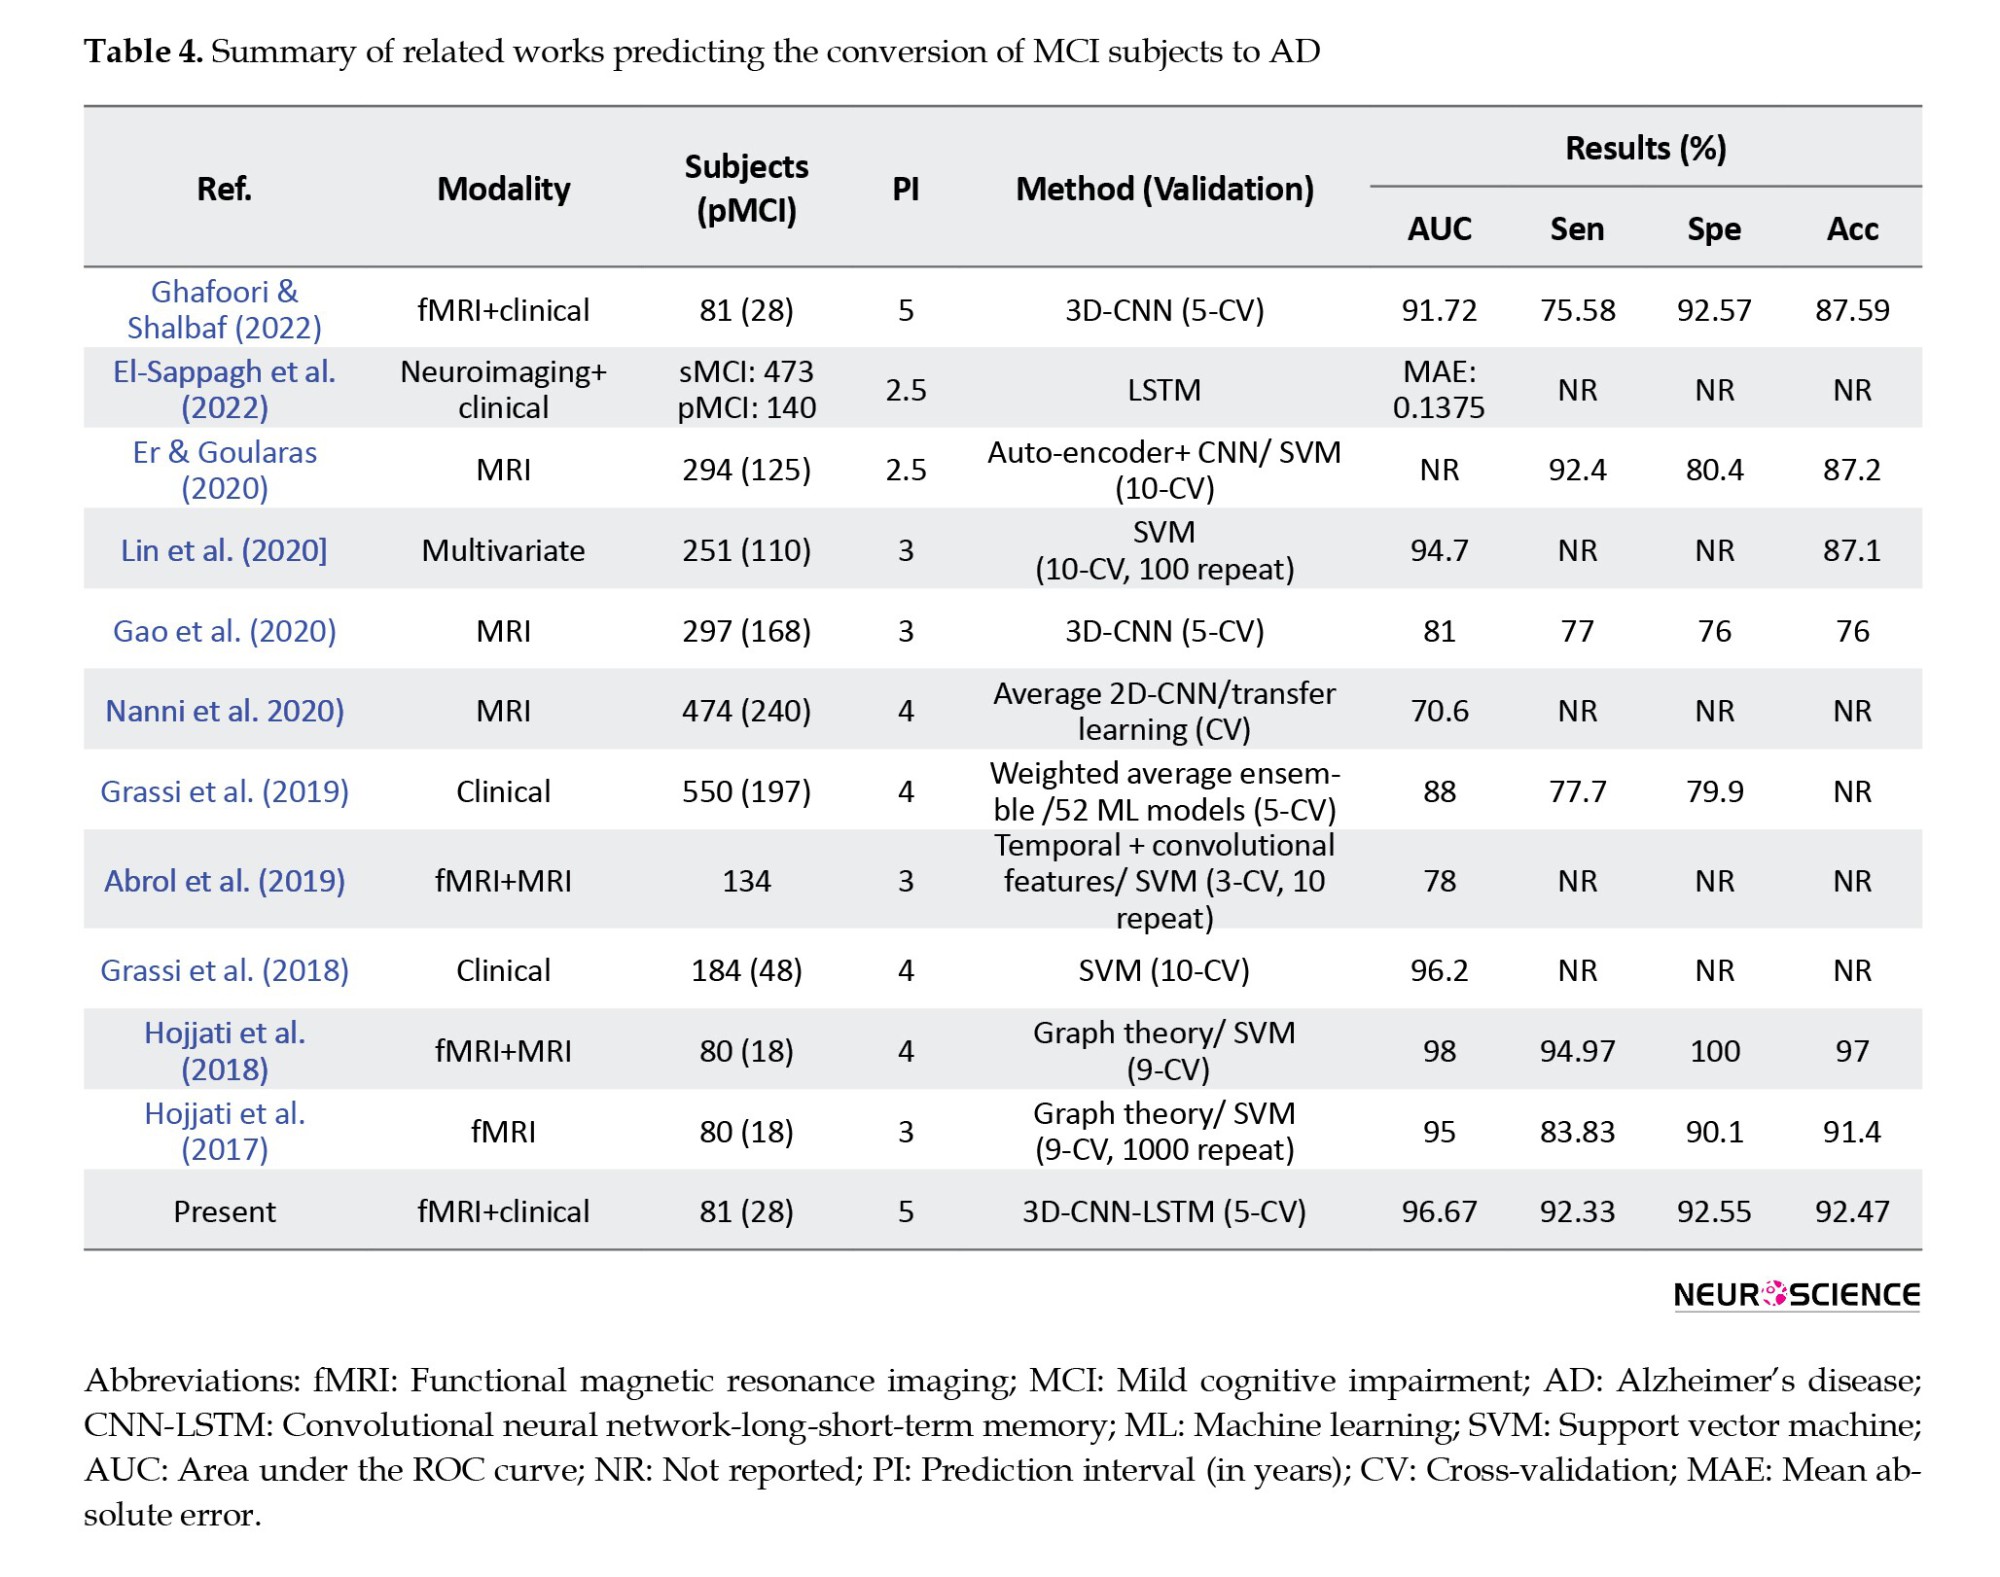
CNNs from DL and SVMs from machine learning were the most common algorithms, with CNN-based models achieving higher average performance than other techniques. All articles similar to the present article used CV for training and evaluation, and the values of accuracy, AUC, sensitivity, and specificity are reported in the table. Also, in reviewing the articles, one should pay attention to the number of folds in the CV method, prediction interval (in years), and the number of pMCI samples. For example, in articles (Hojjati et al., 2017; Hojjati et al., 2018), data from 80 people were used; 18 of them belonged to the pMCI class, and in the CV method, the data were divided into nine parts. Finally, a two-stage framework for AD progression detection is proposed. In the first stage, a multiclass classification task is used to diagnose a patient in three classes (cognitively normal, MCI, or AD) by LSTM with an accuracy of 93.87%. In the second stage, a regression task is used to predict the exact conversion time for patients with MCI. In the regression stage, the LSTM model achieved the best results with mean absolute error of 0.1375.
Our proposed method has some advantages and limitations compared to existing research. The clinical cognitive tests used in the present study are the most attainable and noninvasive data types that are regularly registered for a basic diagnosis before any further assessments. However, the information provided from different exams has overlaps, and patients could get weary of taking all 12 tests. Although fMRI has advantages over other imaging methods, it is time-consuming and motion-sensitive, which can be inconvenient. Another essential point is that this study’s Alzheimer’s prediction time interval was an average of five years. In other studies, the prediction time was between three and four years, and we know that the prediction operation is more difficult with increasing prediction time. Also, due to the data imbalance and the fact that most samples belonged to the sMCI class, the models tended to this class by default. As a result, simple models were not responsive, and reliable outputs were not delivered, making it challenging to design a suitable model. Finally, to the best of our knowledge, DL methods for processing functional images and combining them with clinical data to predict AD have not been studied. The advantage of using deep neural networks in image analysis, such as fMRI, is that the image structure remains intact. Compared to conventional machine learning methods, deep neural networks can automatically analyze raw data, extract features, and classify data. Thus, no information is lost at first, and then, depending on the architecture of the designed model, the relevant features are provided. In this research, we aimed to design a DL model that converted a volume into 128 single attributes while losing as little information as possible. Therefore, one of the main reasons CNN-LSTM outperforms other machine learning techniques in processing fMRI data is that we do not need to preprocess the data before feeding it to the model. Thus, the data structure is preserved, while it is not the case for machine learning methods. It should be noted that deep neural networks are complex and computationally intensive and require robust hardware to train. Overall, DL methods require more potent hardware, more time, experience, and careful attention to precision to be designed and trained without overfitting or underfitting. Also, adjusting the rising number of hyperparameters in DL models is challenging since they are closely affected by each another. Nevertheless, we wanted to explore their utility and performance to our advantage due to their novelty and potential.
Despite the promising results presented here, several other structures can be designed for the LSTM and the CNN-LSTM models in future studies. The changes that can be considered include the number of LSTM layers, the number of cells, and the type of recurrent layer, and changing it to a gated recurrent unit neural network. Furthermore, according to the atlas data, other independent structures can be designed for the recurrent model. It is also recommended that models be designed and evaluated on a wider range of test and training samples. In addition, it is suggested that transfer learning methods be used in the design of the CNN model, and especially the CNN-LSTM model, to check the possibility of improving the results with these techniques. Lastly, it may be feasible to use a subset of carefully selected clinical features to either generate better results or provide greater patient comfort by reducing the time spent on clinical tests.
Conclusion
In the present study, a 3D-CNN-LSTM algorithm was developed that was highly sensitive in correctly identifying MCI patients who may develop AD between six months and an average of five years. We have shown that combining clinical data with fMRI based on the proposed approach yields better results. We also showed that processing both spatial and temporal aspects of rs-fMRI data is crucial for achieving decent outcomes. Finally, our model outperformed other ML methods based on AUC (96.67%), accuracy (92.47%), sensitivity (92.33%), and specificity (92.55%), and can be used for initial clinical diagnosis.
Ethical Considerations
Compliance with ethical guidelines
All procedures performed in studies involving human participants were in accordance with the ethical standards of the institutional and/or national research committee and with the 1964 Helsinki Declaration and its later amendments, or with comparable ethical standards. Informed consent was obtained from all the participants included in the study.
Funding
This research was financially supported by Shahid Beheshti University of Medical Sciences, Tehran, Iran (Grant No.: 43014246).
Authors' contributions
All authors contributed equally to the conception and design of the study, data collection and analysis, interception of the results and drafting of the manuscript. Each author approved the final version of the manuscript for submission.
Conflict of interest
The authors declared no conflict of interest.
Acknowledgments
The authors appreciate the support of Shahid Beheshti University of Medical Sciences, Tehran, Iran.
References
Alzheimer’s disease (AD) is the most common cause of dementia in old age and causes irreversible damage to the brain. However, if implemented early in the disease, proven treatments could be practical and help weaken the process by stopping or slowing the destruction of brain tissue (Weller & Budson, 2018; Yiannopoulou & Papageorgiou, 2020). Accurate diagnosis of various stages of Alzheimer’s is based on cerebrospinal fluid (CSF) pathology, an expensive and invasive procedure (Engelborghs et al., 2017; Anoop et al., 2010). Donepezil, memantine, galantamine, rivastigmine, and aducanumab are Food and Drug Administration (FDA)-approved drugs prescribed for AD treatment in the early stages of the disease (Li et al., 2018; Koola 2020; Ray et al., 2020; Padda & Parmar, 2024). Mild cognitive impairment (MCI) is a pre-Alzheimer’s stage in which some of the symptoms of Alzheimer’s are poorly experienced; therefore, there is a high risk of developing Alzheimer’s. However, this progression is not guaranteed, and the individual will likely return to normal or remain at this stage (Neugroschl & Wang, 2011; Sanford, 2017). Given that Alzheimer’s effects on the brain start years prior to clinical symptoms, it is critical and attainable to predict the conversion of MCI to AD using brain information (Devanand et al. 2008; Mantzavinos & Alexiou, 2017). In this case, people can prepare for the disease from different aspects and start treatment as early as possible to achieve the best results.
Researchers and clinicians frequently exploit brain imaging methods, such as magnetic resonance imaging (MRI), positron emission tomography (PET), and functional MRI (fMRI) for this task. MRI shows the brain structure with high spatial resolution. PET uses ionizing radiation to provide insight into the brain’s anatomy and function with lower spatial resolution than MRI. FMRI provides knowledge about the anatomy and metabolic mechanisms of the brain with higher temporal and spatial resolution than PET, while being harmless (Buttenschoen et al., 2008; Judenhofer & Cherry, 2013; Varghese et al., 2013). Other techniques, such as magnetoencephalography (MEG) have their advantages and disadvantages (Varghese et al., 2013). Finally, invasive data, such as genetic information and CSF, and the cheapest, most accessible, and safest data types, such as clinical cognitive tests, have been used to predict AD among patients with MCI.
In recent years, many studies have used machine learning (ML) methods to predict conversion from MCI to AD, combining neuroimaging and clinical data with relatively good results. Researchers have attempted to solve this problem using new ML techniques, such as deep learning (DL), since these methods can discover and learn hidden patterns and provide more accurate answers (DeTure & Dickson, 2019; Tible et al., 2020). There is much ML research in neuroimaging-related studies, including MRI, PET, and fMRI, and researchers often exploit machine learning techniques to analyze manually extracted features. Among the mentioned studies, some are as follows: Hojjati et al. (2017) used a connection matrix to extract graph properties from resting-state fMRI data. Several of these features were then selected for evaluation using a support vector machine (SVM). Hojjati et al. (2018) also combined the characteristics of the same fMRI and MRI data of the subjects. In recent years, DL strategies have been used to solve this problem. Abrol et al. (2019) extracted time-varying features from fMRI, then deployed a three-dimensional convolutional neural network (3D-CNN) to extract attributes from MRI data, and trained an SVM on the combined features. Gao et al., in 2020 developed a 3D-CNN (containing six layers of convolution and three layers of max-pooling) based on MRI images (Gao et al., 2020). Nanni et al. in 2020 planned to compare the performance of transfer learning models with a 3D-CNN in processing MRI images. To do this, she designed a simple one-layer convolutional model and fine-tuned several pre-trained models. Finally, an average ensemble model was designed on five retrained models (Nanni et al. 2020). Pan et al. (2020) developed a novel integrated CNN-based model called the multi-view separable pyramid network. In this model, slice-wise and spatial-wise CNNs were performed on three PET image views (axial, coronal, and sagittal), and the resulting outputs were combined for classification. Er & Goularas (2020) used a CNN model whose filters were trained with an autoencoder to extract prognostic features from each patient’s volume. Then these features were delivered to an SVM model for classification. Also, some of these machine learning studies have deployed invasive data, such as genetic information and CSF, to predict MCI to AD (Cui et al., 2011; Zhang et al., 2012; Gavidia-Bovadilla et al., 2017; Lin et al., 2020). Lin et al. in 2020 developed an SVM model by combining information extracted from PET, MRI, CSF, genetic data, and clinical cognitive tests (Lin et al., 2020). Finally, in some machine learning studies, clinical cognitive tests and brain signals have been used to predict Alzheimer’s (Grassi et al., 2018; Grassi et al., 2019; Poil et al., 2013). In these studies, large samples were required to obtain reliable results. Grassi et al. (2018) used clinical and demographic features. After applying the feature selection process, several machine learning algorithms were designed and the best model was an SVM with a kernel-based radial base function. Also, Grassi et al. (2019) used only demographic data and cognitive clinical tests. First, all the features were used; then three more feature sets were created using three feature selection methods; and 13 machine learning algorithms were developed according to these four sets, resulting in 52 final models. Furthermore, a weighted averaging model was designed, by which the results of 52 models were averaged and presented on the test data. Finally, Xu et al. (2021) used a general form of Graph2Gauss architecture, a DL-based method called multiple graph Gaussian embedding model (MG2G), to classify graph-based features derived from MEG regional time series.
Nevertheless, none of these studies contains enough information alone to decisively predict the prognosis of MCI to AD. Also, some studies have used invasive predictors, such as CSF and genetics (Cui et al., 2011; Zhang et al., 2012; Gavidia-Bovadilla et al., 2017; Lin et al., 2020). To the best of our knowledge, this is the first study to use DL methods, including three-dimensional CNNs and long short-term memory (LSTM) to process fMRI data and address the described problem. These methods automatically extract and classify features, which is their primary advantage over conventional machine-learning techniques. This study aimed to introduce a new approach that combines features extracted from clinical cognitive tests and neuroimaging data in a neuronal framework and examine its effectiveness in improving results.
Materials and Methods
Dataset
In this study, clinical and fMRI data from patients who had been in the MCI stage were collected from the AD Neuroimaging Initiative (ADNI) to predict MCI conversion to Alzheimer’s. ADNI is a multicenter study designed to develop clinical, imaging, genetic, and biochemical markers for the early diagnosis of AD. Since its inception, over a decade ago, public-private partnerships have played a significant role in Alzheimer’s research, enabling data sharing among researchers worldwide. In ADNI, when a person is admitted according to inclusion and exclusion criteria, an initial diagnosis is made based on CSF pathology. Clinical cognitive tests are performed approximately every six months, and the remaining biomarkers are collected at time intervals of one to two years. This process continues as long as the person remains in the study, and specialists constantly update the patient’s diagnostic status. This study aimed to predict the conversion of MCI to Alzheimer’s by combining clinical and fMRI data. Thus, information from patients who had primarily been in the MCI stage was gathered. Some of these individuals remained moderately in the MCI phase over the years or eventually returned to normal (stable MCI [sMCI] group); however, the rest progressed to Alzheimer’s after a while (progressive MCI [pMCI] group). In this study, we excluded subjects who had been in the study for less than a year. Furthermore, because we wanted to utilize a combination of imaging and clinical data, given the differences in recording dates, we first examined the imaging dates for each patient. Then we considered test results recorded around the same time (no more than one month apart). Therefore, the corresponding clinical data were collected for each imaging series on a single date. If any data were not available on a given date, the other data were not used. Finally, we had 81 subjects, 28 had progressed from MCI to AD, and 53 either remained in MCI or returned to normal. A total of 266 samples from these individuals were available, of which 78 belonged to the pMCI class and 188 to the sMCI class. Table 1 presents details of the data in the two groups.
Tesla Phillips 3 Magnetic Resonance Imaging Scanner was used with echo planar image (EPI) to record functional and structural images while the participants were resting. The size of the functional image matrix was 64 by 64, and each 3D image of the brain volume was divided into 48 sections, each section being 3.3 mm, as well as an 80-degree rotation angle, a repetition time of three seconds, and a reflection time of 30 ms. Ultimately, 140 functional images were obtained for each participants. Moreover, we selected 17 clinical features from the ADNI database, including common demographic characteristics and cognitive neurophysiological test results. The AD neuroimaging initiative merge (ADNIMERGE) file, which the ADNI organization officially prepares, contains the essential variables of the data collected. Demographic information included age, gender, years of education, and marital status. Clinical cognitive tests are sum of boxes score of clinical dementia rate, functional activity questionnaire (FAQ), mini-mental state examination (MMSE), AD assessment scale (total of 11 activity scores [ADAS11]), ADAS13, ADASQ4, Rey auditory verbal learning test (RAVLT) scores (immediate [RAVLT-I], learning [RAVLT-L], forgetting [RAVLT-F], and percent-forgetting [RAVLT-PF]), trail making test version B (TRABSCOR) and the total delayed recall score of the logic memory subtest of the Wechsler memory scale-revised (LDELTOTAL) (Lynch et al., 2005; Chlebowski 2011; Salthouse 2011; Arevalo‐Rodriguez et al., 2015; Marshall et al., 2015; Fard et al., 2016; Kueper et al., 2018). We also examined the type of MCI in primary diagnosis (early or late). Dataset Details, reported in Table 2, show the names and abbreviations of the 17 clinical features, along with their statistics in the two groups.
Preprocessing
We first discarded the features, resulting in a loss of more than 5%. Therefore, the LDELTOTAL feature was discarded, while other clinical features were preserved. Then, we placed the missing values for the remaining features; we used the mean for numerical properties and the mode for categorical features (gender, marital status). We then normalized the numerical data and encoded the categorical features as one-hot vectors. Furthermore, we discarded the first ten measurements among the functional images recorded for each individual. Then, the following steps were performed to preprocess the images: Slice-timing correction to the last slice, realignment using a six-parameter rigid-body spatial transformation, EPI normalization, resampling to 3-mm isotropic voxels, detrending, smoothing using a Gaussian filter with FWHM (=4 mm), band-pass filtering (0.01–0.08 Hz) and elimination of destructive signals such as global mean signal, six head motion parameters, the CSF, and the white matter signals. Consequently, in the fMRI dataset, the original data dimensions were (64, 64, and 48) with a time dimension of 140. After the preprocessing step, the data dimensions were (61, 61, and 73) with a time dimension of 130. We used Python 3.8 to preprocess clinical features, SPM12, and the DPARSF toolbox to preprocess imaging data. Also, the clinical and imaging data values were normalized to be between zero and one.
CNN
A CNN is a DL model for processing data with a grid pattern, such as images. These networks are designed to learn spatial information and have three primary layers: Convolutional, pooling, and fully connected. The convolutional and pooling layers perform feature extraction, and the fully connected (dense) layer is the classification layer. This network can convert and reduce input data into a form that is easy to identify and examine without losing significant information. In the convolutional layer, a small matrix of numbers called a kernel is applied throughout the input by point multiplication to extract feature maps, which are then provided to a nonlinear activation function. Next, the pooling layer, which has no learnable parameters, down-sizes the results; for instance, the max-pooling layer, the most common type, retains the maximum value from each patch in a feature map and discards the remaining values. Finally, the last layers’ output is converted to a one-dimensional vector by a flatten layer and given to a (or more) fully connected layer. Each layer input is connected to the output by a learnable weight. Finally, in the output, we obtained the probability of belonging to each class for each case (Yamashita et al., 2018; Zhang et al., 2019).
LSTM
A LSTM network, a type of recurrent neural network, detects temporal dependencies in input data. In an LSTM network, at any time, the node receives its input, output, and hidden states from the previous time step. Then the output and the hidden state are delivered at their respective times. The hidden mode can be considered the LSTM’s node memory, which helps it remember input from previous time steps. Because the node structure is more complex than normal neuronal nodes, we call it a cell. This cell has four gates: Input, forget, output, and input modulation. Each gate has a weight to control how much information can pass through it, and the activation function determines that weight. Figure 1 shows the structure of an LSTM block and how it calculates its output (Zhang et al., 2019; Van Houdt et al., 2020).
Proposed model
Functional MRI is a set of three-dimensional images recorded for a limited time. Therefore, CNN and LSTM models can be used to process the fMRI spatial and temporal aspects. To our knowledge, this is the first study to use DL methods for fMRI processing and to combine clinical information to predict MCI-to-AD conversion using the proposed method. First, we evaluated whether the temporal aspect alone provided sufficient discriminative information. Therefore, we used the automated anatomical atlas to define and divide the brain into 116 regions; thus, the LSTM network’s input was a 130-by-116 matrix (130 time points and 116 features). We designed two LSTM models with 32 and 128 cells to investigate the effect of the number of LSTM cells per layer on the model’s diagnostic performance. Since the output size of all models must have been the same and equal to 32, a fully connected layer with 32 neurons was added after the 128-cell layer. The outputs of both models were then fed into a dense layer with two neurons and a softmax activation function for classification. Figure 2 shows the LSTM model.
Second, when CNN and LSTM models are combined, the resulting model is called CNN-LSTM, composed of a CNN part to extract spatial features, followed by an LSTM layer to extract temporal information. Figure 3 illustrates the structure of the CNN part of the CNN-LSTM models. The convolutional part of our proposed model was three-dimensional to prevent initial information loss due to data transformation. It consisted of six convolutional layers, with a filter size of 3×3 and a stride of one, and four max-pooling layers with a filter size of 2×2 and a stride of two. The input of this network was single functional images (regardless of the time dimension). The output of the last layer was 128 extracted features. Since 130 images were available for each sample, we utilized 130 3D-CNN models, each analyzing images from a specific time point, and concatenated their outputs to feed an LSTM layer (Figure 4). We designed two CNN-LSTM models since we previously designed two LSTM models.
Moreover, to investigate the effect of combining clinical data on the results, in all these final models, the 32-element output of the imaging section was concatenated with the output of a shallow neural network layer whose input was clinical data. The dense layer had five neurons; thus, the effect of the image features was about six times greater than that of the clinical features. Consequently, a 37-size vector was inserted into the classification layer. Finally, eight networks were developed (two LSTM and two CNN-LSTM models with and without combining with the clinical information). Figure 4 shows the CNN-LSTM model with 128 LSTM cells, combined with clinical information.
The models were designed in Google Colaboratory (12 GB RAM) using the Keras framework with Tensorflow as the backend. The Adam optimizer was used to train the CNN-LSTM models with a learning rate of 0.0001. To control overfitting, dropout was used; its value was 20% for the inner layers (except the first layer) and the LSTM layer (32 cells), 30% for the last pooling, and 40% for the 128-cell LSTM layer. Also, L2 regulation was used for the dense layers (32 and 5 neurons) with a coefficient of 0.001. Due to hardware limitations, the data were delivered to the model in batches, with a maximum of three for the CNN-LSTM models.
Training and evaluation
We trained and tested our models using 5-fold stratified cross-validation (CV). In this method (Schaffer 1993), the dataset is divided into five folds; four for training, and one for testing. The folds could be stratified, meaning that the ratio of each class (sMCI, pMCI) is nearly equal across folds and the whole dataset. Our training and test sets needed to be independent. Therefore, we randomly divided all the data into five parts, each containing about 20% of the data, and ensured that the parts were independent across patients; in other words, samples from the same subject were assigned to the same set. In our dataset, several samples were available for each participant. Also, we attempted to ensure that 30% of the samples in each set belonged to class one. Consequently, we had 81 subjects: 28 in the pMCI class, and 53 in the sMCI class. A total of 266 samples from these individuals were available, of which 78 belonged to the pMCI class and the remaining 188 to the sMCI class. In 5-fold CV, in testing, approximately 16 subjects (5 pMCI and 11 sMCI) and 53 samples (15 pMCI and 38 sMCI) are used per fold. Eventually, five training and testing subsets were produced, and all models were trained on each training set and evaluated on its corresponding test set. Also, we reserved 10% of each training set for evaluation to assess the appropriateness of the models’ design during training. Thus, we had five sets of training, testing, and evaluation, with ratios of 70%, 20%, and 10%, respectively. Notably, clinical data preprocessing for the training and test sets was performed separately to preserve the independence of the two sets. Finally, to report and compare the performance of the models, the evaluation metrics of accuracy, sensitivity, specificity, area under the receiver operating characteristic (ROC) curve (AUC), and confusion matrix were calculated across the five test sets.
Results
Figure 5 shows the mean accuracy and loss curves in the 5-fold CV training procedure of the CNN-LSTM models for the training and validation sets in four models (CNN-LSTM models with 32 and 128 cells and before and after combining with the clinical data). The models were trained for approximately 80 iterations. We optimized the model architecture and hyperparameters by trial and error, examining learning progress based on validation and training metrics to avoid overfitting.
The Mean±SD values of accuracy, sensitivity, specificity, and AUC metrics for the five test subsets are reported for eight models (LSTM models with 32 and 128 cells, CNN-LSTM networks with 32 and 128 cells, before and after combining with clinical data) in Table 3.
The evaluation values for the 32-cell LSTM network before combining with clinical features were 71.8% (accuracy), 9.00% (sensitivity), 97.32% (specificity), and 61.51% (AUC). In this model, we observed an increase in accuracy (78.94%), sensitivity (31.66%), specificity (98.4%), and AUC (68.42%) after combining with clinical information. In the next step, by increasing the LSTM model’s cell account to 128 before combining with clinical data, the accuracy, sensitivity, specificity, and AUC increased to 74.81%, 14.16%, 100%, and 70.07%, respectively. Finally, the 128-cell LSTM model, in combination with the clinical data, achieved the best performance among the LSTM models, with AUC (75.99%), accuracy (79.60%), and sensitivity (38.5%). For the CNN-LSTM networks, we also observed that increasing the number of recurrent layer cells improved results. The validation metrics for the 32-cell CNN-LSTM model before combining with clinical, were 86.84% (accuracy), 69.33% (sensitivity), 94.15% (specificity), and 90.62% (AUC). Then, by increasing the number of cells to 128, we observed improvements in accuracy (89.84%), sensitivity (83.33%), specificity (92.54%), and AUC (92.4%). As with the CNN-LSTM models, we also observed increased evaluation parameter values after adding clinical features, and both models achieved higher sensitivity, accuracy, and AUC. Finally, the 128-cell CNN-LSTM model achieved the best results when combined with the clinical data. It reached 92.47 % accuracy, 96.67% AUC, 92.33% sensitivity, and 92.55% specificity.
Figure 6 shows the ROC and AUC diagrams of the LSTM and CNN-LSTM models with 32 and 128 cells before and after combining with clinical data.
The 128-cell CNN-LSTM model, combining fMRI and clinical data, demonstrated the best results. Also, it is shown and concluded that the combination with the clinical predictors made the models more sensitive to the pMCI class since the curves started from points with higher true-positive rates. Finally, Figures 7 and 8 show confusion metrics of the best-performing LSTM and CNN-LSTM models (before adding clinical information) and (after adding clinical information).
It is also illustrated that combining with clinical data increased the true-positive rates while decreasing false-negative rates, meaning that the models became more sensitive toward the pMCI cases after combining clinical attributes. Lastly, according to the confusion matrices, the 128-cell CNN-LSTM models were the only networks with more false-positive rates than false-negative rates. After combining with clinical data, this model misdiagnosed only three samples from about 50 test set cases. It is worth noting that a false-positive rate higher than a false-negative rate is desirable, especially in medical issues, since incorrectly diagnosing a patient as unwell is less medically expensive than the other way around.
Discussion
This study evaluated and compared the performance of DL techniques in diagnosing the conversion of MCI to Alzheimer’s over an average of five years. We used rs-fMRI, neurophysiological test results, and common demographic characteristics as noninvasive, clinically available predictors. Our primary focus was to extract appropriate, sufficient features from the imaging data and then improve the results by combining them with clinical information. Since fMRI data are a series of 3D images recorded over a limited time, it would make sense to use a 3D CNN to extract their spatial features, followed by an LSTM layer to learn their temporal information, resulting in a CNN-LSTM network. Also, to confirm that studying both spatial and temporal aspects of fMRI was required to achieve good results, LSTM models were separately trained for comparison. According to the results (Table 3), considering both aspects of the information contained in fMRI undoubtedly enhanced the performance. We also observed that the number of cells in the LSTM layers affected model performance. According to AUC and accuracy metrics, an improvement was observed when increasing the number of cells from 32 to 128. Finally, after combining with clinical information, the CNN-LSTM model with 128-cell outperformed other models based on an AUC of 96.67%, an accuracy of 92.47%, a sensitivity of 92.33%, and a specificity of 92.55%.
Among the results from all models (Table 3), the LSTM networks performed poorly compared to the CNN-LSTM models, suggesting that the LSTM did not extract suitable features from fMRI. This could be due to several factors. First, the structure of LSTM might not have been adequate. We tried to maintain consistency in our work; therefore, by deleting the CNN parts from the proposed CNN-LSTM models, we obtained our LSTM models. As a result, LSTM models with more layers, different numbers of units, and different structural architectures could achieve better performance. Second, it could be because of the atlas we used; other atlases divide the brain into different regions and provide us with more and different time series. One last possible factor is the type of fMRI used here, which was a resting-state rather than a task-related one. Given that LSTM is mainly concentrated on temporal details rather than spatial ones, it could be pointed out that resting-state form contains less valuable temporal data than task-related fMRI; thus, apparently, not much information was provided here. Therefore, we deduced that the spatial aspect of the fMRI data played a pivotal role in the diagnostic abilities of the models.
We have designed our models based on the characteristics extracted from a combination of imaging data and clinically available noninvasive information. In all of these final models, the output of the imaging section (32 in length) was connected to the output of a 5-neuron dense layer (clinical), delivering a vector containing 37 elements to the classification layer. All four models performed better than their basic form when combined with clinical information. Because the models had more information to make decisions, their final results improved. It was also observed that integrating clinical data with imaging increased the sensitivity of the models to class one (Table 3, Figure 6, and Figure 7). Finally, we observed that the proposed method for the combination affected two critical issues: First, the models reached the appropriate results faster (based on the performance of the models on the evaluation data) because, the model had more information to identify. Second, it could have led to overfitting if the number of neurons in the clinical layer increased or the training process lasted longer.
Many studies have attempted to solve the problem of predicting AD among patients with MCI. Even though some studies provided machine learning techniques with a good level of accuracy, the data used by their algorithms was a combination of invasive data, which makes the proposed methods less applicable in real life. Table 4 summarizes the articles that predicted conversion from MCI to AD. As mentioned in this table and in a review of studies using neuroimaging biomarkers for AD prediction (Valizadeh et al., 2025; Zarei et al., 2025), MRI, fMRI, and PET are the most commonly used modalities.
CNNs from DL and SVMs from machine learning were the most common algorithms, with CNN-based models achieving higher average performance than other techniques. All articles similar to the present article used CV for training and evaluation, and the values of accuracy, AUC, sensitivity, and specificity are reported in the table. Also, in reviewing the articles, one should pay attention to the number of folds in the CV method, prediction interval (in years), and the number of pMCI samples. For example, in articles (Hojjati et al., 2017; Hojjati et al., 2018), data from 80 people were used; 18 of them belonged to the pMCI class, and in the CV method, the data were divided into nine parts. Finally, a two-stage framework for AD progression detection is proposed. In the first stage, a multiclass classification task is used to diagnose a patient in three classes (cognitively normal, MCI, or AD) by LSTM with an accuracy of 93.87%. In the second stage, a regression task is used to predict the exact conversion time for patients with MCI. In the regression stage, the LSTM model achieved the best results with mean absolute error of 0.1375.
Our proposed method has some advantages and limitations compared to existing research. The clinical cognitive tests used in the present study are the most attainable and noninvasive data types that are regularly registered for a basic diagnosis before any further assessments. However, the information provided from different exams has overlaps, and patients could get weary of taking all 12 tests. Although fMRI has advantages over other imaging methods, it is time-consuming and motion-sensitive, which can be inconvenient. Another essential point is that this study’s Alzheimer’s prediction time interval was an average of five years. In other studies, the prediction time was between three and four years, and we know that the prediction operation is more difficult with increasing prediction time. Also, due to the data imbalance and the fact that most samples belonged to the sMCI class, the models tended to this class by default. As a result, simple models were not responsive, and reliable outputs were not delivered, making it challenging to design a suitable model. Finally, to the best of our knowledge, DL methods for processing functional images and combining them with clinical data to predict AD have not been studied. The advantage of using deep neural networks in image analysis, such as fMRI, is that the image structure remains intact. Compared to conventional machine learning methods, deep neural networks can automatically analyze raw data, extract features, and classify data. Thus, no information is lost at first, and then, depending on the architecture of the designed model, the relevant features are provided. In this research, we aimed to design a DL model that converted a volume into 128 single attributes while losing as little information as possible. Therefore, one of the main reasons CNN-LSTM outperforms other machine learning techniques in processing fMRI data is that we do not need to preprocess the data before feeding it to the model. Thus, the data structure is preserved, while it is not the case for machine learning methods. It should be noted that deep neural networks are complex and computationally intensive and require robust hardware to train. Overall, DL methods require more potent hardware, more time, experience, and careful attention to precision to be designed and trained without overfitting or underfitting. Also, adjusting the rising number of hyperparameters in DL models is challenging since they are closely affected by each another. Nevertheless, we wanted to explore their utility and performance to our advantage due to their novelty and potential.
Despite the promising results presented here, several other structures can be designed for the LSTM and the CNN-LSTM models in future studies. The changes that can be considered include the number of LSTM layers, the number of cells, and the type of recurrent layer, and changing it to a gated recurrent unit neural network. Furthermore, according to the atlas data, other independent structures can be designed for the recurrent model. It is also recommended that models be designed and evaluated on a wider range of test and training samples. In addition, it is suggested that transfer learning methods be used in the design of the CNN model, and especially the CNN-LSTM model, to check the possibility of improving the results with these techniques. Lastly, it may be feasible to use a subset of carefully selected clinical features to either generate better results or provide greater patient comfort by reducing the time spent on clinical tests.
Conclusion
In the present study, a 3D-CNN-LSTM algorithm was developed that was highly sensitive in correctly identifying MCI patients who may develop AD between six months and an average of five years. We have shown that combining clinical data with fMRI based on the proposed approach yields better results. We also showed that processing both spatial and temporal aspects of rs-fMRI data is crucial for achieving decent outcomes. Finally, our model outperformed other ML methods based on AUC (96.67%), accuracy (92.47%), sensitivity (92.33%), and specificity (92.55%), and can be used for initial clinical diagnosis.
Ethical Considerations
Compliance with ethical guidelines
All procedures performed in studies involving human participants were in accordance with the ethical standards of the institutional and/or national research committee and with the 1964 Helsinki Declaration and its later amendments, or with comparable ethical standards. Informed consent was obtained from all the participants included in the study.
Funding
This research was financially supported by Shahid Beheshti University of Medical Sciences, Tehran, Iran (Grant No.: 43014246).
Authors' contributions
All authors contributed equally to the conception and design of the study, data collection and analysis, interception of the results and drafting of the manuscript. Each author approved the final version of the manuscript for submission.
Conflict of interest
The authors declared no conflict of interest.
Acknowledgments
The authors appreciate the support of Shahid Beheshti University of Medical Sciences, Tehran, Iran.
References
Anoop, A., Singh, P. K., Jacob, R. S., & Maji, S. K. (2010). CSF biomarkers for Alzheimer's disease diagnosis. International Journal of Alzheimer's Disease, 2010, 606802.[DOI:10.4061/2010/606802] [PMID]
Abrol, A., Fu, Z., Du, Y., & Calhoun, V. D. (2019). Multimodal data fusion of deep learning and dynamic functional connectivity features to predict Alzheimer’s disease progression. Annual International Conference of the IEEE Engineering in Medicine and Biology Society. IEEE Engineering in Medicine and Biology Society. Annual International Conference, 2019, 4409–4413. [DOI:10.1109/EMBC.2019.8856500] [PMID]
Arevalo-Rodriguez, I., Smailagic, N., Roqué I Figuls, M., Ciapponi, A., Sanchez-Perez, E., & Giannakou, A., et al. (2015). Mini-Mental State Examination (MMSE) for the detection of Alzheimer's disease and other dementias in people with mild cognitive impairment (MCI). The Cochrane Database of Systematic Reviews, 2015(3), CD010783. [DOI:10.1002/14651858.CD010783.pub2] [PMID]
Buttenschoen, K., Kornmann, M., Berger, D., Leder, G., Beger, H. G., & Vasilescu, C. (2008). Endotoxemia and endotoxin tolerance in patients with ARDS. Langenbeck’s Archives of Surgery, 393(4), 473-478. [DOI:10.1007/s00423-008-0317-3] [PMID]
Chlebowski, C. (2011). Wechsler memory scale all versions. In J. S. Kreutzer, J. DeLuca & B. Caplan (Eds), Encyclopedia of clinical neuropsychology (pp. 2688-2690). New York: Springer.[DOI:10.1007/978-0-387-79948-3_1163]
Cui, Y., Liu, B., Luo, S., Zhen, X., Fan, M., & Liu, T., et al. (2011). Identification of conversion from mild cognitive impairment to Alzheimer’s disease using multivariate predictors. Plos One, 6(7), e21896. [DOI:10.1371/journal.pone.0021896] [PMID]
Devanand, D. P., Liu, X., Tabert, M. H., Pradhaban, G., Cuasay, K., & Bell, K., et al. (2008). Combining early markers strongly predicts conversion from mild cognitive impairment to Alzheimer’s disease. Biological Psychiatry, 64(10), 871-879. [DOI:10.1016/j.biopsych.2008.06.020] [PMID]
DeTure, M. A., & Dickson, D. W. (2019). The neuropathological diagnosis of Alzheimer’s disease. Molecular Neurodegeneration, 14(1), 32. [DOI:10.1186/s13024-019-0333-5] [PMID]
Engelborghs, S., Niemantsverdriet, E., Struyfs, H., Blennow, K., Brouns, R., & Comabella, M., et al. (2017). Consensus guidelines for lumbar puncture in patients with neurological diseases. Alzheimer’s & Dementia, 8, 111-126. [DOI:10.1016/j.dadm.2017.04.007] [PMID]
Er, F., & Goularas, D. (2020). Predicting the prognosis of MCI patients using longitudinal MRI data. IEEE/ACM transactions on computational biology and bioinformatics, 18(3), 1164-1173. [DOI:10.1109/TCBB.2020.3017872] [PMID]
El-Sappagh, S., Saleh, H., Ali, F., Amer, E., & Abuhmed, T. (2022). Two-stage deep learning model for Alzheimer’s disease detection and prediction of the mild cognitive impairment time. Neural Computing and Applications, 34(17), 14487-14509. [DOI:10.1007/s00521-022-07263-9]
Khosravi Fard, E., L Keelor, J., Akbarzadeh Bagheban, A., & W Keith, R. (2016). Comparison of the Rey Auditory Verbal Learning Test (RAVLT) and digit test among typically achieving and gifted students. Iranian Journal of Child Neurology, 10(2), 26-37. [PMID]
Gavidia-Bovadilla, G., Kanaan-Izquierdo, S., Mataró-Serrat, M., Perera-Lluna, A., & Alzheimer’s Disease Neuroimaging Initiative. (2017). Early prediction of Alzheimer’s disease using null longitudinal model-based classifiers. Plos One, 12(1), e0168011. [DOI:10.1371/journal.pone.0168011] [PMID]
Gao, F., Yoon, H., Xu, Y., Goradia, D., Luo, J., & Wu, T., et al. (2020). AD-NET: Age-adjust neural network for improved MCI to AD conversion prediction. NeuroImage. Clinical, 27, 102290. [DOI:10.1016/j.nicl.2020.102290] [PMID]
Grassi, M., Perna, G., Caldirola, D., Schruers, K., Duara, R., & Loewenstein, D. A. (2018). A clinically-translatable machine learning algorithm for the prediction of Alzheimer’s disease conversion in individuals with mild and premild cognitive impairment. Journal of Alzheimer’s Disease, 61(4), 1555-1573. [DOI:10.3233/JAD-170547] [PMID]
Grassi, M., Rouleaux, N., Caldirola, D., Loewenstein, D., Schruers, K., & Perna, G., et al. (2019). A novel ensemble-based machine learning algorithm to predict the conversion from mild cognitive impairment to Alzheimer’s disease using socio-demographic characteristics, clinical information, and neuropsychological measures. Frontiers in Neurology, 10, 756. [DOI:10.3389/fneur.2019.00756] [PMID]
Ghafoori, S., & Shalbaf, A. (2022). Predicting conversion from MCI to AD by integration of rs-fMRI and clinical information using 3D-convolutional neural network. International Journal of Computer Assisted Radiology and Surgery, 17(7), 1245-1255. [DOI:10.1007/s11548-022-02620-4] [PMID]
Hojjati, S. H., Ebrahimzadeh, A., Khazaee, A., Babajani-Feremi, A., & Alzheimer’s Disease Neuroimaging Initiative. (2017). Predicting conversion from MCI to AD using resting-state fMRI, graph theoretical approach and SVM. Journal of Neuroscience Methods, 282, 69-80. [DOI:10.1016/j.jneumeth.2017.03.006] [PMID]
Hojjati, S. H., Ebrahimzadeh, A., Khazaee, A., Babajani-Feremi, A., & Alzheimer’s Disease Neuroimaging Initiative. (2018). Predicting conversion from MCI to AD by integrating rs-fMRI and structural MRI. Computers in Biology and Medicine, 102, 30-39. [DOI:10.1016/j.compbiomed.2018.09.004] [PMID]
Judenhofer, M. S., & Cherry, S. R. (2013). Applications for preclinical PET/MRI. Seminars in Nuclear Medicine, 43, (1), 19-29). [DOI:10.1053/j.semnuclmed.2012.08.004] [PMID]
Koola, M. M. (2020). Galantamine-Memantine combination in the treatment of Alzheimer’s disease and beyond. Psychiatry Research, 293, 113409. [DOI:10.1016/j.psychres.2020.113409] [PMID]
Kueper, J. K., Speechley, M., & Montero-Odasso, M. (2018). The Alzheimer’s disease assessment scale-cognitive subscale (ADAS-Cog): Modifications and responsiveness in pre-dementia populations. A narrative review. Journal of Alzheimer’s Disease, 63(2), 423-444. [DOI:10.3233/JAD-170991] [PMID]
Li, Q., He, S., Chen, Y., Feng, F., Qu, W., & Sun, H. (2018). Donepezil-based multi-functional cholinesterase inhibitors for treatment of Alzheimer’s disease. European Journal of Medicinal Chemistry, 158, 463-477. [DOI:10.1016/j.ejmech.2018.09.031] [PMID]
Lin, W., Gao, Q., Yuan, J., Chen, Z., Feng, C., & Chen, W., et al. (2020). Predicting Alzheimer’s disease conversion from mild cognitive impairment using an extreme learning machine-based grading method with multimodal data. Frontiers in Aging Neuroscience, 12, 77. [DOI:10.3389/fnagi.2020.00077] [PMID]
Lynch, C. A., Walsh, C., Blanco, A., Moran, M., Coen, R. F., & Walsh, J. B., et al. (2006). The clinical dementia rating sum of box score in mild dementia. Dementia and Geriatric Cognitive Disorders, 21(1), 40-43. [DOI:10.1159/000089218] [PMID]
Mantzavinos, V., & Alexiou, A. (2017). Biomarkers for Alzheimer’s disease diagnosis. Current Alzheimer Research, 14(11), 1149-1154. [DOI:10.2174/1567205014666170203125942] [PMID]
Marshall, G. A., Zoller, A. S., Lorius, N., Amariglio, R. E., Locascio, J. J., & Johnson, K. A., et al. (2015). Functional activities questionnaire items that best discriminate and predict progression from clinically normal to mild cognitive impairment. Current Alzheimer research, 12(5), 493–502. [DOI:10.2174/156720501205150526115003] [PMID]
Neugroschl, J., & Wang, S. (2011). Alzheimer’s disease: Diagnosis and treatment across the spectrum of disease severity. Mount Sinai Journal of Medicine: A Journal of Translational and Personalized Medicine, 78(4), 596-612. [DOI:10.1002/msj.20279] [PMID]
Nanni, L., Interlenghi, M., Brahnam, S., Salvatore, C., Papa, S., & Nemni, R., et al. (2020). Comparison of transfer learning and conventional machine learning applied to structural brain MRI for the early diagnosis and prognosis of Alzheimer’s disease. Frontiers in Neurology, 11, 576194. [DOI:10.3389/fneur.2020.576194] [PMID]
Padda, I. S., & Parmar, M. (2024). Aducanumab. In StatPearls. StatPearls Publishing. [PMID]
Pan, X., Phan, T. L., Adel, M., Fossati, C., Gaidon, T., & Wojak, J., et al. (2021). Multi-view separable pyramid network for AD prediction at MCI stage by 18 F-FDG brain PET imaging. IEEE transactions on medical imaging, 40(1), 81–92. [DOI:10.1109/TMI.2020.3022591] [PMID]
Poil, S. S., De Haan, W., van der Flier, W. M., Mansvelder, H. D., Scheltens, P., & Linkenkaer-Hansen, K. (2013). Integrative EEG biomarkers predict progression to Alzheimer’s disease at the MCI stage. Frontiers in Aging Neuroscience, 5, 58. [DOI:10.3389/fnagi.2013.00058] [PMID]
Ray, B., Maloney, B., Sambamurti, K., Karnati, H. K., Nelson, P. T., & Greig, N. H., et al. (2020). Rivastigmine modifies the α-secretase pathway and potentially early Alzheimer’s disease. Translational Psychiatry, 10(1), 47. [DOI:10.1038/s41398-020-0709-x]
Salthouse, T. A. (2011). What cognitive abilities are involved in trail-making performance? Intelligence, 39(4), 222-232. [DOI:10.1016/j.intell.2011.03.001] [PMID]
Sanford, A. M. (2017). Mild cognitive impairment. Clinics in Geriatric Medicine, 33(3), 325-337. [DOI:10.1016/j.cger.2017.02.005] [PMID]
Schaffer, C. (1993). Selecting a classification method by cross-validation. Machine Learning, 13(1), 135-143. [DOI:10.1023/A:1022639714137]
Tible, M., Sandelius, Å., Höglund, K., Brinkmalm, A., Cognat, E., & Dumurgier, J., et al. (2020). Dissection of synaptic pathways through the CSF biomarkers for predicting Alzheimer disease. Neurology, 95(8), e953-e961. [DOI:10.1212/WNL.0000000000010131] [PMID]
Varghese, T., Sheelakumari, R., James, J. S., & Mathuranath, P. (2013). A review of neuroimaging biomarkers of Alzheimer’s disease. Neurology Asia, 18(3), 239-248. [PMID]
Van Houdt, G., Mosquera, C., & Nápoles, G. (2020). A review on the long short-term memory model. Artificial Intelligence Review, 53(8), 5929-5955. [DOI:10.1007/s10462-020-09838-1]
Valizadeh, G., Elahi, R., Hasankhani, Z., Rad, H. S., & Shalbaf, A. (2025). Deep learning approaches for early prediction of conversion from MCI to AD using MRI and clinical data: A systematic review. Archives of Computational Methods in Engineering, 32(2), 1229-1298. [DOI:10.1007/s11831-024-10176-6]
Weller, J., & Budson, A. (2018). Current understanding of Alzheimer’s disease diagnosis and treatment. F1000Research, 7, F1000 Faculty Rev-1161. [DOI:10.12688/f1000research.14506.1] [PMID]
Xu, M., Sanz, D. L., Garces, P., Maestu, F., Li, Q., & Pantazis, D. (2021). A graph Gaussian embedding method for predicting Alzheimer’s disease progression with MEG brain networks. IEEE Transactions on Bio-Medical Engineering, 68(5), 1579–1588. [DOI:10.1109/TBME.2021.3049199] [PMID]
Yiannopoulou, K. G., & Papageorgiou, S. G. (2020). Current and future treatments in Alzheimer disease: An update. Journal of Central Nervous System Disease, 12, 1179573520907397. [DOI:10.1177/1179573520907397] [PMID]
Yamashita, R., Nishio, M., Do, R. K. G., & Togashi, K. (2018). Convolutional neural networks: An overview and application in radiology. Insights into Imaging, 9(4), 611-629. [DOI:10.1007/s13244-018-0639-9] [PMID]
Zhang, X., Yao, L., Wang, X., Monaghan, J., Mcalpine, D., & Zhang, Y. (2019). A survey on deep learning based brain computer interface: Recent advances and new frontiers. Journal of Neural Engineering, 18(3), 031002. [Link]
Zarei, S., Saffar, M., Shalbaf, R., Hassani Abharian, P., & Shalbaf, A. (2025). Explainable hierarchical machine-learning approaches for multimodal prediction of conversion from mild cognitive impairment to Alzheimer’s disease. Physical and Engineering Sciences in Medicine, 48(4), 1741–1759. [DOI:10.1007/s13246-025-01618-x] [PMID]
Zhang, D., Shen, D., & Alzheimer’s Disease Neuroimaging Initiative. (2012). Predicting future clinical changes of MCI patients using longitudinal and multimodal biomarkers. Plos One, 7(3), e33182. [DOI:10.1371/journal.pone.0033182] [PMID]
Type of Study: Original |
Subject:
Cognitive Neuroscience
Received: 2024/11/16 | Accepted: 2025/06/2 | Published: 2025/11/28
Received: 2024/11/16 | Accepted: 2025/06/2 | Published: 2025/11/28
Send email to the article author
| Rights and permissions | |
 |
This work is licensed under a Creative Commons Attribution-NonCommercial 4.0 International License. |
![]()
Copyright © The Author(s);
This is an open access article distributed under the terms of the Creative Commons Attribution License (CC-By-NC), which permits use, distribution, and reproduction in any medium, provided the original work is properly cited and is not used for commercial purposes.
Contact Information
