

Volume 16 - Special Issue on Cognitive Sciences
BCN 2025, 16 - Special Issue on Cognitive Sciences: 233-250 |
Back to browse issues page


Download citation:
BibTeX | RIS | EndNote | Medlars | ProCite | Reference Manager | RefWorks
Send citation to:


BibTeX | RIS | EndNote | Medlars | ProCite | Reference Manager | RefWorks
Send citation to:
Zarei S, Shalbaf R, Shalbaf A. Statistical Method for Identification of Alzheimer Disease With Multimodal Predictive Markers Mild Cognitive Impairment. BCN 2025; 16 (S1) :233-250
URL: http://bcn.iums.ac.ir/article-1-2919-en.html
URL: http://bcn.iums.ac.ir/article-1-2919-en.html


1- Institute for Cognitive Science Studies, Tehran, Iran.
2- Department of Biomedical Engineering and Medical Physics, School of Medicine, Shahid Beheshti University of Medical Sciences, Tehran, Iran.
2- Department of Biomedical Engineering and Medical Physics, School of Medicine, Shahid Beheshti University of Medical Sciences, Tehran, Iran.
Full-Text [PDF 2638 kb]
| Abstract (HTML)
Full-Text:
1. Introduction
Alzheimer disease (AD), a severe form of dementia marked by rapid progression and profound cognitive impact, necessitates exploration of symptoms, rising incidence, diagnostic progress, and the urgent need for enhanced measures (Song et al., 2018). AD is exceptionally severe, progressing swiftly and often leading to fatality with profound cognitive impairment. Individuals with AD experience various symptoms, underscoring the pressing need for improved diagnostic, preventive, and therapeutic measures. The rising incidence of AD mirrors the demographic shift toward an aging population. Recent statistics indicate that approximately 5% to 10% of individuals aged 65 and above meet the criteria for AD (Rizzi et al., 2014). Projections suggest that a staggering 152 million people worldwide will be affected by 2050, underscoring the importance of understanding AD’s development and mechanisms (Nichols et al., 2022). Collaborative initiatives, exemplified by the AD neuroimaging initiative (ADNI) (Mueller et al., 2005), play a pivotal role in recruitment, assessment, and data management. ADNI’s comprehensive approach significantly advances our comprehension of AD, bridging the gap between epidemiological trends and the disease’s intricate neurobiological processes. Concurrently, AD diagnosis has progressed with implementing the international working group (IWG-2) 5 criteria, representing a delicate balance between biomarkers and clinical phenotypes. These criteria facilitate a nuanced understanding of the clinical heterogeneity inherent in AD (Badhwar et al., 2020). Integrating biomarkers and clinical features is especially critical in comprehending the phases of AD (Qiu et al., 2014), influencing the design and execution of clinical trials, and shaping treatment considerations.
In elucidating the critical role of early detection and precise risk prediction within AD research, there is an emphasis on recognizing mild cognitive impairment (MCI) as a pivotal prodromal stage. Within the intricate domain of AD investigation, this emphasis consistently revolves around the imperative need for early detection and precise risk prediction (Leibing, 2014; Petersen, 2018; Risacher & Saykin, 2013). The emphasis originates from the economic and clinical advantages of timely identification and intervention, signaling a paradigm shift towards proactive healthcare strategies (Leifer, 2003). Various scholarly discourses significantly contribute to this thematic exploration, converging on the challenging question of early AD diagnosis. This dialogue accentuates the importance of acknowledging MCI as a prodromal stage, representing a critical juncture in the temporal progression of AD (Breton et al., 2019; Petersen et al., 1999). MCI, distinguished by noticeable cognitive decline exceeding age-related expectations without significant interference with daily life, emerges as a pivotal phase in comprehending and detecting early AD symptoms (Petersen, 2004).
Identifying individuals with MCI susceptible to the progression to AD is crucial for timely intervention. Although MCI is not a deterministic condition precursor to dementia (Pandya et al., 2016) and even sometimes reverses to normal state (Roberts et al., 2014), the exploration of MCI to AD encompasses diverse modalities, including clinical/demographic factors (Tokuchi et al., 2014; Xue et al., 2017), positron emission tomography or magnetic resonance imaging (PET/MRI) analyses (Drzezga et al., 2003; Lombardi et al., 2020; Sörensen et al., 2019), genotyping (Fei & Jianhua, 2013), along with neurocognitive assessments (Hu et al., 2021; Thaipisuttikul et al., 2022), and psychosocial elements (Gabryelewicz et al., 2007; Li & Li, 2018; Tan et al., 2019). Each modality carries distinct advantages and limitations. Clinical/demographic factors provide valuable contextual information and play a pivotal role in diagnostic decision-making. PET/MRI analyses furnish high-resolution neuroimaging data, yet, despite yielding precise images, entail considerations of cost and radiation exposure. Genotyping offers insights into genetic underpinnings but may lack specificity. Neurocognitive assessments unravel cognitive profiles, although they may exhibit variability in reliability. The intricate interplay and potential synergy among these modalities introduce complexities, presenting unique challenges in comprehending the progression from MCI to AD. It is worth noting that, although our dataset does not directly assess psychosocial elements, we review relevant studies to ensure a comprehensive understanding of all features in our contextual analysis.
Embarking on a discussion of previous studies, Li and Li’s meta-analysis reveals a possible correlation between anxiety, AD biomarkers, and cognitive decline in MCI (Li & Li, 2018). However, the study faces challenges due to the lack of specificity in MCI subtypes and inconsistencies in operational and diagnostic criteria, posing difficulties in forming robust conclusions. This condition leads to an inherent limitation, as relying on reported measures rather than patient-administered assessments may result in false diagnostic assumptions (Li & Li, 2018). Transitioning to a different focus, Fei et al.’s literature synthesis integrates findings from 8 studies exploring the association between the APOE ε4-allele and the transition risk from MCI to AD (Fei & Jianhua, 2013). The meta-analysis underscores a heightened AD risk in amnestic MCI patients with the APOE ε4-allele. Despite the robust findings, the study acknowledges limitations, such as the need for larger sample sizes and additional family-based transmission/disequilibrium test studies. It also highlights potential publication bias from data sourced in English journals and the absence of family-based transmission/disequilibrium test studies. Shifting the focus to community-based follow-up surveys, Hu et al.’s study, spanning 17 communities, employed psychiatric medical staff with over 2 years of clinical experience, achieving a 43.8% follow-up rate (Hu et al., 2020). Challenges emerged as demographic differences surfaced among participants who were lost to follow-up. Among the 441 diagnosed with MCI, the study uncovered varied outcomes, with 17.5% progressing to dementia, 80.7% remaining stable, and 1.8% reverting to normal cognition. The findings also unveiled significant associations with diabetes, marital status, and occupational roles.
Continuing in a longitudinal context, Gabryelewicz et al. conducted an extensive study involving 105 individuals with MCI, subjecting them to comprehensive assessments and following up every 12 months (Gabryelewicz et al., 2007). Over the 3 years, the study observed a significant trend: Individuals identified with multiple-domains MCI displayed a notably increased likelihood of progressing to dementia, emphasizing the clinical significance of this classification. This shift in focus from community-based surveys to more targeted assessments contributes to a nuanced understanding of MCI progression. Shifting gears to a 6-year investigation, Ates and Can, observed 76 individuals aged 57 and above diagnosed with MCI (Ates & Can, 2020). The study’s results reveal that 44.7% progressed to dementia, while 55.3% maintained an MCI diagnosis. Noteworthy associations are found between dementia cases and advanced age, vascular diseases, and shorter education duration.
Additionally, patients with dementia exhibited a notably higher prevalence (94.1%) of vascular systemic diseases compared to those persisting with MCI. This prolonged study duration allows for a comprehensive examination of the factors influencing MCI outcomes. Transitioning to another longitudinal study by Xue et al., encompassing a 5-year biannual follow-up of 437 MCI patients (Xue et al., 2017), 24.3% progressed to AD. This study identified transition risk factors, including gender, age, reading habits, smoking, drinking, cerebrovascular disease, hyperlipidemia, and diabetes. Moreover, it highlighted education as a protective factor, while advanced age and the presence of cerebrovascular disease significantly influenced the transitions from MCI to AD and death. This nuanced exploration of various factors affecting MCI outcomes contributes to a richer understanding of the complexities involved. Finally, RO Roberts spearheaded a study involving thorough assessments of residents aged 70 to 89 (Roberts et al., 2014). This comprehensive evaluation covered demographic information, memory inquiries, clinical ratings, and neuropsychological tests. MCI classifications included amnestic and non-amnestic MCI, along with single- and multiple-domain MCI. Participants underwent assessments at 15-month intervals, uncovering an elevated risk of dementia in those with a history of MCI, particularly among women aged 80 to 89. This community-based approach, coupled with detailed assessments, provides a bridge between community-based surveys and more targeted clinical investigations, offering a holistic view of MCI progression.
Recent investigations have adopted multimodal strategies to predict AD progression by integrating neuroimaging, genetic data, and neurocognitive assessments, which closely aligns with our methodology of utilizing PET, MRI, genotyping, and neurocognitive tests to differentiate between stable MCI (sMCI) and progressive MCI (pMCI) (Hojjati et al., 2022; Mirabnahrazam et al., 2022; Platero & Tobar, 2020; Zhou et al., 2021). Techniques such as MRI have demonstrated efficacy in detecting structural and functional brain changes while incorporating MRI with genetic markers has significantly improved prediction accuracy for AD progression (Mirabnahrazam et al., 2022). Longitudinal studies combining structural MRI with neurocognitive assessments or PET biomarkers have also shown enhanced predictive capacity for neuropsychological outcomes (Hojjati et al., 2022; Platero & Tobar, 2020). Additionally, approaches to information with advanced methods, such as 3D-convolutional neural networks, have further refined the ability to predict conversion from MCI to AD (Ghafoori & Shalbaf, 2022). A systematic review of deep learning approaches shows how combining MRI and clinical data can yield early conversion predictions from MCI to AD (Valizadeh et al., 2024). Our study further extends this work by employing a robust statistical framework to comprehensively evaluate these multimodal features, underscoring the importance of integrated and longitudinal approaches for early diagnosis and targeted therapeutic interventions.
Concluding this integrated discussion, SJ Lee’s study utilizing data from the first phase of the ADNI (ADNI-1) cohort (ADNI)-1 focused on 382 participants with amnestic MCI (Lee et al., 2014). Over a 2.9-year follow-up, 46.9% progressed to probable AD. Factors influencing progression encompassed demographic, symptomatic, functional, and neuropsychiatric domains. Though less accurate than the full index with neuroimaging measures, the clinical index underscored the importance of their inclusion for heightened predictive precision. This transition from community-based assessments to more refined clinical investigations demonstrates the intricate interplay of factors influencing MCI outcomes, showcasing the complexity of predicting progression to dementia.
We employ an innovative approach, delving into various modules to foster a holistic understanding of the intricate interplay among demographics, PET, genotyping, MRI, and neurocognitive tests. This comprehensive exploration seeks to identify effective markers that distinguish participants into two cohorts: Those consistently maintaining an MCI diagnosis, termed sMCI, and those progressing from MCI to AD, known as pMCI. Each module serves as a unique lens for our investigation. Demographics enhance our understanding of prevalence and risk, PET sheds light on functional and metabolic nuances, genotyping delves into genetic and molecular realms, MRI unveils intricate structural details, and neurocognitive tests assess cognitive function. Our exhaustive statistical scrutiny rigorously evaluates the significance of these modalities, pinpointing their value in identifying AD within the spectrum of MCI. This holistic exploration, empowered by statistical methods, enables us to distill the most potent predictive markers, refining early detection strategies for AD. By navigating diverse modalities and conducting a nuanced analysis, our innovative investigation aims to uncover optimal predictors for AD within the context of MCI, contributing to a more profound comprehension of the disease and advancing early detection efforts.
2. Materials and Methods
ADNI: Cohort collaboration, data integration, and access protocols
The ADNI initiative stands as a groundbreaking collaborative effort, aiming to revolutionize our understanding of AD by advancing early diagnostic capabilities, standardizing data sharing, enhancing clinical trial methodologies, and fostering collaborative research endeavors. Integral to this initiative, the ADNI-MERG dataset plays a pivotal role in consolidating a diverse array of data into a unified repository. The manuscript’s framework provides efficient access to a comprehensive dataset, including demographic information, PET, genotyping, MRI, and neurocognitive assessments, minimizing the need for complex data integration. Each dataset entry corresponds to a participant’s visit across different ADNI phases, providing crucial details like participant ID, site visited, examination date, original study protocol, and data collection study protocol. Furthermore, the dataset includes extensive baseline data from all tests conducted during each participant’s visit, establishing a robust groundwork for focused exploration of patterns and relationships aligned with the study’s objectives. Accessing ADNI data involves submitting a formal request to the ADNI team and outlining research goals and methodologies. Following a thorough approval procedure, the ADNI team grants necessary permissions for data access.
Inside ADNI-MERG data: Exploration, cleaning, and trajectory insights
The ADNI-MERG dataset includes a comprehensive array of data types, with baseline (BL) fields extending beyond demographic information. Time-related fields, such as visit codes and examination dates, provide a longitudinal perspective, while “update_stamp” fields offer insights into the last modification of entries. The “DX” column indicates diagnostic categories, with “NA” denoting missing values, underscoring the need for careful analysis and prompting researchers to consider imputation techniques or exclusion criteria.
The dataset encompasses essential demographic variables, including AGE (mean age), PTEDUCAT (participant’s years of education), PTETHCAT (participant’s ethnic category), PTGENDER (participant’s gender), PTMARRY (participant’s marital status), and PTRACCAT (participant’s racial categories). Cognitive assessments comprise ADAS11 (11 items), ADAS13 (13 items), and ADASQ4 (cognitive subscale question 4) from the AD assessment scale (ADAS), along with CDRSB (clinical dementia rating - sum of boxes), DIGITSCOR (digit symbol substitution test), FAQ (functional assessment questionnaire), LDELTOTAL (logical memory I and II, delayed recall), MMSE (mini‐mental state examination), TRABSCOR (trail making test-B-score), MOCA (Montreal cognitive assessment), mPACCtrailsB (ADNI modified preclinical Alzheimer cognitive composite with trails B), and mPACCdigit (ADNI modified preclinical Alzheimer cognitive composite with digit symbol substitution). Also RAVLT.immediate (RAVLT immediate), RAVLT.learning (RAVLT learning), RAVLT.Forgetting (RAVLT Forgetting), and RAVLT.perc.forgetting (RAVLT percent forgetting) from the Rey auditory verbal learning test. Everyday cognition test participant self-report assessments encompass EcogPtMem (EcogPT memory test), EcogPtLang (EcogPT language test), EcogPtVisspat (EcogPT visual-spatial and perceptual abilities test), EcogPtPlan (EcogPT planning test), EcogPtOrgan (EcogPT organization test), EcogPtDivatt (EcogPT divided attention test), and EcogPtTotal (EcogPT total test mean score). Additionally, EcogSPMem (EcogSP memory test), EcogSPLang (EcogSP language test), EcogSPVisspat (EcogSP visual-spatial and perceptual abilities test), EcogSPPlan (EcogSP planning test), EcogSP organ (EcogSP organization test), EcogSPDivatt (EcogSP divided attention test), and EcogSPTotal (EcogSP total test mean score) represent assessments from the everyday cognition study partner report. PET and genotype features encompass AV45 (florbetapir), FBB (florbetaben), FDG (fluorodeoxyglucose), PIB (Pittsburgh compound B), APOE4 (apolipoprotein E), ABETA (amyloid β peptide), PTAU (blood phosphorylated tau), and total tau (TAU). Brain region volume measurements include Entorhinal (entorhinal cortex), fusiform (fusiform gyrus), hippocampus, ICV (intracranial volume), MidTemp (middle temporal gyrus), ventricles (brain ventricles), and whole brain.
The meticulous preparation of the dataset involved a rigorous data-cleaning process to enhance its quality and relevance. Duplicate entries were systematically eradicated using participant ID (RID) and visit code as distinctive identifiers to guarantee the distinctiveness of each participant’s visit. Coherence was enhanced by excluding subjects lacking a diagnosis, while the omission of participants with a solitary diagnosis enriched dataset diversity and encompassed a broader spectrum of diagnostic transitions. The exclusion of rows with complete missing values was essential to maintain the accuracy and integrity of the data set. These judiciously applied criteria contribute to a meticulously curated dataset, void of redundancies, including participants with significant diagnostic information, and devoid of incomplete or uninformative entries, aligning with the study’s precise goals and analytical requisites. Significant work on the ADNI-MERG dataset included the implementation of enhancements to enrich the understanding of participant trajectories and diagnostic alterations within the ADNI study. These updates provided an in-depth insight into participant involvement and diagnostic shifts, introducing additional metrics such as visit frequency, participant engagement duration, and unique visit identifiers. This condition enriched the dataset and expanded the ability to assess participant progressions thoroughly. Incorporating group labels to identify transitions between diagnostic states and records of diagnosis conversions significantly fortified the dataset’s capability to capture and illuminate the intricacies of participants’ diagnostic changes. Notably, categorizing participants into progressive and stable MCI groups provided a more refined analysis of participant paths and their diagnostic alterations throughout their involvement in the study, which is discussed in detail later.
Exploring ADNI data dynamics: In-depth analysis and visualization
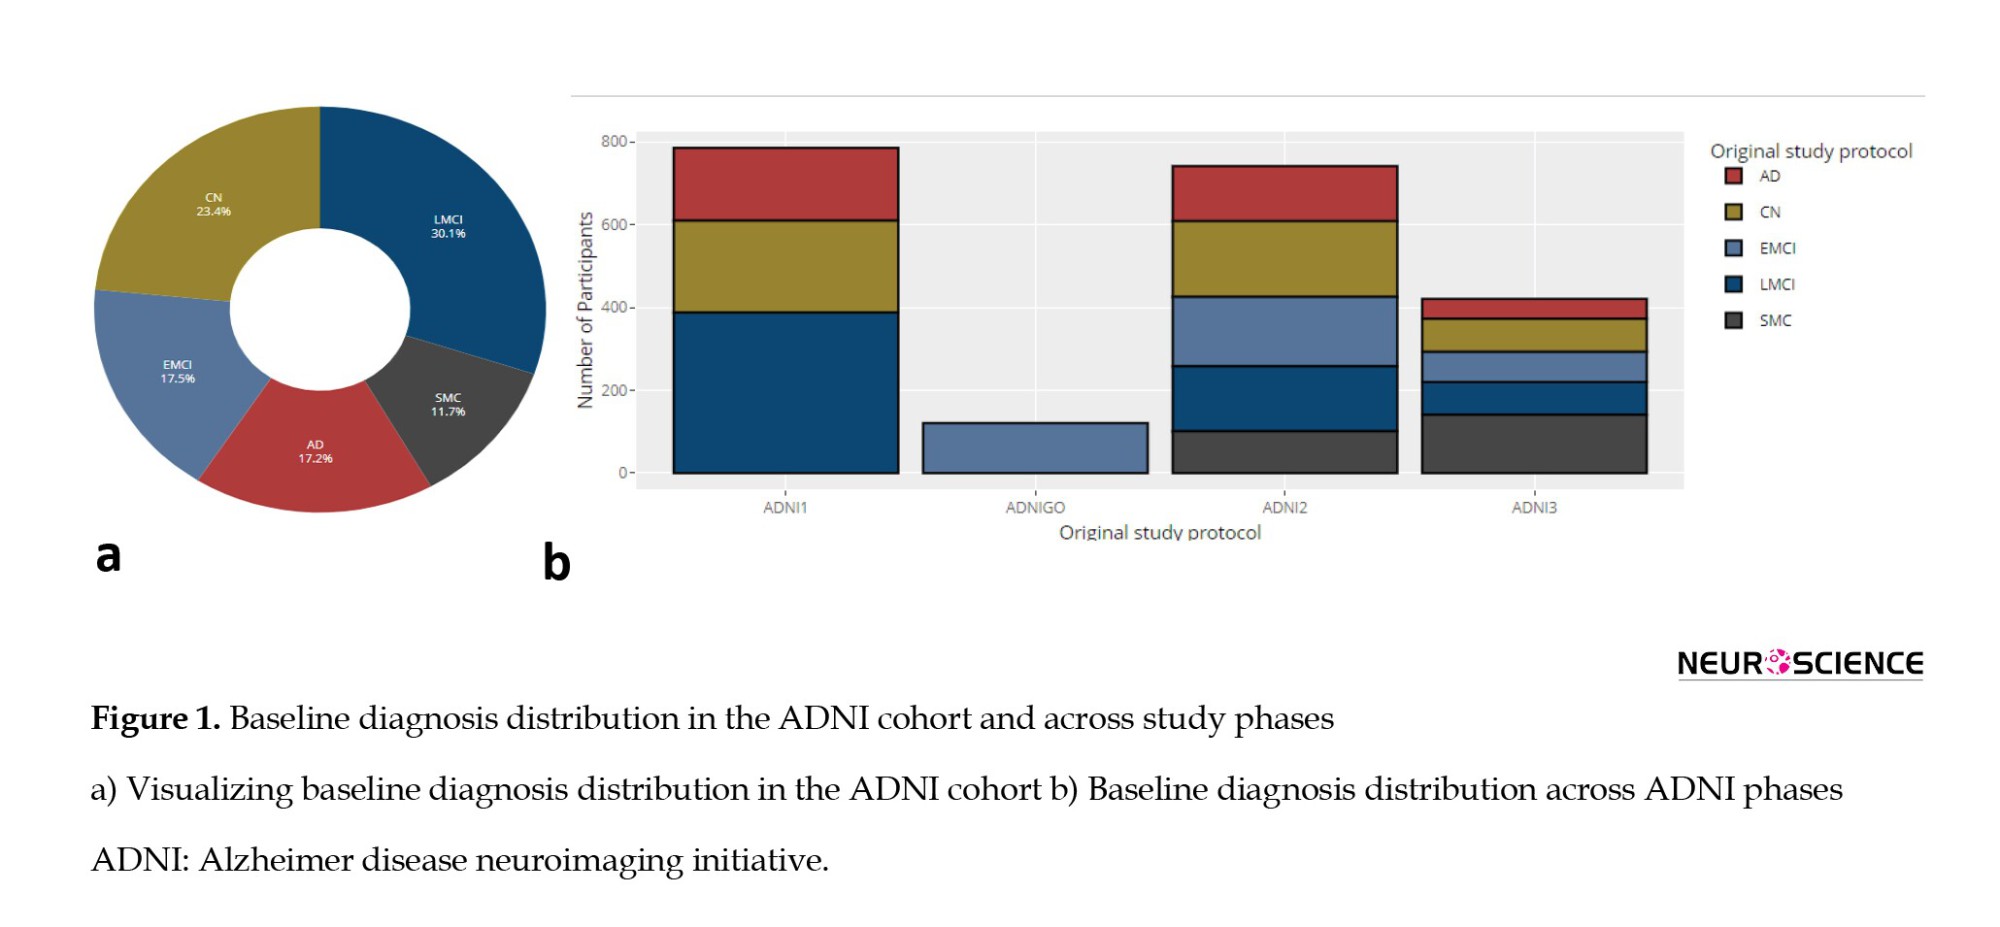
The baseline diagnoses of 2070 participants in the ADNI dataset include various cognitive states, with late MCI (LMCI) being the most prevalent diagnosis (624 individuals), followed by early mild cognitive impairment (EMCI) with 362 participants. LMCI and EMCI form the largest group of individuals with MCI, totaling 986 participants. Additionally, there are 485 individuals classified as cognitively normal (CN), 357 participants diagnosed with AD, and 242 participants with subjective memory concerns (SMC). Figure 1a illustrates these baseline diagnoses, providing essential context for understanding the cognitive states of participants, which is crucial for subsequent analyses of cognitive decline. Figure 1b shows how these baseline diagnoses are distributed across different ADNI phases: ADNI1 predominantly includes LMCI, CN, and AD diagnoses; ADNI2 has a broader distribution with significant numbers of EMCI, AD, and SMC cases; ADNI3 has a notable prevalence of SMC cases; and ADNIGO primarily features EMCI, underscoring the variability in diagnoses across the ADNI phases.
The progress of the visit for selected participants within the ADNI study is presented in Figure 2, which illustrates participant retention and transitions across various ADNI study phases. This Figure highlights the longitudinal participation of individuals starting from baseline in each ADNI phase (ADNI1, ADNIGO, ADNI2, ADNI3), showing how participants move through sequential visits over time. For example, ADNI1 initially enrolled 786 participants, and as the study progressed, a portion of these participants transitioned to subsequent phases such as ADNIGO, ADNI2, and ADNI3. ADNIGO began with 121 participants, ADNI2 with 742, and ADNI3 with 421. As the continuous lines indicate, the plot effectively visualizes participant follow-up within and across these phases. Larger, bolded dots represent baseline visits for each ADNI phase, while smaller points indicate follow-up visits over time. This figure underscores the continuity of the cohort and the attrition or retention of participants as they progress through the study phases.
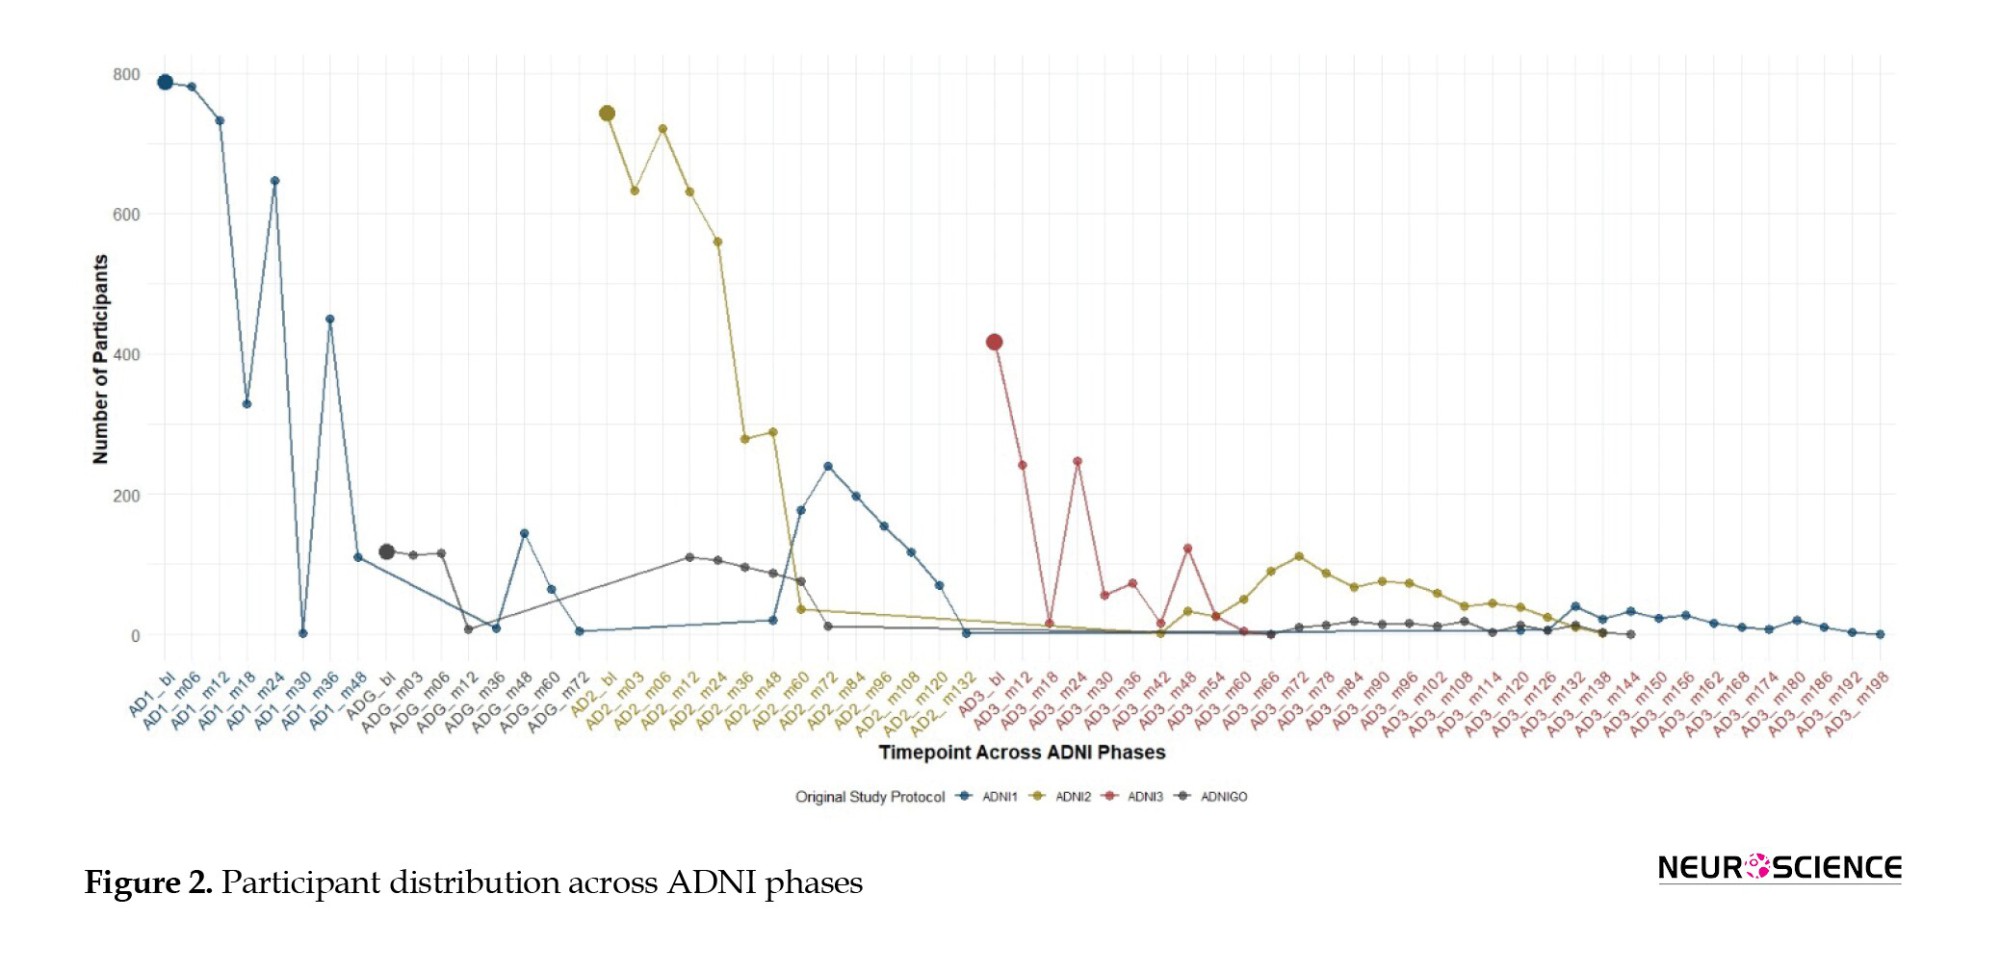
The x-axis represents time points for each phase (ADNI1, ADNIGO, ADNI2, ADNI3), with enrollment numbers of 819, 110, 730, and 410, respectively. Bold dots indicate baseline visits, while continuous lines track participant follow-up and transitions across phases, illustrating longitudinal retention.
Examining diagnosis conversions during participant visits in the ADNI study reveals notable patterns. The frequent transitions from MCI to MCI (3635 instances) and CN to CN (2971 instances) suggest prevalent stability in cognitive states across visits. These repeated transitions indicate that many participants remained in the same cognitive state over multiple visits, reflecting either the slow progression of the disease or a lack of significant change in their condition during the observation period. Additionally, the persistence of AD to AD transitions (1590 instances) underscores the stability of this cognitive state. Of particular interest is the MCI to dementia transition (419 instances), signifying a substantial progression in cognitive decline. Conversely, rare transitions, such as CN to dementia (6 cases) and dementia to CN (1 instance), raise concerns about potential reporting errors or misclassifications. NA values (1180 instances) further complicate the analysis, emphasizing the challenges in accurately categorizing cognitive changes.
ADNI group distinction: Categorizing cognitive progression paths
In this phase, we categorize participant groups within our dataset, explicitly focusing on individuals initially diagnosed with MCI. Within this subgroup, our attention is directed towards two distinct cohorts: Those who consistently maintain an MCI diagnosis throughout their visits and those who undergo a conversion from MCI to AD. For the MCI to MCI group, we apply stringent criteria. Participants must have a minimum of one year’s worth of available data, ensuring a comprehensive temporal perspective. Furthermore, their diagnosis should remain MCI from baseline through all available records, precluding any transitions to alternative states such as normal cognition.
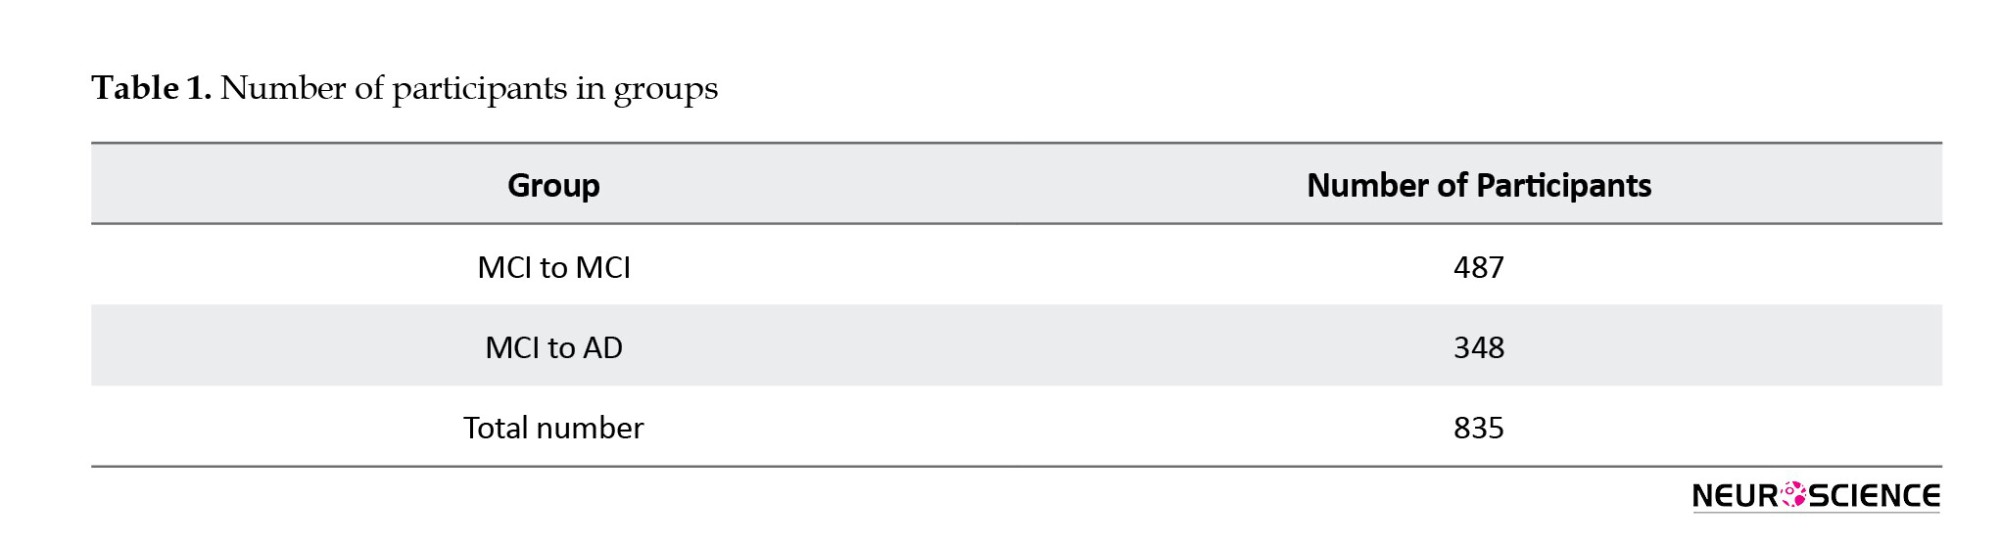
In contrast, the MCI to AD group was meticulously selected based on specific criteria, requiring participants to exhibit an MCI to dementia conversion and maintain a consistent diagnosis post-conversion. This approach aims to derive meaningful insights from the dataset regarding the trajectories and factors associated with these cognitive progression paths. Table 1 provides an overview of participants in various diagnostic transition groups, emphasizing the ‘MCI to MCI’ and ‘MCI to AD’ categories. These groups represent distinct cognitive progression paths, with the former indicating individuals who remained stable in the MCI category across visits and the latter depicting those who progressed from MCI to AD. The total number of participants included in the analysis is 835, with each category carefully selected based on specific criteria related to cognitive progression.
Defining stable and progressive MCI states: Precision in labeling for insights
In labeling the data for pMCI and sMCI, we shift our focus from participants to individual records, recognizing the multifaceted nature of participants’ cognitive trajectories. Within the MCI to MCI group, every record is uniformly designated as sMCI, irrespective of the duration of the participant’s visit. This ensures a consistent representation of the sustained MCI state for each recorded visit, even if the engagement extends beyond three years. On the other hand, for the MCI to AD group, a precise temporal criterion guides the labeling. Only records preceding the AD diagnosis and those within the 3-year window before the conversion event receive labels.
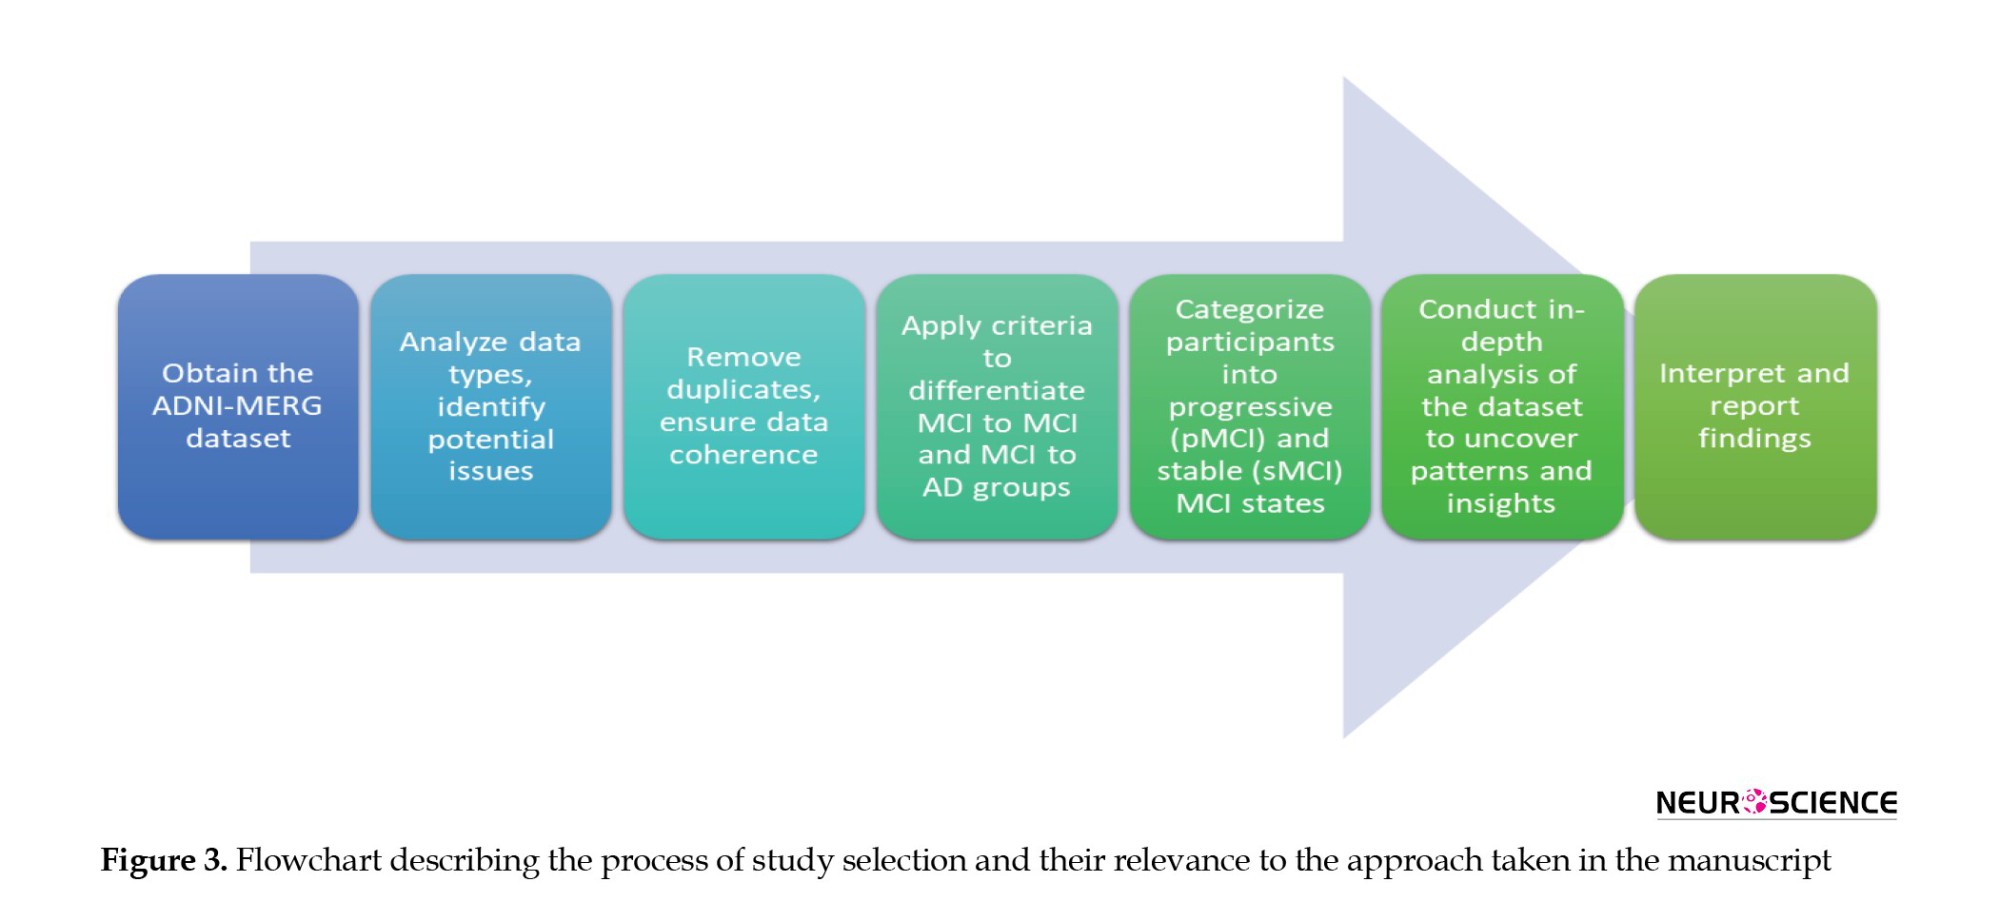
In conclusion, the comprehensive analysis of the ADNI-MERG dataset, from exploration and cleaning to the categorization of cognitive progression paths, is succinctly depicted in Figure 3, providing a visual representation of the intricate flow of our study.
Statistical analyses
In the statistical analysis, we utilized descriptive statistics such as distribution histograms and box plots to compare the cognitive impairment patterns between sMCI and pMCI groups. Employing the Wilcoxon test (Wilcoxon, 1992) in R version 4, we scrutinized differences in the AUC, setting a stringent significance level (alpha) at 0.005. Our hypothesis testing aimed to detect significant disparities in AUC, considering values approaching 1 indicate more statistically significant differences. Ethical considerations guided our research, ensuring informed consent within the ADNI, upholding strict privacy measures, and prioritizing participant confidentiality and welfare throughout the analysis.
3. Results
This section focuses on a comprehensive exploration of the ADNI-MERGE dataset, specifically examining patterns and differences between individuals diagnosed with sMCI and pMCI. Our approach involves meticulous labeling and stratification of the dataset based on these diagnostic categories. The analysis is organized into five critical domains for understanding cognitive impairment: Demographics, PET imaging, genotyping, MRI brain analysis, and neurocognitive tests. We present the data through a comprehensive box plot figure to facilitate a clear and effective comparison between the sMCI and pMCI groups (Figure 4). This visualization illustrates the distribution of key variables across the two groups, highlighting the 5th to 95th percentiles and clearly depicting group mean differences and variability in each domain. These visual aids play a crucial role in revealing the differences across cognitive, imaging, and genetic measures, enhancing our understanding of the factors distinguishing sMCI from pMCI.
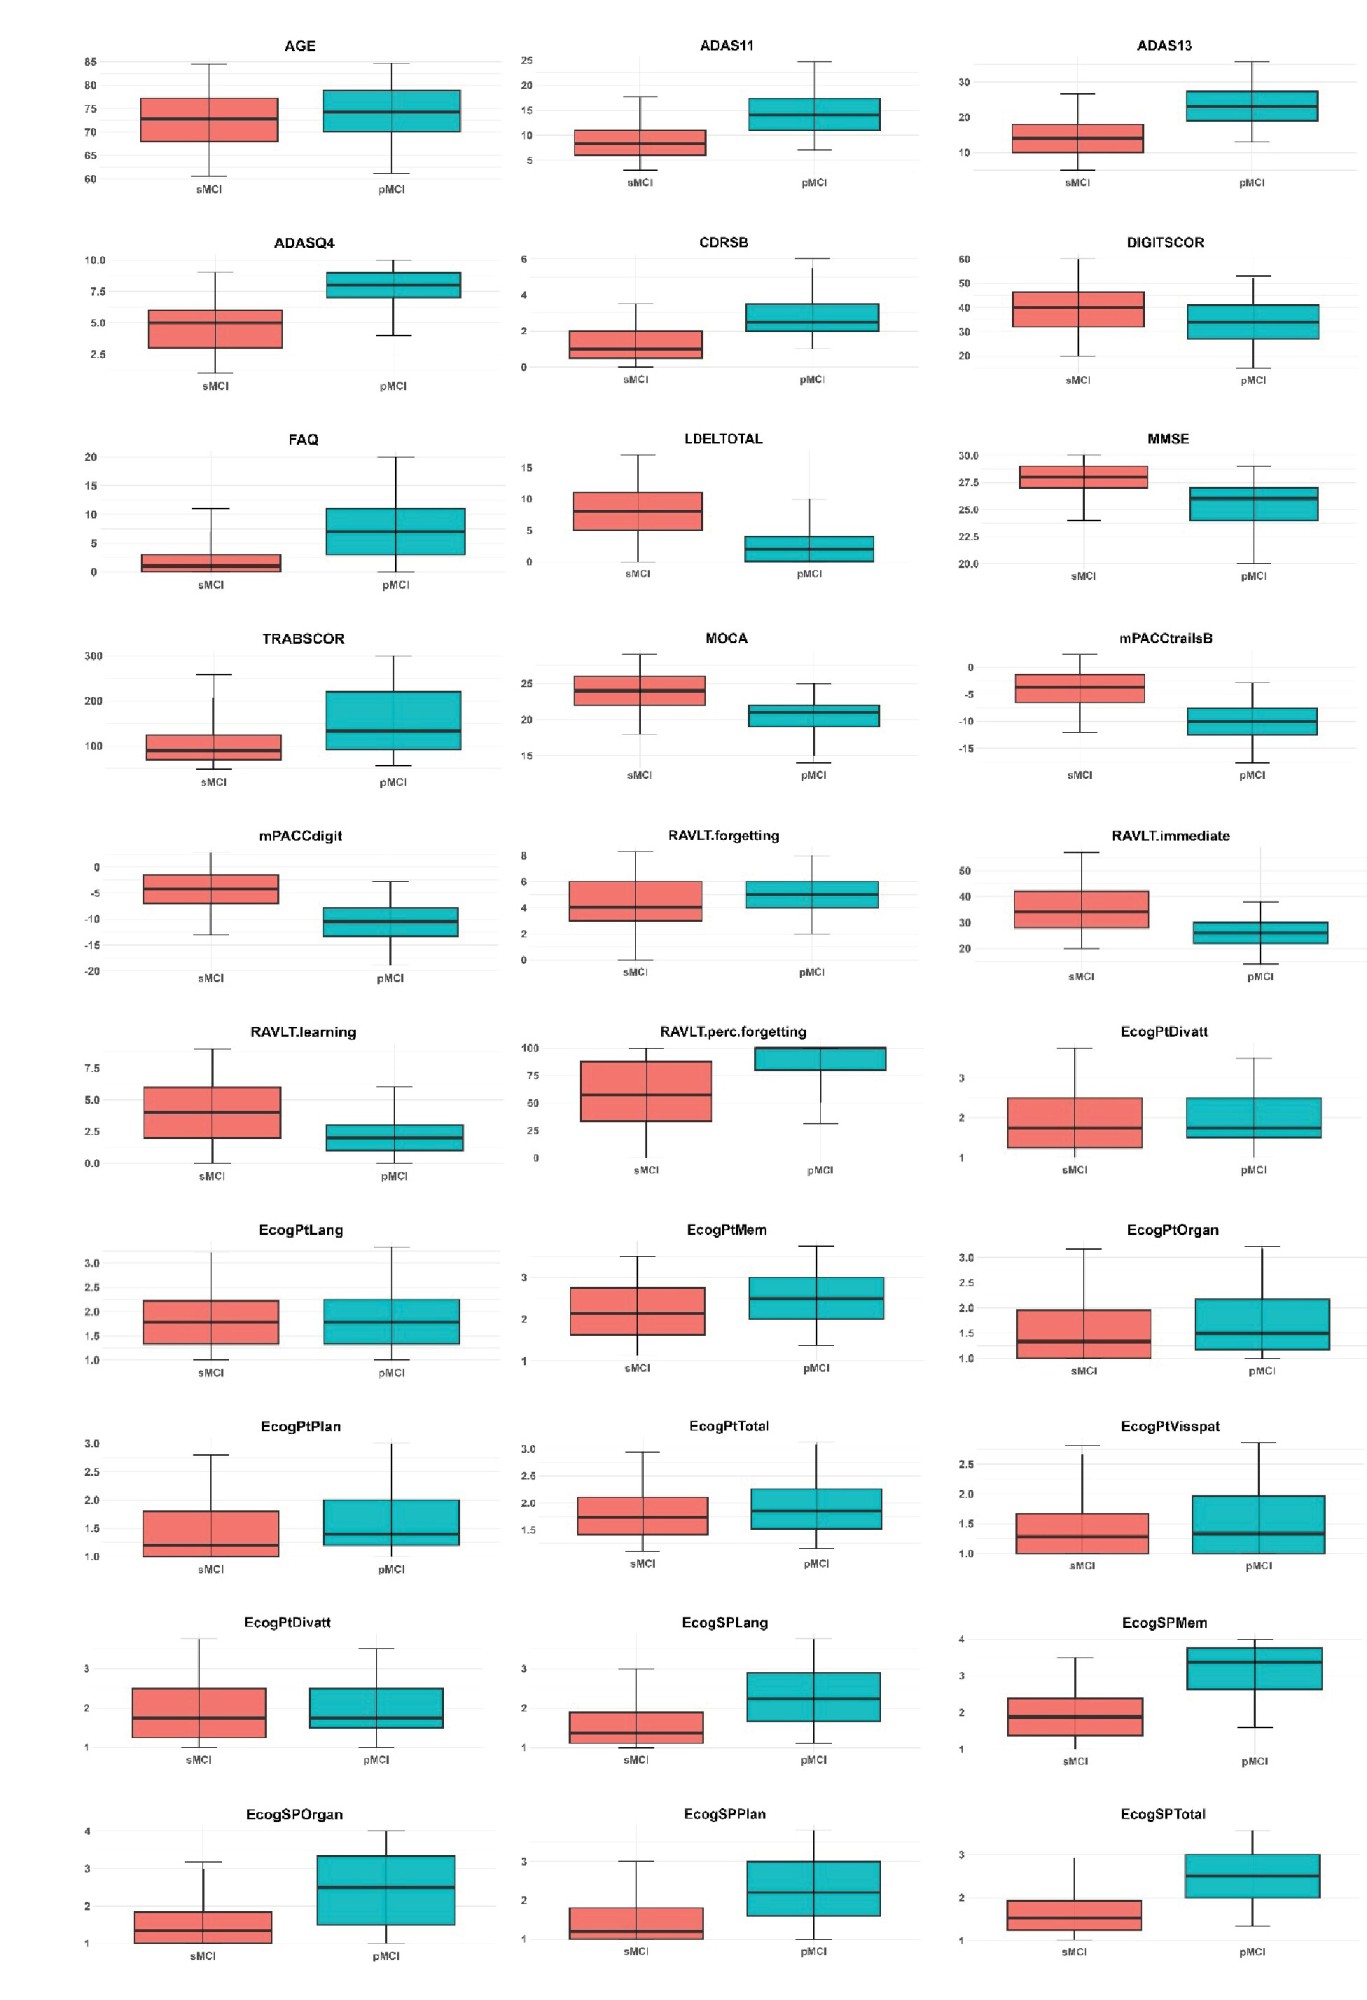
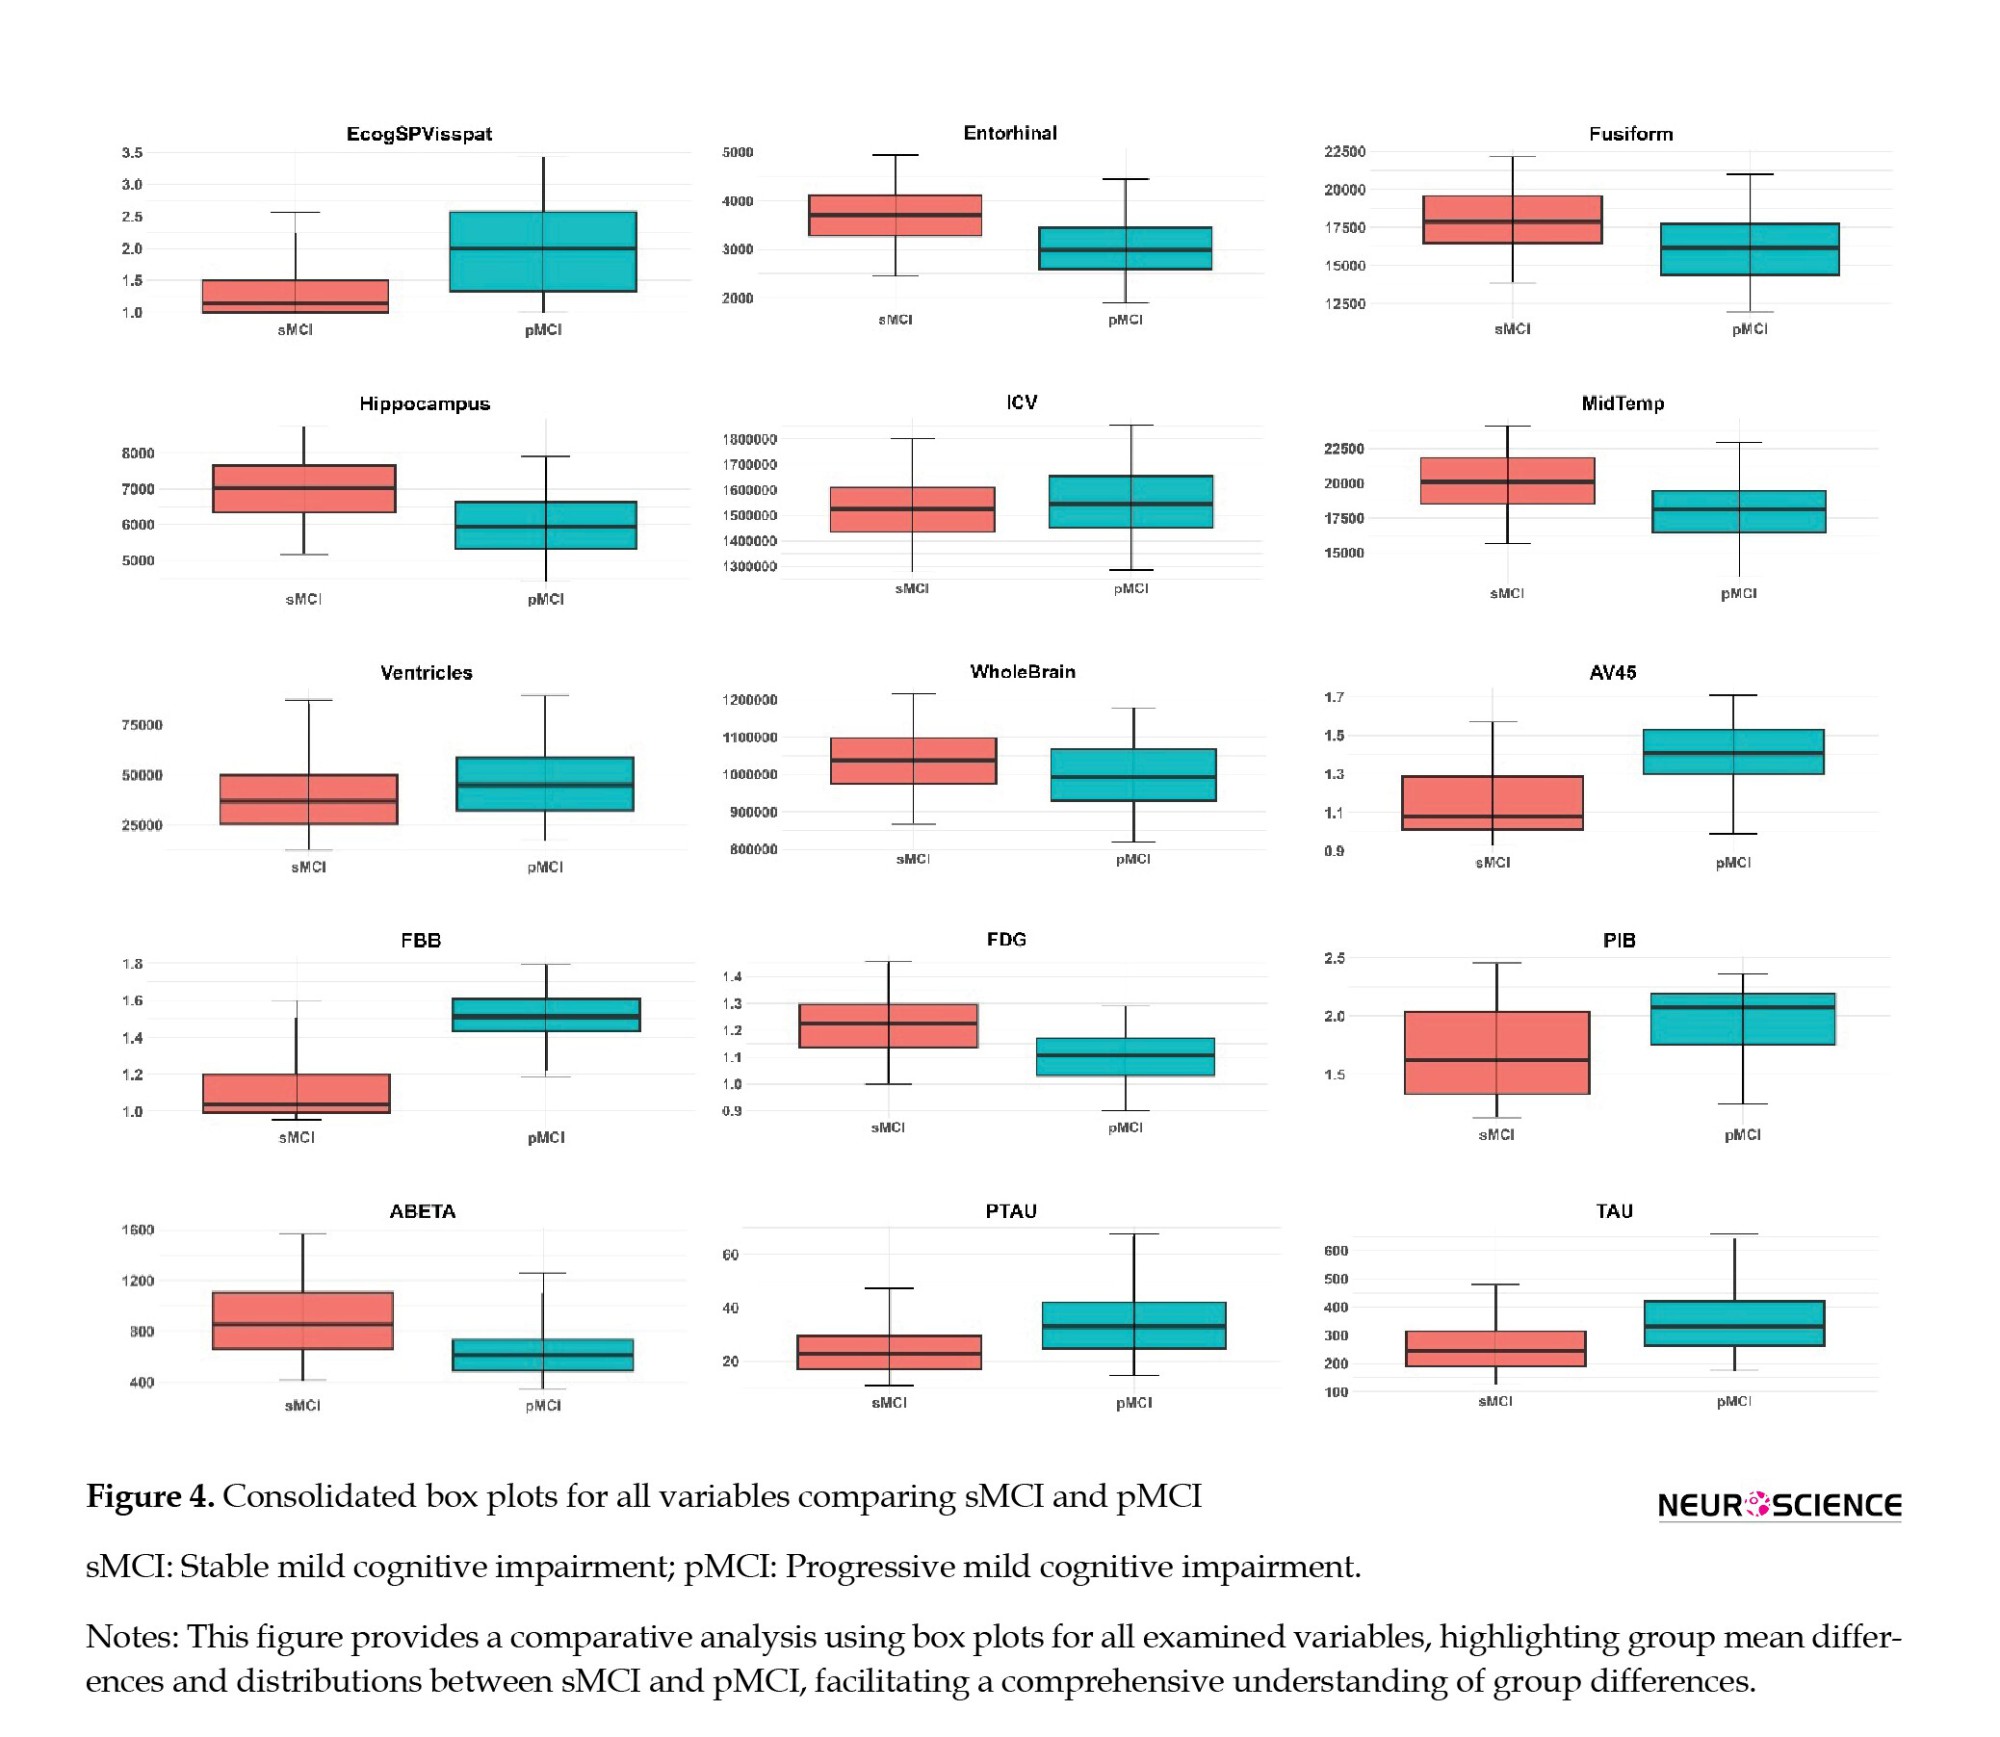
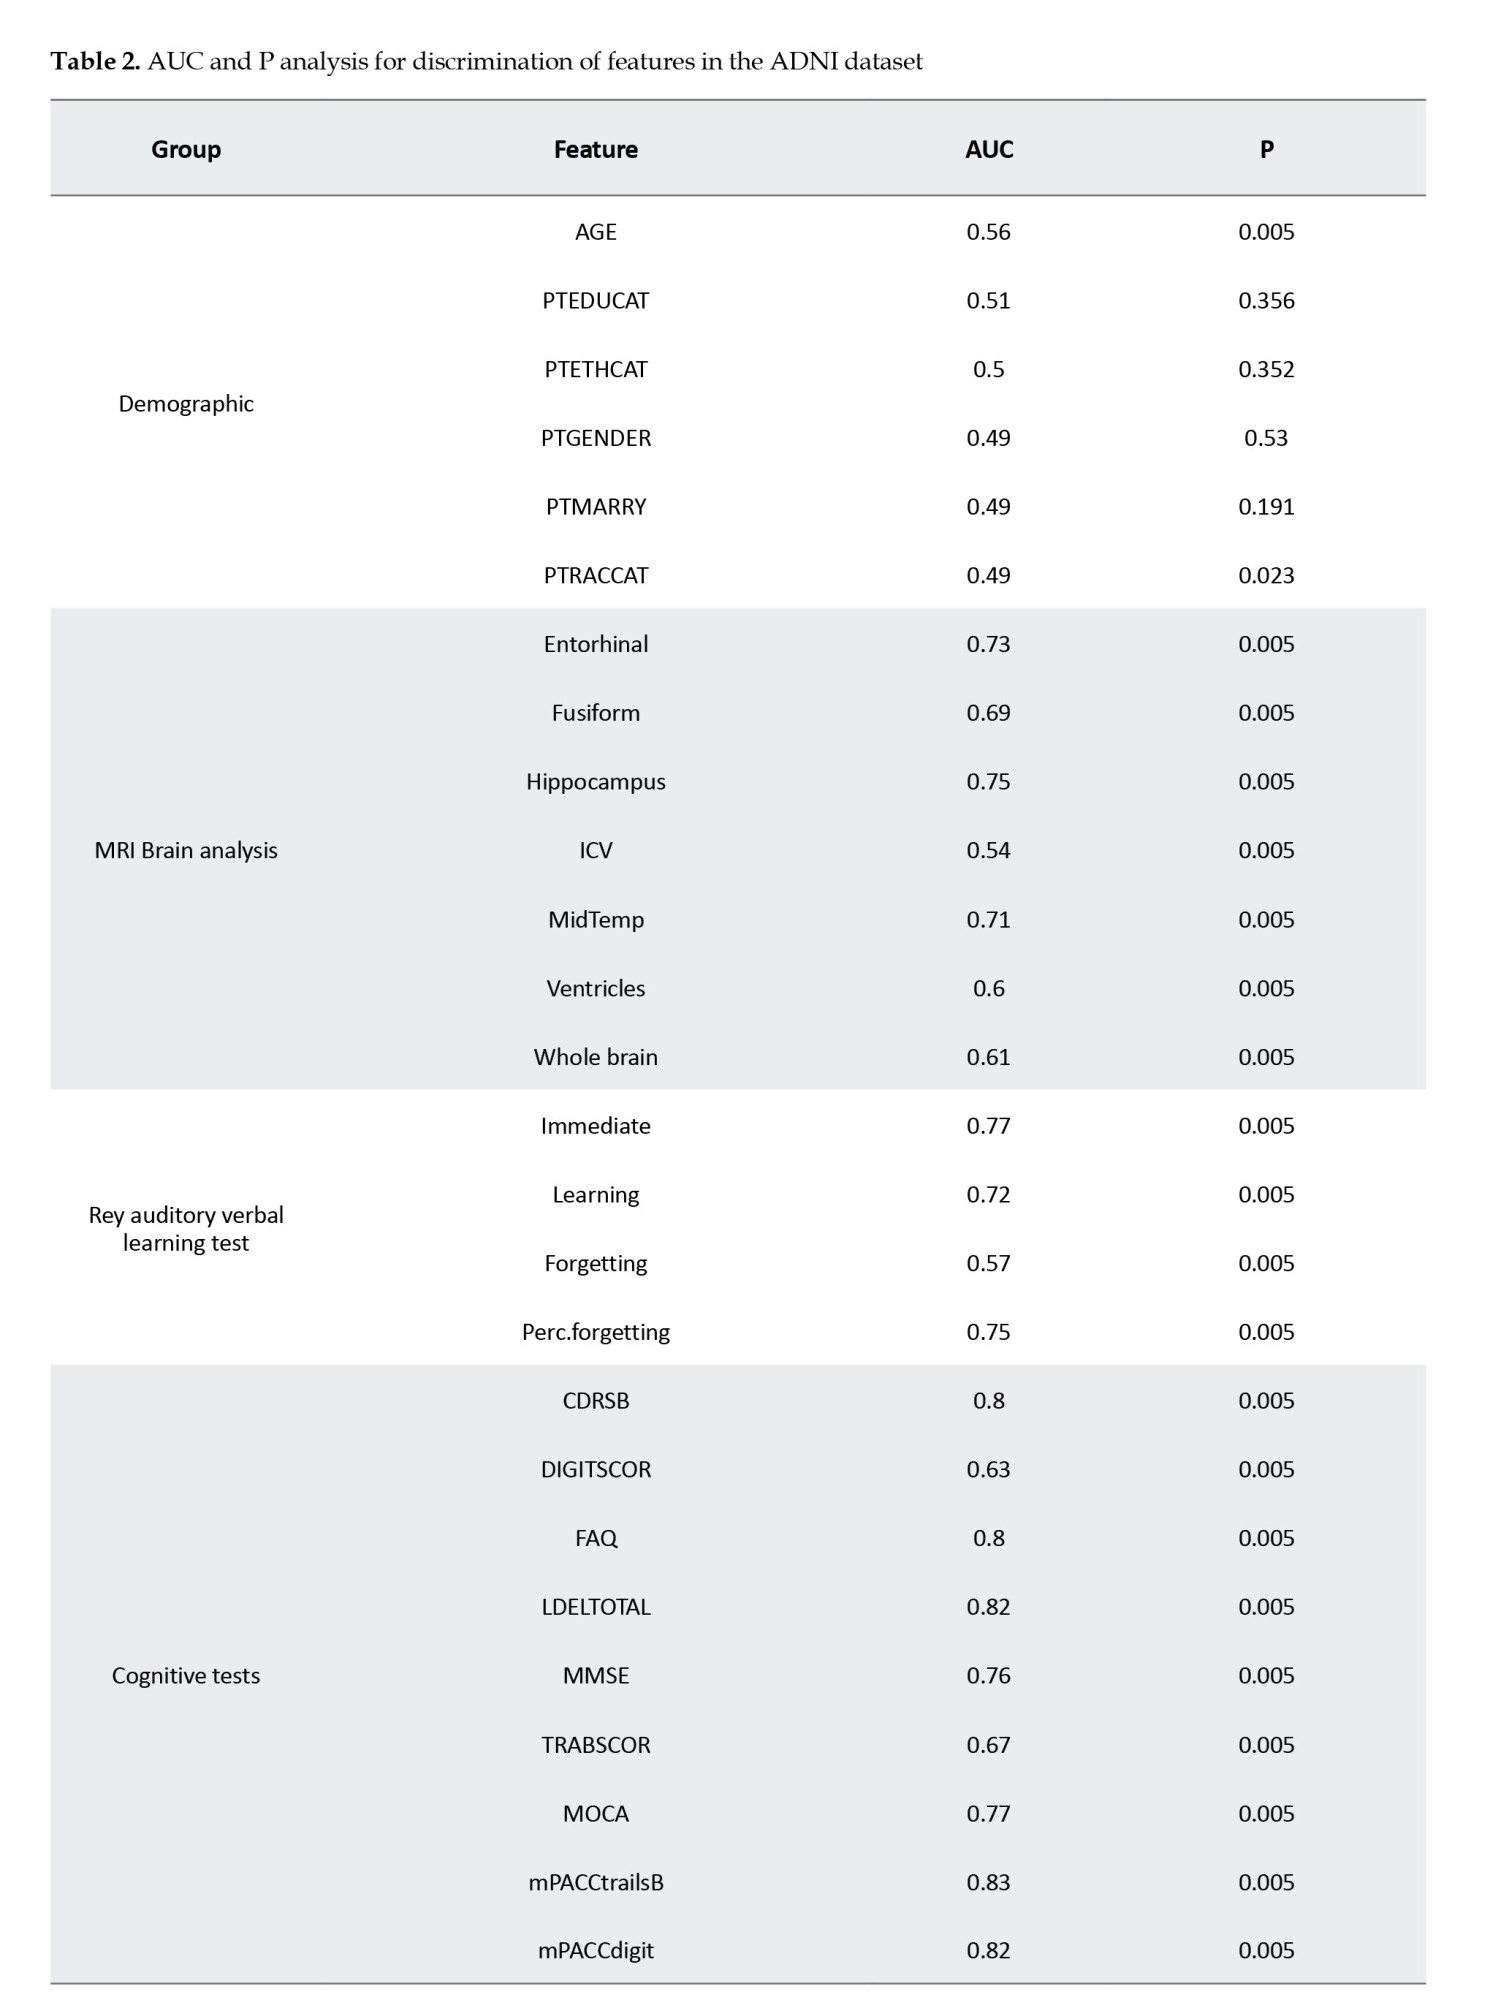
Following the box plot analysis, we present an extensive statistical evaluation in Table 2, which provides area under curve (AUC) values and corresponding P values for the key features in the dataset. This table highlights the discriminative power of clinical features between the sMCI and pMCI groups, particularly in cognitive assessments such as mPACCtrailsB, ADAS13, and LDELTOTAL, alongside memory-related tasks like RAVLT immediate and RAVLT learning. The high AUC values demonstrate the robust capability of these features to differentiate between cognitive statuses, reinforcing their relevance in understanding cognitive decline and its progression.
Abbreviations: AUC, area under curve; sMCI, stable mild cognitive impairment; pMCI, progressive mild cognitive impairment; ADNI, ADNI; AGE, age; PTEDUCAT, participant’s years of education; PTETHCAT, participant’s ethnic category; PTGENDER, participant’s gender; PTMARRY, participant’s marital status; PTRACCAT, participant’s racial categories; MRI, magnetic resonance imaging; ICV, intracranial volume; MidTemp, middle temporal gyrus; perc.forgetting, percent forgetting; CDRSB, clinical dementia rating- sum of boxes; DIGITSCOR, digit symbol substitution test; FAQ, functional assessment questionnaire; LDELTOTAL, logical memory delayed recall total score; MMSE, mini-mental state examination; TRABSCOR, trail making test-B-score; MOCA, Montreal cognitive assessment; mPACCtrailsB, ADNI-modified preclinical Alzheimer cognitive composite with trails B; mPACCdigit, ADNI-modified preclinical Alzheimer cognitive composite with digit symbol substitution; EcogPtMem, everyday cognition test participant memory test; EcogPtLang, everyday cognition test participant language test; EcogPtVisspat, everyday cognition test participant visual-spatial test; EcogPtPlan, everyday cognition test participant planning test; EcogPtOrgan, everyday cognition test participant organization test; EcogPtDivatt, everyday cognition test participant divided attention test; EcogPtTotal, everyday cognition test participant total test mean score; EcogSPMem, everyday cognition test study partner memory test; EcogSPLang, everyday cognition test study partner language test; EcogSPVisspat, everyday cognition test study partner visual-spatial test; EcogSPPlan, everyday cognition test study partner planning test; EcogSPOrgan, everyday cognition test study partner organization test; EcogSPDivatt, everyday cognition test study partner divided attention test; EcogSPTotal, everyday cognition test study partner total test mean score; ADAS, AD assessment scale; ABETA, amyloid β peptide; PTAU, blood phosphorylated tau; TAU, total tau; PET, positron emission tomography; AV45, florbetapir; FBB, florbetaben; FDG, fluorodeoxyglucose; PIB, Pittsburgh compound B.
The subsequent sections will explore the detailed findings for each domain, discussing the specific results and their implications for differentiating between sMCI and pMCI while providing insights into potential early markers of Alzheimer’s disease. In the cognitive assessment domain, a range of tests, including ADAS11, ADAS13, and ADASQ4, demonstrates significant potential in identifying individuals at risk for AD within the MCI spectrum. With AUC values of 0.80, 0.83, and 0.82, respectively, these tests effectively differentiate between sMCI and pMCI participants, with the pMCI group consistently showing higher median scores across the board. Other cognitive measures, such as mPACCdigit, mPACCtrailsB, FAQ, and LDELTOTAL, further highlight the divergence between the two groups, as evidenced by their non-overlapping distributions. Additionally, TRABSCOR, MMSE, CDRSB, and MOCA provide a clear separation between sMCI and pMCI cohorts, underscoring the value of these cognitive variables in differentiating individuals with varying degrees of cognitive impairment. The RAVLT group also reveals consistent disparities in cognitive function, with individuals in the pMCI group exhibiting greater forgetfulness, lower immediate recall, and more difficulty learning new information than those with sMCI.
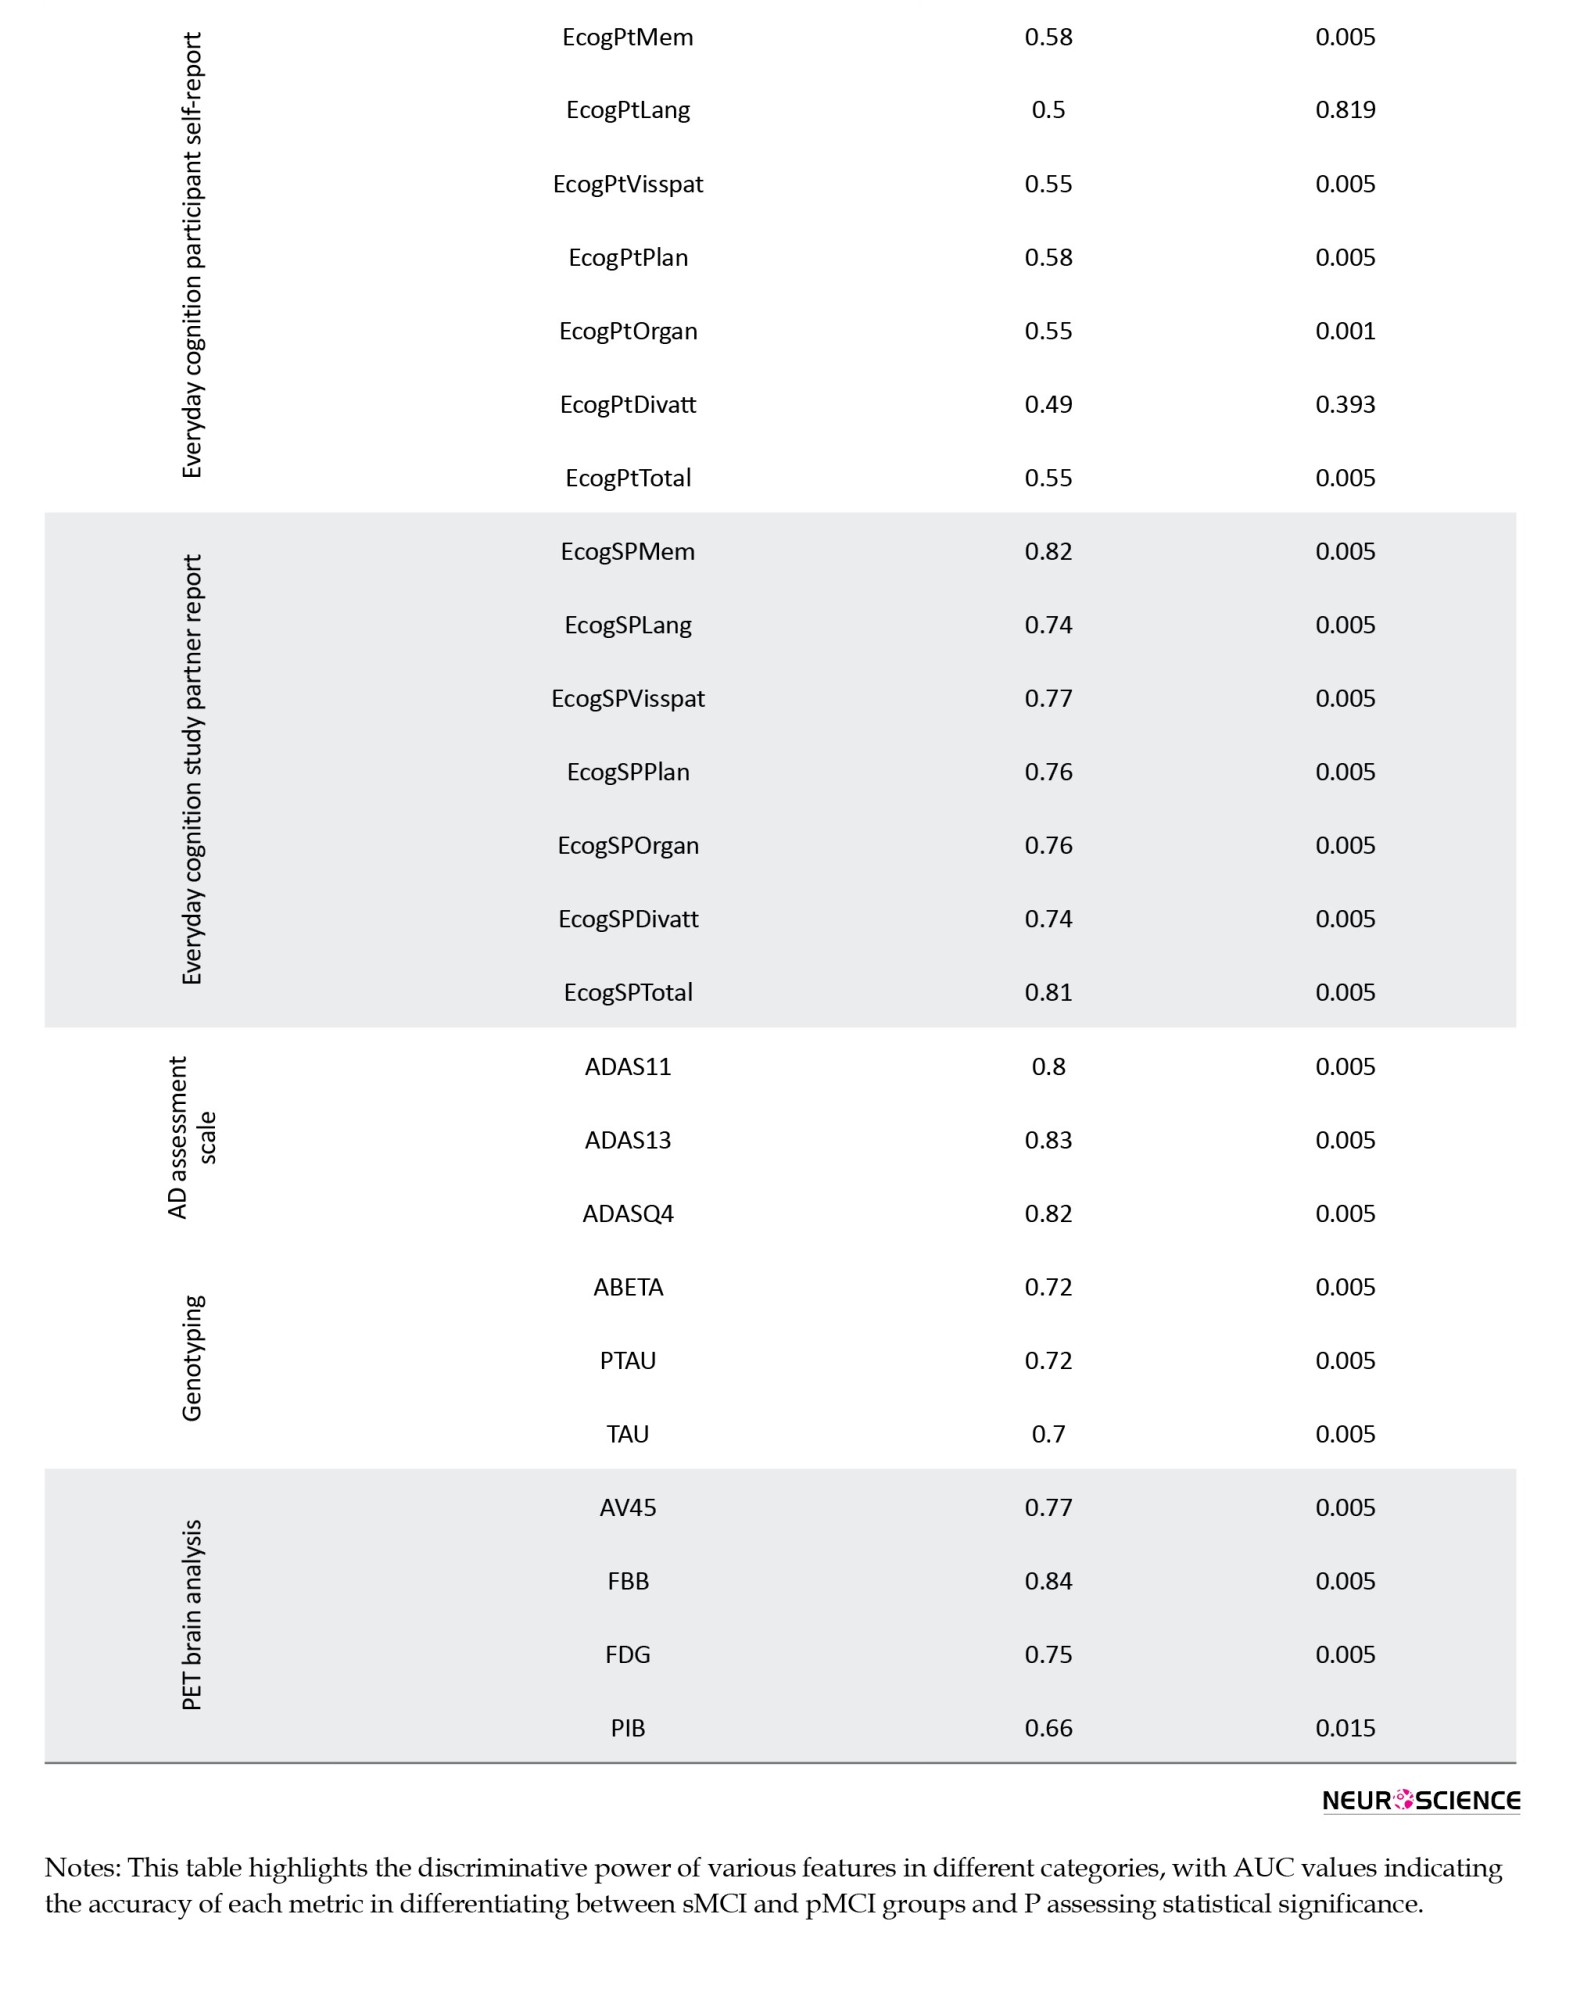
In the EcogPt assessments, individuals with sMCI report slightly better performance in memory, language, and planning than those with pMCI. While differences in organization, language, and divided attention are subtle, the overall cognitive functioning, reflected by EcogPtTotal, shows clearer distinctions between the groups. Study partner reports provide stronger evidence of cognitive impairments in individuals with pMCI across multiple domains than those with sMCI. AUC values for these assessments range from moderate to good accuracy, suggesting the utility of study partner evaluations in detecting cognitive decline. Both EcogPt and EcogSP total scores indicate cognitive difficulties in the pMCI group, though study partner reports exhibit greater sensitivity in identifying cognitive impairment.
Beyond cognitive tests, demographic analyses, PET imaging, genotyping, and MRI brain data offer additional insights. Demographic factors, such as age and PTEDUCAT, serve as moderate predictors of cognitive impairment, with AUC values of 0.56 and 0.51, illustrating their limited standalone predictive strength. PET imaging variables, particularly FBB and AV45, emerge as promising markers for distinguishing between sMCI and pMCI, with FBB scores elevated in the pMCI group and AV45 scores declining in the sMCI group, pointing to their utility in monitoring MCI progression. Genotyping variables, including ABETA, PTAU, and TAU, show consistent AUC values around 0.70-0.72, further supporting their relevance in cognitive impairment. Lastly, MRI brain analysis uncovers structural differences between the two groups, with higher Ventricles scores and lower Hippocampus scores in the pMCI group, suggesting potential structural changes associated with cognitive decline, particularly in midbrain regions.
We further employed the Wilcoxon rank-sum test to statistically compare AUC values >0.8 between different diagnostic groups. The results indicated that AUC values exceeding 0.8, with P<0.005, were significantly distinct, confirming meaningful differences in the discriminatory power of these features. Moreover, the statistical significance of these metrics, reflected in low P values, strengthens the confidence in their ability to differentiate between cognitive statuses. In conclusion, this comprehensive analysis highlights the broad range of features that contribute to identifying and differentiating cognitive status within the ADNI dataset, offering valuable insights for future research and potential clinical applications.
4. Discussion
Decoding ADNI-MERG: Patterns, implications, and cognitive assessment dynamics
This exhaustive exploration of the ADNI-MERG dataset aims to understand patterns among individuals diagnosed with sMCI and pMCI. Our methodology involved meticulous labeling and stratification, enabling a detailed analysis across various domains. Various studies, such as those by Hu et al. (2020), Gao et al. (2018), Hu et al. (2017), and Pandya et al. (2017), report varying ratios of MCI to AD progression (34%, 4%, 35%, and 17.5%, respectively). These disparities may stem from differences in diagnostic criteria, assessment processes, regional variations, and participant backgrounds. However, the collective emphasis on understanding MCI to AD progression underscores the significance of continuous research efforts in this critical domain. The intricate dynamics within the ADNI cohort highlight a nuanced landscape of cognitive decline. Assessments such as ADAS13, mPACCtrailsB, and FBB exhibit discriminative prowess, emphasizing the importance of diverse tools to capture distinct facets of cognitive impairment. While our analysis focuses on individual features, acknowledging the holistic nature of cognitive decline, it is noteworthy that some studies explore interactions among features, emphasizing the potential benefits of a more comprehensive evaluation (Berezuk et al., 2023; Morar et al., 2022). Furthermore, classifying MCI to AD participants into strong and weak categories provides an additional layer of insight, with the strong group representing cases of consistent AD progression and the weak group indicating fewer clear trajectories, which may warrant a focused analysis to understand differing contributing factors.
Comprehensive insights: Unraveling cognitive, demographic, imaging, and genetic factors in cognitive impairment
In our study, like previous research (Julayanont et al., 2014; Wang et al., 2022), MoCA and MMSE scores prove crucial in discerning MCI converters from non-converters. Our study aligns with a systematic review (Belleville et al., 2017) emphasizing the significance of cognitive tests, such as RAVLT, in predicting dementia with high sensitivity and specificity. The contrasting patterns in participant self-reports and study partner reports highlight the subjective nature of cognitive experiences, offering valuable insights into an individual’s perception of cognitive function. Despite modest AUC values for age (Bohlken et al., 2019), education (Aguilar-Navarro et al., 2017), and marriage status (Hu et al., 2020), our findings concur with established literature, affirming the influential roles of female sex and lower educational levels in facilitating conversion. Demographic factors, though playing a role, have limited standalone predictive strength. The combined influence of age and year of education underscores the intricate relationship between individual characteristics and broader cognitive trends.
Our study demonstrates a significant AUC value of 0.75 for FDG features, aligning with the emphasis on FDG’s pivotal role in MCI diagnosis and risk prediction in a related study (Caminiti et al., 2018). Nevertheless, in line with recommendations from another survey (Muscari et al., 2021), we recognize the imperative of judicious FDG-PET use, especially in cases with less certain risk. The inclusion of neuroimaging biomarkers, such as FBB from PET brain analysis and structural metrics from MRI brain analysis, adds a visual dimension to our understanding. FBB’s exceptional discriminative power suggests its potential as a key early detection marker, aligning with imaging techniques’ increasing importance in identifying cognitive impairment. The presence of white matter hyperintensities appears to be linked to dementia progression in older adults with MCI (Burke et al., 2019; Kamal et al., 2023). As illustrated by hippocampus 51 and entorhinal 41 in our study, the resilience of structural metrics aligns with observations from two supplementary studies. This coherence underscores the essential contribution of alterations in brain structures to cognitive status determination, establishing a pivotal link between neuroimaging and cognitive assessments. Specific genetic differences could influence the chances of MCI advancing to AD (Xiao et al., 2022). Genotyping variables, including ABETA, PTAU, and TAU, introduce a genetic layer to our exploration. Their consistent relevance implies a shared role in the development of cognitive impairment, suggesting a convergence of various factors contributing to the complexity of cognitive decline.
Navigating cognitive complexity for optimized clinical strategies
Comparing the various facets, it becomes clear that no single measure possesses universal discriminatory strength. Instead, a comprehensive understanding of cognitive decline emerges from combined insights from demographics, PET, genotyping, MRI, and neurocognitive tests. Integrating multiple modalities provides significant advantages, as it captures the diverse aspects of AD progression, making it more robust than relying solely on individual markers. FBB’s prominence in PET brain analysis and the collective strength of certain cognitive assessments indicate potential avenues for prioritizing markers in future diagnostic strategies. However, our approach also presents drawbacks, including the potential for increased complexity and the necessity for comprehensive data that may not always be available in all clinical settings. The need for integrating multiple data types, while advantageous for accuracy, also presents logistical challenges related to data availability, cost, and computational resources. From a clinical perspective, understanding the performance of specific tests in different groups enables targeted and informed decision-making. Clinicians can enhance predictive accuracy by prioritizing assessments with higher AUC values, exemplified by ADASQ4 and mPACCtrailsB. The distinction between strong and weak groups plays a pivotal role in the performance of machine learning models. Machine learning models should be trained and validated carefully, considering these nuances and incorporating a dynamic approach that accounts for the varying strengths of predictors. Focusing on specific features or subsets of the dataset, especially those from the strong group, may enhance model accuracy and reliability.
Additionally, addressing potential challenges the weak group poses, such as employing tailored imputation techniques or adjusting decision thresholds, could further improve the model’s predictive capabilities. In summary, the intricate relationships observed among various factors emphasize the necessity for a holistic approach to understanding and addressing cognitive decline. Integrating diverse assessments, along with a nuanced interpretation of subjective and objective measures, forms a foundation for developing targeted interventions and diagnostic strategies tailored to the unique profiles of individuals at different stages of cognitive impairment within the ADNI cohort. This work aims to enhance clinical decision-making through a deeper understanding of the predictive power of various markers and ultimately contribute to more personalized and effective treatment strategies for Alzheimer’s disease.
5. Conclusion
In conclusion, our exploration of the MCI to AD transition underscores the critical importance of a holistic perspective in understanding and addressing cognitive decline. By investigating data from multiple modules, including demographics, PET, genotyping, MRI, and neurocognitive tests within the ADNI cohort, we unveiled distinct cognitive patterns distinguishing sMCI from pMCI, encompassing 50 features. The investigation into AUC values for individual features across diverse groups sheds light on the nuanced predictive potential within the transition from MCI to AD. In the demographic group, features display modest predictive values, suggesting a limited impact of demographic factors on AD prediction, with AUC ranging from 0.49 to 0.56. The MRI and PET groups demonstrate diverse AUC ranges, substantiating their respective performances. The AUC spans from 0.54 to 0.75 in MRI features, with the hippocampus exhibiting the highest AUC value.
Meanwhile, PET features showcase an AUC range of 0.66 to 0.84, with FBB presenting the highest AUC value in this group. The genotyping group, including features like ABETA and PTAU, falls within an intermediate AUC range of 0.70 to 0.72. In neurocognitive tests, the ADAS group demonstrates robust predictive power (AUC range from 0.80 to 0.83). Diverse AUC values within the cognitive tests group, including CDRSB, FAQ, and mPACCtrailsB, collectively enhance predictive capability, with AUC ranging from 0.63 to 0.83. The RAVLT group shows moderate predictive capability, with AUC ranging from 0.57 to 0.77. EcogPT features align with modest predictive capability, with AUC ranging from 0.49 to 0.58. Conversely, the EcogSP group exhibits high individual predictive values, contributing to commendable performance, with AUC ranging from 0.74 to 0.82. Features with high individual predictive power, such as those from neurocognitive tests, including the ADAS, cognitive tests, EcogSP, and PET, play pivotal roles in enhancing the overall predictive capability of their respective groups. However, it is essential to note that not all groups exhibit equally strong predictive capabilities. In particular, the demographic and EcogPT groups, characterized by lower individual predictive values, reflect a comparatively modest overall predictive performance. Consequently, this nuanced analysis underscores the varied contributions of different modalities, guiding a refined understanding of the complex interplay between diverse assessments in predicting the MCI to AD transition. These insights contribute to a refined sense of the intricate interplay between diverse assessments, guiding future research and personalized approaches for early AD diagnosis and intervention strategies.
Study limitations
It is crucial to recognize the constraints of our study. The modest sample sizes within specific groups may compromise the statistical power required for discerning significant differences, particularly in utilizing AUC for distinctions. As a result, the applicability of our findings to broader populations is circumscribed, necessitating further validation in more extensive cohorts.
Suggestions for future research
In future studies, a comprehensive strategy entails concurrently analyzing cognitive facets such as all ADAS features or RAVLT scores. Moreover, exploring synergies by combining factors across diverse cognitive dimensions could unveil valuable insights, while understanding the temporal evolution of this conversion process over time remains essential for enhancing our understanding of predictive markers for dementia.
Ethical Considerations
Compliance with ethical guidelines
All procedures performed in studies involving human participants were in accordance with the ethical standards of the institutional and or national research committee and with the 1964 Helsinki Declaration and its later amendments or comparable ethical standards. This study was approved by the Ethics Committee of Shahid Beheshti University of Medical Sciences, Tehran, Iran (Code: IR.SBMU.MSP.REC.1402.543). Informed consent was obtained from all participants in the study
Funding
This research was financially supported by Shahid Beheshti University of Medical Sciences, Tehran, Iran (Grant No.: 43007906). Data collection and sharing for this project were funded by ADNI (National Institutes of Health Grant U01 AG024904) and DOD ADNI (Department of Defense award number W81XWH-12-2-0012), with support from the National Institute on Aging, the National Institute of Biomedical Imaging and Bioengineering, and multiple industry and philanthropic contributors.
Authors' contributions
Conceptualization, study design, investigations and writing: All authors; Supervision: Ahmad Shalbaf; Data collection, analysis, and interpretation: Soheil Zarei, Project administration: Ahmad Shalbaf and Reza Shalbaf; Final approval: Soheil Zarei.
Conflict of interest
The authors declared no conflict of interest.
Acknowledgments
The authors would like to express their gratitude to the Alzheimer’s Disease Neuroimaging Initiative (ADNI) for providing access to the dataset used in this study. The authors also extend their appreciation to the research staff and clinicians involved in data collection. Special thanks to colleagues at the Institute for Cognitive Science Studies and Shahid Beheshti University of Medical Sciences for their valuable discussions and feedback. Finally, they appreciate the contributions of all study participants and their families for their involvement in this important research.
References
Aguilar-Navarro, S. G., Mimenza-Alvarado, A. J., Ávila-Funes, J. A., Juárez-Cedillo, T., Bernal-López, C., & Hernández-Favela, C. G. (2017). Clinical and demographic predictors of conversion to dementia in Mexican elderly with mild cognitive impairment. Revista de Investigacion Clinica; Organo del Hospital de Enfermedades de la Nutricion, 69(1), 33–39. [DOI:10.24875/ric.17002064] [PMID]
Panpalli Ates, M., & Yilmaz Can, F. (2020). Which factors can we control the transition from mild cognitive impairment to dementia? Journal of Clinical Neuroscience: Official Journal of the Neurosurgical Society of Australasia, 73, 108–110. [DOI:10.1016/j.jocn.2020.01.015] [PMID]
Badhwar, A., McFall, G. P., Sapkota, S., Black, S. E., Chertkow, H., & Duchesne, S., et al. (2020). A multiomics approach to heterogeneity in Alzheimer’s disease: Focused review and roadmap. Brain: A Journal of Neurology, 143(5), 1315–1331. [DOI:10.1093/brain/awz384] [PMID]
Belleville, S., Fouquet, C., Hudon, C., Zomahoun, H. T. V., Croteau, J., & Consortium for the Early Identification of Alzheimer’s disease-Quebec (2017). Neuropsychological measures that predict progression from mild cognitive impairment to Alzheimer’s type dementia in older adults: A systematic review and meta analysis. Neuropsychology Review, 27(4), 328–353. [DOI:10.1007/s11065-017-9361-5] [PMID]
Berezuk, C., Khan, M., Callahan, B. L., Ramirez, J., Black, S. E., & Zakzanis, K. K., et al. (2023). Sex differences in risk factors that predict progression from mild cognitive impairment to Alzheimer’s dementia. Journal of the International Neuropsychological Society: JINS, 29(4), 360–368. [DOI:10.1017/S1355617722000297] [PMID]
Bohlken, J., Jacob, L., & Kostev, K. (2019). Progression of mild cognitive impairment to dementia in German specialist practices. Dementia (London, England), 18(1), 380–390. [DOI:10.1177/1471301216673919] [PMID]
Breton, A., Casey, D., & Arnaoutoglou, N. A. (2019). Cognitive tests for the detection of mild cognitive impairment (MCI), the prodromal stage of dementia: Meta analysis of diagnostic accuracy studies. International Journal of Geriatric Psychiatry, 34(2), 233-242. [DOI:10.1002/gps.5016] [PMID]
Burke, S. L., Hu, T., Fava, N. M., Li, T., Rodriguez, M. J., & Schuldiner, K. L., et al. (2019). Sex differences in the development of mild cognitive impairment and probable Alzheimer’s disease as predicted by hippocampal volume or white matter hyperintensities. Journal of Women & Aging, 31(2), 140-164. [DOI:10.1080/08952841.2018.1419476] [PMID]
Caminiti, S. P., Ballarini, T., Sala, A., Cerami, C., Presotto, L., & Santangelo, R., et al. (2018). FDG PET and CSF biomarker accuracy in prediction of conversion to different dementias in a large multicentre MCI cohort. NeuroImage. Clinical, 18, 167–177. [DOI:10.1016/j.nicl.2018.01.019] [PMID]
Drzezga, A., Lautenschlager, N., Siebner, H., Riemenschneider, M., Willoch, F., & Minoshima, S., et al. (2003). Cerebral metabolic changes accompanying conversion of mild cognitive impairment into Alzheimer’s disease: A PET follow up study. European Journal of Nuclear Medicine and Molecular Imaging, 30(8), 1104–1113. [DOI:10.1007/s00259-003-1194-1] [PMID]
Fei, M., & Jianhua, W. (2013). Apolipoprotein ε4 allele as a significant risk factor for conversion from mild cognitive impairment to Alzheimer’s disease: A meta analysis of prospective studies. Journal of Molecular Neuroscience, 50(2), 257–263.[DOI:10.1007/s12031-012-9934-y] [PMID]
Gabryelewicz, T., Styczynska, M., Luczywek, E., Barczak, A., Pfeffer, A., & Androsiuk, W., et al. (2007). The rate of conversion of mild cognitive impairment to dementia: Predictive role of depression. International Journal of Geriatric Psychiatry, 22(6), 563-567. [DOI:10.1002/gps.1716] [PMID]
Gao, Q., Gwee, X., Feng, L., Nyunt, M. S. Z., Feng, L., & Collinson, S. L., et al. (2018). Mild cognitive impairment reversion and progression: Rates and predictors in community living older persons in the Singapore Longitudinal Ageing Studies cohort. Dementia and Geriatric Cognitive Disorders Extra, 8(2), 226–237. [DOI:10.1159/000488936] [PMID]
GBD 2019 Dementia Forecasting Collaborators (2022). Estimation of the global prevalence of dementia in 2019 and forecasted prevalence in 2050: an analysis for the Global Burden of Disease Study 2019. The Lancet. Public health, 7(2), e105–e125. [DOI:10.1016/S2468-2667(21)00249-8]
Ghafoori, S., & Shalbaf, A. (2022). Predicting conversion from MCI to AD by integration of rs fMRI and clinical information using 3D convolutional neural network. International Journal of Computer Assisted Radiology and Surgery, 17(7), 1245-1255. [DOI:10.1007/s11548-022-02620-4] [PMID]
Hojjati, S. H., Babajani Feremi, A., & Alzheimer’s Disease Neuroimaging Initiative. (2022). Prediction and modeling of neuropsychological scores in Alzheimer’s disease using multimodal neuroimaging data and artificial neural networks. Frontiers in Computational Neuroscience, 15, 769982. [DOI:10.3389/fncom.2021.769982] [PMID]
Hu, C., Wang, L., Guo, Y., Cao, Z., Lu, Y., & Qin, H. (2020). Study of the risk and preventive factors for progress of mild cognitive impairment to dementia. American Journal of Alzheimer’s Disease & Other Dementias, 35, 1533317520925324. [DOI:10.1177/1533317520925324] [PMID]
Hu, C., Wang, L., Zhao, X., Zhu, B., Tian, M., & Qin, H. (2021). Investigation of risk factors for the conversion of mild cognitive impairment to dementia. The International Journal of Neuroscience, 131(12), 1173–1180. [DOI:10.1080/00207454.2020.1782905] [PMID]
Hu, C., Yu, D., Sun, X., Zhang, M., Wang, L., & Qin, H. (2017). The prevalence and progression of mild cognitive impairment among clinic and community populations: A systematic review and meta analysis. International Psychogeriatrics, 29(10), 1595-1608. [DOI:10.1017/S1041610217000473] [PMID]
Julayanont, P., Brousseau, M., Chertkow, H., Phillips, N., & Nasreddine, Z. S. (2014). Montreal Cognitive Assessment Memory Index Score (MoCA MIS) as a predictor of conversion from mild cognitive impairment to Alzheimer’s disease. Journal of the American Geriatrics Society, 62(4), 679-684. [DOI:10.1111/jgs.12742] [PMID]
Kamal, F., Morrison, C., Maranzano, J., Zeighami, Y., & Dadar, M. (2023). White matter hyperintensity trajectories in patients with progressive and stable mild cognitive impairment. Neurology, 101(8), e815-e824. [DOI:10.1212/WNL.0000000000207514] [PMID]
Lee, S. J., Ritchie, C. S., Yaffe, K., Stijacic Cenzer, I., & Barnes, D. E. (2014). A clinical index to predict progression from mild cognitive impairment to dementia due to Alzheimer’s disease. Plos One, 9(12), e113535. [DOI:10.1371/journal.pone.0113535] [PMID]
Leibing, A. (2014). The earlier the better: Alzheimer’s prevention, early detection, and the quest for pharmacological interventions. Culture, Medicine and Psychiatry, 38(2), 217–236.[DOI:10.1007/s11013-014-9370-2] [PMID]
Leifer, B. P. (2003). Early diagnosis of Alzheimer’s disease: Clinical and economic benefits. Journal of the American Geriatrics Society, 51(5 Suppl Dementia), S281–S288. [DOI:10.1046/j.1532-5415.5153.x] [PMID]
Li, X. X., & Li, Z. (2018). The impact of anxiety on the progression of mild cognitive impairment to dementia in Chinese and English data bases: A systematic review and meta analysis. International Journal of Geriatric Psychiatry, 33(1), 131-140. [DOI:10.1002/gps.4694] [PMID]
Lombardi, G., Crescioli, G., Cavedo, E., Lucenteforte, E., Casazza, G., & Bellatorre, A. G., et al. (2020). Structural magnetic resonance imaging for the early diagnosis of dementia due to Alzheimer’s disease in people with mild cognitive impairment. The Cochrane Database of Systematic Reviews, 3(3), CD009628. [DOI:10.1002/14651858.CD009628.pub2] [PMID]
Mirabnahrazam, G., Ma, D., Lee, S., Popuri, K., Lee, H., & Cao, J., et al. (2022). Machine learning based multimodal neuroimaging genomics dementia score for predicting future conversion to Alzheimer’s disease. Journal of Alzheimer's Disease: JAD, 87(3), 1345–1365. [DOI:10.3233/JAD-220021] [PMID]
Morar, U., Izquierdo, W., Martin, H., Forouzannezhad, P., Zarafshan, E., & Unger, E., et al. (2022). A study of the longitudinal changes in multiple cerebrospinal fluid and volumetric magnetic resonance imaging biomarkers on converter and non converter Alzheimer’s disease subjects with consideration for their amyloid beta status. Alzheimer’s & Dementia: Diagnosis, Assessment & Disease Monitoring, 14(1), e12258. [DOI:10.1002/dad2.12258] [PMID]
Mueller, S. G., Weiner, M. W., Thal, L. J., Petersen, R. C., Jack, C., Jagust, W., Trojanowski, J. Q., Toga, A. W., & Beckett, L. (2005). The Alzheimer's disease neuroimaging initiative. Neuroimaging clinics of North America, 15(4), 869–xii. [DOI: 10.1016/j.nic.2005.09.008] [PMID]
Muscari, A., Clavarino, F., Allegri, V., Farolfi, A., Macchiarulo, M., & Maestri, L., et al. (2021). "2-step MCI-AD": A simple scoring system to predict rapid conversion from mild cognitive impairment to Alzheimer dementia. Archives of Gerontology and geriatrics, 94, 104359.
Pandya, S. Y., Clem, M. A., Silva, L. M., & Woon, F. L. (2016). Does mild cognitive impairment always lead to dementia? A review. Journal of the Neurological Sciences, 369, 57-62. [DOI:10.1016/j.jns.2016.07.055] [PMID]
Pandya, S. Y., Lacritz, L. H., Weiner, M. F., Deschner, M., & Woon, F. L. (2017). Predictors of reversion from mild cognitive impairment to normal cognition. Dementia and Geriatric Cognitive Disorders, 43(3-4), 204–214. [DOI:10.1159/000456070] [PMID]
Petersen, R. C. (2004). Mild cognitive impairment as a diagnostic entity. Journal of Internal Medicine, 256(3), 183–194. [DOI:10.1111/j.1365-2796.2004.01388.x] [PMID]
Petersen, R. C. (2018). How early can we diagnose Alzheimer disease (and is it sufficient)?: The 2017 Wartenberg lecture. Neurology, 91(9), 395–402. [DOI:10.1212/WNL.0000000000006088] [PMID]
Petersen, R. C., Smith, G. E., Waring, S. C., Ivnik, R. J., Tangalos, E. G., & Kokmen, E. (1999). Mild cognitive impairment: Clinical characterization and outcome. Archives of Neurology, 56(3), 303-308. [DOI:10.1001/archneur.56.3.303] [PMID]
Platero, C., & Tobar, M. C. (2020). Longitudinal survival analysis and two group comparison for predicting the progression of mild cognitive impairment to Alzheimer’s disease. Journal of Neuroscience Methods, 341, 108698. [DOI:10.1016/j.jneumeth.2020.108698] [PMID]
Qiu, Y., Li, L., Zhou, T. Y., Lu, W., & Alzheimer's Disease Neuroimaging Initiative (2014). Alzheimer's disease progression model based on integrated biomarkers and clinical measures. Acta Pharmacologica Sinica, 35(9), 1111–1120. [DOI:10.1038/aps.2014.57] [PMID]
Risacher, S. L., & Saykin, A. J. (2013). Neuroimaging and other biomarkers for Alzheimer’s disease: The changing landscape of early detection. Annual Review of Clinical Psychology, 9, 621-648. [DOI: 10.1146/annurev-clinpsy-050212-185535] [PMID]
Rizzi, L., Rosset, I., & Roriz Cruz, M. (2014). Global epidemiology of dementia: Alzheimer’s and vascular types. BioMed Research International, 2014, 908915. [DOI:10.1155/2014/908915] [PMID]
Roberts, R. O., Knopman, D. S., Mielke, M. M., Cha, R. H., Pankratz, V. S., & Christianson, T. J., et al. (2014). Higher risk of progression to dementia in mild cognitive impairment cases who revert to normal. Neurology, 82(4), 317-325. [DOI:10.1212/WNL.0000000000000055] [PMID]
Song, Y. N., Wang, P., Xu, W., Li, J. Q., Cao, X. P., & Yu, J. T., et al. (2018). Risk factors of rapid cognitive decline in Alzheimer’s disease and mild cognitive impairment: A systematic review and meta analysis. Journal of Alzheimer’s Disease, 66(2), 497-515. [DOI:10.3233/JAD-180476] [PMID]
Sörensen, A., Blazhenets, G., Rücker, G., Schiller, F., Meyer, P. T., & Frings, L., et al. (2019). Prognosis of conversion of mild cognitive impairment to Alzheimer’s dementia by voxel wise Cox regression based on FDG PET data. NeuroImage. Clinical, 21, 101637. [DOI:10.1016/j.nicl.2018.101637] [PMID]
Tan, E. Y. L., Köhler, S., Hamel, R. E. G., Muñoz-Sánchez, J. L., Verhey, F. R. J., & Ramakers, I. H. G. B. (2019). Depressive symptoms in mild cognitive impairment and the risk of dementia: A systematic review and comparative meta analysis of clinical and community based studies. Journal of Alzheimer’s Disease, 67(4), 1319-1329. [DOI:10.3233/JAD-180513] [PMID]
Thaipisuttikul, P., Jaikla, K., Satthong, S., & Wisajun, P. (2022). Rate of conversion from mild cognitive impairment to dementia in a Thai hospital based population: A retrospective cohort. Alzheimer's & Dementia (New York, N. Y.), 8(1), e12272. [DOI:10.1002/trc2.12272] [PMID]
Tokuchi, R., Hishikawa, N., Kurata, T., Sato, K., Kono, S., & Yamashita, T., et al. (2014). Clinical and demographic predictors of mild cognitive impairment for converting to Alzheimer’s disease and reverting to normal cognition. Journal of the Neurological Sciences, 346(1-2), 288-292. [DOI:10.1016/j.jns.2014.09.012] [PMID]
Valizadeh, G., Elahi, R., Hasankhani, Z., Rad, H. S., & Shalbaf, A. (2024). Deep learning approaches for early prediction of conversion from MCI to AD using MRI and clinical data: A systematic review. Archives of Computational Methods in Engineering, 1-70. [Link]
Wang, M., Sajobi, T. T., Ismail, Z., Seitz, D., Chekouo, T., & Forkert, N. D., et al. (2022). A pragmatic dementia risk score for patients with mild cognitive impairment in a memory clinic population: Development and validation of a dementia risk score using routinely collected data. Alzheimer's & Dementia (New York, N. Y.), 8(1), e12301. [DOI:10.1002/trc2.12301] [PMID]
Wilcoxon, F. (1992). Individual comparisons by ranking methods. In S. Kotz & N.L. Johnson (Eds), Breakthroughs in Statistics: Methodology and Distribution (pp. 196-202). New York, NY: Springer New York. [Link]
Xiao, Q., Xi, J., Wang, R., Zhao, Q., Liang, X., & Wu, W., et al. (2022). The relationship between low density lipoprotein cholesterol and progression of mild cognitive impairment: The influence of rs6859 in PVRL2. Frontiers in Genetics, 13, 823406. [DOI:10.3389/fgene.2022.823406] [PMID]
Xue, H., Sun, Q., Liu, L., Zhou, L., & Liang, R., He, R., et al. (2017). Risk factors of transition from mild cognitive impairment to Alzheimer’s disease and death: A cohort study. Comprehensive Psychiatry, 78, 91-97. [DOI:10.1016/j.comppsych.2017.07.003] [PMID]
Alzheimer disease (AD), a severe form of dementia marked by rapid progression and profound cognitive impact, necessitates exploration of symptoms, rising incidence, diagnostic progress, and the urgent need for enhanced measures (Song et al., 2018). AD is exceptionally severe, progressing swiftly and often leading to fatality with profound cognitive impairment. Individuals with AD experience various symptoms, underscoring the pressing need for improved diagnostic, preventive, and therapeutic measures. The rising incidence of AD mirrors the demographic shift toward an aging population. Recent statistics indicate that approximately 5% to 10% of individuals aged 65 and above meet the criteria for AD (Rizzi et al., 2014). Projections suggest that a staggering 152 million people worldwide will be affected by 2050, underscoring the importance of understanding AD’s development and mechanisms (Nichols et al., 2022). Collaborative initiatives, exemplified by the AD neuroimaging initiative (ADNI) (Mueller et al., 2005), play a pivotal role in recruitment, assessment, and data management. ADNI’s comprehensive approach significantly advances our comprehension of AD, bridging the gap between epidemiological trends and the disease’s intricate neurobiological processes. Concurrently, AD diagnosis has progressed with implementing the international working group (IWG-2) 5 criteria, representing a delicate balance between biomarkers and clinical phenotypes. These criteria facilitate a nuanced understanding of the clinical heterogeneity inherent in AD (Badhwar et al., 2020). Integrating biomarkers and clinical features is especially critical in comprehending the phases of AD (Qiu et al., 2014), influencing the design and execution of clinical trials, and shaping treatment considerations.
In elucidating the critical role of early detection and precise risk prediction within AD research, there is an emphasis on recognizing mild cognitive impairment (MCI) as a pivotal prodromal stage. Within the intricate domain of AD investigation, this emphasis consistently revolves around the imperative need for early detection and precise risk prediction (Leibing, 2014; Petersen, 2018; Risacher & Saykin, 2013). The emphasis originates from the economic and clinical advantages of timely identification and intervention, signaling a paradigm shift towards proactive healthcare strategies (Leifer, 2003). Various scholarly discourses significantly contribute to this thematic exploration, converging on the challenging question of early AD diagnosis. This dialogue accentuates the importance of acknowledging MCI as a prodromal stage, representing a critical juncture in the temporal progression of AD (Breton et al., 2019; Petersen et al., 1999). MCI, distinguished by noticeable cognitive decline exceeding age-related expectations without significant interference with daily life, emerges as a pivotal phase in comprehending and detecting early AD symptoms (Petersen, 2004).
Identifying individuals with MCI susceptible to the progression to AD is crucial for timely intervention. Although MCI is not a deterministic condition precursor to dementia (Pandya et al., 2016) and even sometimes reverses to normal state (Roberts et al., 2014), the exploration of MCI to AD encompasses diverse modalities, including clinical/demographic factors (Tokuchi et al., 2014; Xue et al., 2017), positron emission tomography or magnetic resonance imaging (PET/MRI) analyses (Drzezga et al., 2003; Lombardi et al., 2020; Sörensen et al., 2019), genotyping (Fei & Jianhua, 2013), along with neurocognitive assessments (Hu et al., 2021; Thaipisuttikul et al., 2022), and psychosocial elements (Gabryelewicz et al., 2007; Li & Li, 2018; Tan et al., 2019). Each modality carries distinct advantages and limitations. Clinical/demographic factors provide valuable contextual information and play a pivotal role in diagnostic decision-making. PET/MRI analyses furnish high-resolution neuroimaging data, yet, despite yielding precise images, entail considerations of cost and radiation exposure. Genotyping offers insights into genetic underpinnings but may lack specificity. Neurocognitive assessments unravel cognitive profiles, although they may exhibit variability in reliability. The intricate interplay and potential synergy among these modalities introduce complexities, presenting unique challenges in comprehending the progression from MCI to AD. It is worth noting that, although our dataset does not directly assess psychosocial elements, we review relevant studies to ensure a comprehensive understanding of all features in our contextual analysis.
Embarking on a discussion of previous studies, Li and Li’s meta-analysis reveals a possible correlation between anxiety, AD biomarkers, and cognitive decline in MCI (Li & Li, 2018). However, the study faces challenges due to the lack of specificity in MCI subtypes and inconsistencies in operational and diagnostic criteria, posing difficulties in forming robust conclusions. This condition leads to an inherent limitation, as relying on reported measures rather than patient-administered assessments may result in false diagnostic assumptions (Li & Li, 2018). Transitioning to a different focus, Fei et al.’s literature synthesis integrates findings from 8 studies exploring the association between the APOE ε4-allele and the transition risk from MCI to AD (Fei & Jianhua, 2013). The meta-analysis underscores a heightened AD risk in amnestic MCI patients with the APOE ε4-allele. Despite the robust findings, the study acknowledges limitations, such as the need for larger sample sizes and additional family-based transmission/disequilibrium test studies. It also highlights potential publication bias from data sourced in English journals and the absence of family-based transmission/disequilibrium test studies. Shifting the focus to community-based follow-up surveys, Hu et al.’s study, spanning 17 communities, employed psychiatric medical staff with over 2 years of clinical experience, achieving a 43.8% follow-up rate (Hu et al., 2020). Challenges emerged as demographic differences surfaced among participants who were lost to follow-up. Among the 441 diagnosed with MCI, the study uncovered varied outcomes, with 17.5% progressing to dementia, 80.7% remaining stable, and 1.8% reverting to normal cognition. The findings also unveiled significant associations with diabetes, marital status, and occupational roles.
Continuing in a longitudinal context, Gabryelewicz et al. conducted an extensive study involving 105 individuals with MCI, subjecting them to comprehensive assessments and following up every 12 months (Gabryelewicz et al., 2007). Over the 3 years, the study observed a significant trend: Individuals identified with multiple-domains MCI displayed a notably increased likelihood of progressing to dementia, emphasizing the clinical significance of this classification. This shift in focus from community-based surveys to more targeted assessments contributes to a nuanced understanding of MCI progression. Shifting gears to a 6-year investigation, Ates and Can, observed 76 individuals aged 57 and above diagnosed with MCI (Ates & Can, 2020). The study’s results reveal that 44.7% progressed to dementia, while 55.3% maintained an MCI diagnosis. Noteworthy associations are found between dementia cases and advanced age, vascular diseases, and shorter education duration.
Additionally, patients with dementia exhibited a notably higher prevalence (94.1%) of vascular systemic diseases compared to those persisting with MCI. This prolonged study duration allows for a comprehensive examination of the factors influencing MCI outcomes. Transitioning to another longitudinal study by Xue et al., encompassing a 5-year biannual follow-up of 437 MCI patients (Xue et al., 2017), 24.3% progressed to AD. This study identified transition risk factors, including gender, age, reading habits, smoking, drinking, cerebrovascular disease, hyperlipidemia, and diabetes. Moreover, it highlighted education as a protective factor, while advanced age and the presence of cerebrovascular disease significantly influenced the transitions from MCI to AD and death. This nuanced exploration of various factors affecting MCI outcomes contributes to a richer understanding of the complexities involved. Finally, RO Roberts spearheaded a study involving thorough assessments of residents aged 70 to 89 (Roberts et al., 2014). This comprehensive evaluation covered demographic information, memory inquiries, clinical ratings, and neuropsychological tests. MCI classifications included amnestic and non-amnestic MCI, along with single- and multiple-domain MCI. Participants underwent assessments at 15-month intervals, uncovering an elevated risk of dementia in those with a history of MCI, particularly among women aged 80 to 89. This community-based approach, coupled with detailed assessments, provides a bridge between community-based surveys and more targeted clinical investigations, offering a holistic view of MCI progression.
Recent investigations have adopted multimodal strategies to predict AD progression by integrating neuroimaging, genetic data, and neurocognitive assessments, which closely aligns with our methodology of utilizing PET, MRI, genotyping, and neurocognitive tests to differentiate between stable MCI (sMCI) and progressive MCI (pMCI) (Hojjati et al., 2022; Mirabnahrazam et al., 2022; Platero & Tobar, 2020; Zhou et al., 2021). Techniques such as MRI have demonstrated efficacy in detecting structural and functional brain changes while incorporating MRI with genetic markers has significantly improved prediction accuracy for AD progression (Mirabnahrazam et al., 2022). Longitudinal studies combining structural MRI with neurocognitive assessments or PET biomarkers have also shown enhanced predictive capacity for neuropsychological outcomes (Hojjati et al., 2022; Platero & Tobar, 2020). Additionally, approaches to information with advanced methods, such as 3D-convolutional neural networks, have further refined the ability to predict conversion from MCI to AD (Ghafoori & Shalbaf, 2022). A systematic review of deep learning approaches shows how combining MRI and clinical data can yield early conversion predictions from MCI to AD (Valizadeh et al., 2024). Our study further extends this work by employing a robust statistical framework to comprehensively evaluate these multimodal features, underscoring the importance of integrated and longitudinal approaches for early diagnosis and targeted therapeutic interventions.
Concluding this integrated discussion, SJ Lee’s study utilizing data from the first phase of the ADNI (ADNI-1) cohort (ADNI)-1 focused on 382 participants with amnestic MCI (Lee et al., 2014). Over a 2.9-year follow-up, 46.9% progressed to probable AD. Factors influencing progression encompassed demographic, symptomatic, functional, and neuropsychiatric domains. Though less accurate than the full index with neuroimaging measures, the clinical index underscored the importance of their inclusion for heightened predictive precision. This transition from community-based assessments to more refined clinical investigations demonstrates the intricate interplay of factors influencing MCI outcomes, showcasing the complexity of predicting progression to dementia.
We employ an innovative approach, delving into various modules to foster a holistic understanding of the intricate interplay among demographics, PET, genotyping, MRI, and neurocognitive tests. This comprehensive exploration seeks to identify effective markers that distinguish participants into two cohorts: Those consistently maintaining an MCI diagnosis, termed sMCI, and those progressing from MCI to AD, known as pMCI. Each module serves as a unique lens for our investigation. Demographics enhance our understanding of prevalence and risk, PET sheds light on functional and metabolic nuances, genotyping delves into genetic and molecular realms, MRI unveils intricate structural details, and neurocognitive tests assess cognitive function. Our exhaustive statistical scrutiny rigorously evaluates the significance of these modalities, pinpointing their value in identifying AD within the spectrum of MCI. This holistic exploration, empowered by statistical methods, enables us to distill the most potent predictive markers, refining early detection strategies for AD. By navigating diverse modalities and conducting a nuanced analysis, our innovative investigation aims to uncover optimal predictors for AD within the context of MCI, contributing to a more profound comprehension of the disease and advancing early detection efforts.
2. Materials and Methods
ADNI: Cohort collaboration, data integration, and access protocols
The ADNI initiative stands as a groundbreaking collaborative effort, aiming to revolutionize our understanding of AD by advancing early diagnostic capabilities, standardizing data sharing, enhancing clinical trial methodologies, and fostering collaborative research endeavors. Integral to this initiative, the ADNI-MERG dataset plays a pivotal role in consolidating a diverse array of data into a unified repository. The manuscript’s framework provides efficient access to a comprehensive dataset, including demographic information, PET, genotyping, MRI, and neurocognitive assessments, minimizing the need for complex data integration. Each dataset entry corresponds to a participant’s visit across different ADNI phases, providing crucial details like participant ID, site visited, examination date, original study protocol, and data collection study protocol. Furthermore, the dataset includes extensive baseline data from all tests conducted during each participant’s visit, establishing a robust groundwork for focused exploration of patterns and relationships aligned with the study’s objectives. Accessing ADNI data involves submitting a formal request to the ADNI team and outlining research goals and methodologies. Following a thorough approval procedure, the ADNI team grants necessary permissions for data access.
Inside ADNI-MERG data: Exploration, cleaning, and trajectory insights
The ADNI-MERG dataset includes a comprehensive array of data types, with baseline (BL) fields extending beyond demographic information. Time-related fields, such as visit codes and examination dates, provide a longitudinal perspective, while “update_stamp” fields offer insights into the last modification of entries. The “DX” column indicates diagnostic categories, with “NA” denoting missing values, underscoring the need for careful analysis and prompting researchers to consider imputation techniques or exclusion criteria.
The dataset encompasses essential demographic variables, including AGE (mean age), PTEDUCAT (participant’s years of education), PTETHCAT (participant’s ethnic category), PTGENDER (participant’s gender), PTMARRY (participant’s marital status), and PTRACCAT (participant’s racial categories). Cognitive assessments comprise ADAS11 (11 items), ADAS13 (13 items), and ADASQ4 (cognitive subscale question 4) from the AD assessment scale (ADAS), along with CDRSB (clinical dementia rating - sum of boxes), DIGITSCOR (digit symbol substitution test), FAQ (functional assessment questionnaire), LDELTOTAL (logical memory I and II, delayed recall), MMSE (mini‐mental state examination), TRABSCOR (trail making test-B-score), MOCA (Montreal cognitive assessment), mPACCtrailsB (ADNI modified preclinical Alzheimer cognitive composite with trails B), and mPACCdigit (ADNI modified preclinical Alzheimer cognitive composite with digit symbol substitution). Also RAVLT.immediate (RAVLT immediate), RAVLT.learning (RAVLT learning), RAVLT.Forgetting (RAVLT Forgetting), and RAVLT.perc.forgetting (RAVLT percent forgetting) from the Rey auditory verbal learning test. Everyday cognition test participant self-report assessments encompass EcogPtMem (EcogPT memory test), EcogPtLang (EcogPT language test), EcogPtVisspat (EcogPT visual-spatial and perceptual abilities test), EcogPtPlan (EcogPT planning test), EcogPtOrgan (EcogPT organization test), EcogPtDivatt (EcogPT divided attention test), and EcogPtTotal (EcogPT total test mean score). Additionally, EcogSPMem (EcogSP memory test), EcogSPLang (EcogSP language test), EcogSPVisspat (EcogSP visual-spatial and perceptual abilities test), EcogSPPlan (EcogSP planning test), EcogSP organ (EcogSP organization test), EcogSPDivatt (EcogSP divided attention test), and EcogSPTotal (EcogSP total test mean score) represent assessments from the everyday cognition study partner report. PET and genotype features encompass AV45 (florbetapir), FBB (florbetaben), FDG (fluorodeoxyglucose), PIB (Pittsburgh compound B), APOE4 (apolipoprotein E), ABETA (amyloid β peptide), PTAU (blood phosphorylated tau), and total tau (TAU). Brain region volume measurements include Entorhinal (entorhinal cortex), fusiform (fusiform gyrus), hippocampus, ICV (intracranial volume), MidTemp (middle temporal gyrus), ventricles (brain ventricles), and whole brain.
The meticulous preparation of the dataset involved a rigorous data-cleaning process to enhance its quality and relevance. Duplicate entries were systematically eradicated using participant ID (RID) and visit code as distinctive identifiers to guarantee the distinctiveness of each participant’s visit. Coherence was enhanced by excluding subjects lacking a diagnosis, while the omission of participants with a solitary diagnosis enriched dataset diversity and encompassed a broader spectrum of diagnostic transitions. The exclusion of rows with complete missing values was essential to maintain the accuracy and integrity of the data set. These judiciously applied criteria contribute to a meticulously curated dataset, void of redundancies, including participants with significant diagnostic information, and devoid of incomplete or uninformative entries, aligning with the study’s precise goals and analytical requisites. Significant work on the ADNI-MERG dataset included the implementation of enhancements to enrich the understanding of participant trajectories and diagnostic alterations within the ADNI study. These updates provided an in-depth insight into participant involvement and diagnostic shifts, introducing additional metrics such as visit frequency, participant engagement duration, and unique visit identifiers. This condition enriched the dataset and expanded the ability to assess participant progressions thoroughly. Incorporating group labels to identify transitions between diagnostic states and records of diagnosis conversions significantly fortified the dataset’s capability to capture and illuminate the intricacies of participants’ diagnostic changes. Notably, categorizing participants into progressive and stable MCI groups provided a more refined analysis of participant paths and their diagnostic alterations throughout their involvement in the study, which is discussed in detail later.
Exploring ADNI data dynamics: In-depth analysis and visualization
The baseline diagnoses of 2070 participants in the ADNI dataset include various cognitive states, with late MCI (LMCI) being the most prevalent diagnosis (624 individuals), followed by early mild cognitive impairment (EMCI) with 362 participants. LMCI and EMCI form the largest group of individuals with MCI, totaling 986 participants. Additionally, there are 485 individuals classified as cognitively normal (CN), 357 participants diagnosed with AD, and 242 participants with subjective memory concerns (SMC). Figure 1a illustrates these baseline diagnoses, providing essential context for understanding the cognitive states of participants, which is crucial for subsequent analyses of cognitive decline. Figure 1b shows how these baseline diagnoses are distributed across different ADNI phases: ADNI1 predominantly includes LMCI, CN, and AD diagnoses; ADNI2 has a broader distribution with significant numbers of EMCI, AD, and SMC cases; ADNI3 has a notable prevalence of SMC cases; and ADNIGO primarily features EMCI, underscoring the variability in diagnoses across the ADNI phases.
The progress of the visit for selected participants within the ADNI study is presented in Figure 2, which illustrates participant retention and transitions across various ADNI study phases. This Figure highlights the longitudinal participation of individuals starting from baseline in each ADNI phase (ADNI1, ADNIGO, ADNI2, ADNI3), showing how participants move through sequential visits over time. For example, ADNI1 initially enrolled 786 participants, and as the study progressed, a portion of these participants transitioned to subsequent phases such as ADNIGO, ADNI2, and ADNI3. ADNIGO began with 121 participants, ADNI2 with 742, and ADNI3 with 421. As the continuous lines indicate, the plot effectively visualizes participant follow-up within and across these phases. Larger, bolded dots represent baseline visits for each ADNI phase, while smaller points indicate follow-up visits over time. This figure underscores the continuity of the cohort and the attrition or retention of participants as they progress through the study phases.
The x-axis represents time points for each phase (ADNI1, ADNIGO, ADNI2, ADNI3), with enrollment numbers of 819, 110, 730, and 410, respectively. Bold dots indicate baseline visits, while continuous lines track participant follow-up and transitions across phases, illustrating longitudinal retention.
Examining diagnosis conversions during participant visits in the ADNI study reveals notable patterns. The frequent transitions from MCI to MCI (3635 instances) and CN to CN (2971 instances) suggest prevalent stability in cognitive states across visits. These repeated transitions indicate that many participants remained in the same cognitive state over multiple visits, reflecting either the slow progression of the disease or a lack of significant change in their condition during the observation period. Additionally, the persistence of AD to AD transitions (1590 instances) underscores the stability of this cognitive state. Of particular interest is the MCI to dementia transition (419 instances), signifying a substantial progression in cognitive decline. Conversely, rare transitions, such as CN to dementia (6 cases) and dementia to CN (1 instance), raise concerns about potential reporting errors or misclassifications. NA values (1180 instances) further complicate the analysis, emphasizing the challenges in accurately categorizing cognitive changes.
ADNI group distinction: Categorizing cognitive progression paths
In this phase, we categorize participant groups within our dataset, explicitly focusing on individuals initially diagnosed with MCI. Within this subgroup, our attention is directed towards two distinct cohorts: Those who consistently maintain an MCI diagnosis throughout their visits and those who undergo a conversion from MCI to AD. For the MCI to MCI group, we apply stringent criteria. Participants must have a minimum of one year’s worth of available data, ensuring a comprehensive temporal perspective. Furthermore, their diagnosis should remain MCI from baseline through all available records, precluding any transitions to alternative states such as normal cognition.
In contrast, the MCI to AD group was meticulously selected based on specific criteria, requiring participants to exhibit an MCI to dementia conversion and maintain a consistent diagnosis post-conversion. This approach aims to derive meaningful insights from the dataset regarding the trajectories and factors associated with these cognitive progression paths. Table 1 provides an overview of participants in various diagnostic transition groups, emphasizing the ‘MCI to MCI’ and ‘MCI to AD’ categories. These groups represent distinct cognitive progression paths, with the former indicating individuals who remained stable in the MCI category across visits and the latter depicting those who progressed from MCI to AD. The total number of participants included in the analysis is 835, with each category carefully selected based on specific criteria related to cognitive progression.
Defining stable and progressive MCI states: Precision in labeling for insights
In labeling the data for pMCI and sMCI, we shift our focus from participants to individual records, recognizing the multifaceted nature of participants’ cognitive trajectories. Within the MCI to MCI group, every record is uniformly designated as sMCI, irrespective of the duration of the participant’s visit. This ensures a consistent representation of the sustained MCI state for each recorded visit, even if the engagement extends beyond three years. On the other hand, for the MCI to AD group, a precise temporal criterion guides the labeling. Only records preceding the AD diagnosis and those within the 3-year window before the conversion event receive labels.
In conclusion, the comprehensive analysis of the ADNI-MERG dataset, from exploration and cleaning to the categorization of cognitive progression paths, is succinctly depicted in Figure 3, providing a visual representation of the intricate flow of our study.
Statistical analyses
In the statistical analysis, we utilized descriptive statistics such as distribution histograms and box plots to compare the cognitive impairment patterns between sMCI and pMCI groups. Employing the Wilcoxon test (Wilcoxon, 1992) in R version 4, we scrutinized differences in the AUC, setting a stringent significance level (alpha) at 0.005. Our hypothesis testing aimed to detect significant disparities in AUC, considering values approaching 1 indicate more statistically significant differences. Ethical considerations guided our research, ensuring informed consent within the ADNI, upholding strict privacy measures, and prioritizing participant confidentiality and welfare throughout the analysis.
3. Results
This section focuses on a comprehensive exploration of the ADNI-MERGE dataset, specifically examining patterns and differences between individuals diagnosed with sMCI and pMCI. Our approach involves meticulous labeling and stratification of the dataset based on these diagnostic categories. The analysis is organized into five critical domains for understanding cognitive impairment: Demographics, PET imaging, genotyping, MRI brain analysis, and neurocognitive tests. We present the data through a comprehensive box plot figure to facilitate a clear and effective comparison between the sMCI and pMCI groups (Figure 4). This visualization illustrates the distribution of key variables across the two groups, highlighting the 5th to 95th percentiles and clearly depicting group mean differences and variability in each domain. These visual aids play a crucial role in revealing the differences across cognitive, imaging, and genetic measures, enhancing our understanding of the factors distinguishing sMCI from pMCI.
Following the box plot analysis, we present an extensive statistical evaluation in Table 2, which provides area under curve (AUC) values and corresponding P values for the key features in the dataset. This table highlights the discriminative power of clinical features between the sMCI and pMCI groups, particularly in cognitive assessments such as mPACCtrailsB, ADAS13, and LDELTOTAL, alongside memory-related tasks like RAVLT immediate and RAVLT learning. The high AUC values demonstrate the robust capability of these features to differentiate between cognitive statuses, reinforcing their relevance in understanding cognitive decline and its progression.
Abbreviations: AUC, area under curve; sMCI, stable mild cognitive impairment; pMCI, progressive mild cognitive impairment; ADNI, ADNI; AGE, age; PTEDUCAT, participant’s years of education; PTETHCAT, participant’s ethnic category; PTGENDER, participant’s gender; PTMARRY, participant’s marital status; PTRACCAT, participant’s racial categories; MRI, magnetic resonance imaging; ICV, intracranial volume; MidTemp, middle temporal gyrus; perc.forgetting, percent forgetting; CDRSB, clinical dementia rating- sum of boxes; DIGITSCOR, digit symbol substitution test; FAQ, functional assessment questionnaire; LDELTOTAL, logical memory delayed recall total score; MMSE, mini-mental state examination; TRABSCOR, trail making test-B-score; MOCA, Montreal cognitive assessment; mPACCtrailsB, ADNI-modified preclinical Alzheimer cognitive composite with trails B; mPACCdigit, ADNI-modified preclinical Alzheimer cognitive composite with digit symbol substitution; EcogPtMem, everyday cognition test participant memory test; EcogPtLang, everyday cognition test participant language test; EcogPtVisspat, everyday cognition test participant visual-spatial test; EcogPtPlan, everyday cognition test participant planning test; EcogPtOrgan, everyday cognition test participant organization test; EcogPtDivatt, everyday cognition test participant divided attention test; EcogPtTotal, everyday cognition test participant total test mean score; EcogSPMem, everyday cognition test study partner memory test; EcogSPLang, everyday cognition test study partner language test; EcogSPVisspat, everyday cognition test study partner visual-spatial test; EcogSPPlan, everyday cognition test study partner planning test; EcogSPOrgan, everyday cognition test study partner organization test; EcogSPDivatt, everyday cognition test study partner divided attention test; EcogSPTotal, everyday cognition test study partner total test mean score; ADAS, AD assessment scale; ABETA, amyloid β peptide; PTAU, blood phosphorylated tau; TAU, total tau; PET, positron emission tomography; AV45, florbetapir; FBB, florbetaben; FDG, fluorodeoxyglucose; PIB, Pittsburgh compound B.
The subsequent sections will explore the detailed findings for each domain, discussing the specific results and their implications for differentiating between sMCI and pMCI while providing insights into potential early markers of Alzheimer’s disease. In the cognitive assessment domain, a range of tests, including ADAS11, ADAS13, and ADASQ4, demonstrates significant potential in identifying individuals at risk for AD within the MCI spectrum. With AUC values of 0.80, 0.83, and 0.82, respectively, these tests effectively differentiate between sMCI and pMCI participants, with the pMCI group consistently showing higher median scores across the board. Other cognitive measures, such as mPACCdigit, mPACCtrailsB, FAQ, and LDELTOTAL, further highlight the divergence between the two groups, as evidenced by their non-overlapping distributions. Additionally, TRABSCOR, MMSE, CDRSB, and MOCA provide a clear separation between sMCI and pMCI cohorts, underscoring the value of these cognitive variables in differentiating individuals with varying degrees of cognitive impairment. The RAVLT group also reveals consistent disparities in cognitive function, with individuals in the pMCI group exhibiting greater forgetfulness, lower immediate recall, and more difficulty learning new information than those with sMCI.
In the EcogPt assessments, individuals with sMCI report slightly better performance in memory, language, and planning than those with pMCI. While differences in organization, language, and divided attention are subtle, the overall cognitive functioning, reflected by EcogPtTotal, shows clearer distinctions between the groups. Study partner reports provide stronger evidence of cognitive impairments in individuals with pMCI across multiple domains than those with sMCI. AUC values for these assessments range from moderate to good accuracy, suggesting the utility of study partner evaluations in detecting cognitive decline. Both EcogPt and EcogSP total scores indicate cognitive difficulties in the pMCI group, though study partner reports exhibit greater sensitivity in identifying cognitive impairment.
Beyond cognitive tests, demographic analyses, PET imaging, genotyping, and MRI brain data offer additional insights. Demographic factors, such as age and PTEDUCAT, serve as moderate predictors of cognitive impairment, with AUC values of 0.56 and 0.51, illustrating their limited standalone predictive strength. PET imaging variables, particularly FBB and AV45, emerge as promising markers for distinguishing between sMCI and pMCI, with FBB scores elevated in the pMCI group and AV45 scores declining in the sMCI group, pointing to their utility in monitoring MCI progression. Genotyping variables, including ABETA, PTAU, and TAU, show consistent AUC values around 0.70-0.72, further supporting their relevance in cognitive impairment. Lastly, MRI brain analysis uncovers structural differences between the two groups, with higher Ventricles scores and lower Hippocampus scores in the pMCI group, suggesting potential structural changes associated with cognitive decline, particularly in midbrain regions.
We further employed the Wilcoxon rank-sum test to statistically compare AUC values >0.8 between different diagnostic groups. The results indicated that AUC values exceeding 0.8, with P<0.005, were significantly distinct, confirming meaningful differences in the discriminatory power of these features. Moreover, the statistical significance of these metrics, reflected in low P values, strengthens the confidence in their ability to differentiate between cognitive statuses. In conclusion, this comprehensive analysis highlights the broad range of features that contribute to identifying and differentiating cognitive status within the ADNI dataset, offering valuable insights for future research and potential clinical applications.
4. Discussion
Decoding ADNI-MERG: Patterns, implications, and cognitive assessment dynamics
This exhaustive exploration of the ADNI-MERG dataset aims to understand patterns among individuals diagnosed with sMCI and pMCI. Our methodology involved meticulous labeling and stratification, enabling a detailed analysis across various domains. Various studies, such as those by Hu et al. (2020), Gao et al. (2018), Hu et al. (2017), and Pandya et al. (2017), report varying ratios of MCI to AD progression (34%, 4%, 35%, and 17.5%, respectively). These disparities may stem from differences in diagnostic criteria, assessment processes, regional variations, and participant backgrounds. However, the collective emphasis on understanding MCI to AD progression underscores the significance of continuous research efforts in this critical domain. The intricate dynamics within the ADNI cohort highlight a nuanced landscape of cognitive decline. Assessments such as ADAS13, mPACCtrailsB, and FBB exhibit discriminative prowess, emphasizing the importance of diverse tools to capture distinct facets of cognitive impairment. While our analysis focuses on individual features, acknowledging the holistic nature of cognitive decline, it is noteworthy that some studies explore interactions among features, emphasizing the potential benefits of a more comprehensive evaluation (Berezuk et al., 2023; Morar et al., 2022). Furthermore, classifying MCI to AD participants into strong and weak categories provides an additional layer of insight, with the strong group representing cases of consistent AD progression and the weak group indicating fewer clear trajectories, which may warrant a focused analysis to understand differing contributing factors.
Comprehensive insights: Unraveling cognitive, demographic, imaging, and genetic factors in cognitive impairment
In our study, like previous research (Julayanont et al., 2014; Wang et al., 2022), MoCA and MMSE scores prove crucial in discerning MCI converters from non-converters. Our study aligns with a systematic review (Belleville et al., 2017) emphasizing the significance of cognitive tests, such as RAVLT, in predicting dementia with high sensitivity and specificity. The contrasting patterns in participant self-reports and study partner reports highlight the subjective nature of cognitive experiences, offering valuable insights into an individual’s perception of cognitive function. Despite modest AUC values for age (Bohlken et al., 2019), education (Aguilar-Navarro et al., 2017), and marriage status (Hu et al., 2020), our findings concur with established literature, affirming the influential roles of female sex and lower educational levels in facilitating conversion. Demographic factors, though playing a role, have limited standalone predictive strength. The combined influence of age and year of education underscores the intricate relationship between individual characteristics and broader cognitive trends.
Our study demonstrates a significant AUC value of 0.75 for FDG features, aligning with the emphasis on FDG’s pivotal role in MCI diagnosis and risk prediction in a related study (Caminiti et al., 2018). Nevertheless, in line with recommendations from another survey (Muscari et al., 2021), we recognize the imperative of judicious FDG-PET use, especially in cases with less certain risk. The inclusion of neuroimaging biomarkers, such as FBB from PET brain analysis and structural metrics from MRI brain analysis, adds a visual dimension to our understanding. FBB’s exceptional discriminative power suggests its potential as a key early detection marker, aligning with imaging techniques’ increasing importance in identifying cognitive impairment. The presence of white matter hyperintensities appears to be linked to dementia progression in older adults with MCI (Burke et al., 2019; Kamal et al., 2023). As illustrated by hippocampus 51 and entorhinal 41 in our study, the resilience of structural metrics aligns with observations from two supplementary studies. This coherence underscores the essential contribution of alterations in brain structures to cognitive status determination, establishing a pivotal link between neuroimaging and cognitive assessments. Specific genetic differences could influence the chances of MCI advancing to AD (Xiao et al., 2022). Genotyping variables, including ABETA, PTAU, and TAU, introduce a genetic layer to our exploration. Their consistent relevance implies a shared role in the development of cognitive impairment, suggesting a convergence of various factors contributing to the complexity of cognitive decline.
Navigating cognitive complexity for optimized clinical strategies
Comparing the various facets, it becomes clear that no single measure possesses universal discriminatory strength. Instead, a comprehensive understanding of cognitive decline emerges from combined insights from demographics, PET, genotyping, MRI, and neurocognitive tests. Integrating multiple modalities provides significant advantages, as it captures the diverse aspects of AD progression, making it more robust than relying solely on individual markers. FBB’s prominence in PET brain analysis and the collective strength of certain cognitive assessments indicate potential avenues for prioritizing markers in future diagnostic strategies. However, our approach also presents drawbacks, including the potential for increased complexity and the necessity for comprehensive data that may not always be available in all clinical settings. The need for integrating multiple data types, while advantageous for accuracy, also presents logistical challenges related to data availability, cost, and computational resources. From a clinical perspective, understanding the performance of specific tests in different groups enables targeted and informed decision-making. Clinicians can enhance predictive accuracy by prioritizing assessments with higher AUC values, exemplified by ADASQ4 and mPACCtrailsB. The distinction between strong and weak groups plays a pivotal role in the performance of machine learning models. Machine learning models should be trained and validated carefully, considering these nuances and incorporating a dynamic approach that accounts for the varying strengths of predictors. Focusing on specific features or subsets of the dataset, especially those from the strong group, may enhance model accuracy and reliability.
Additionally, addressing potential challenges the weak group poses, such as employing tailored imputation techniques or adjusting decision thresholds, could further improve the model’s predictive capabilities. In summary, the intricate relationships observed among various factors emphasize the necessity for a holistic approach to understanding and addressing cognitive decline. Integrating diverse assessments, along with a nuanced interpretation of subjective and objective measures, forms a foundation for developing targeted interventions and diagnostic strategies tailored to the unique profiles of individuals at different stages of cognitive impairment within the ADNI cohort. This work aims to enhance clinical decision-making through a deeper understanding of the predictive power of various markers and ultimately contribute to more personalized and effective treatment strategies for Alzheimer’s disease.
5. Conclusion
In conclusion, our exploration of the MCI to AD transition underscores the critical importance of a holistic perspective in understanding and addressing cognitive decline. By investigating data from multiple modules, including demographics, PET, genotyping, MRI, and neurocognitive tests within the ADNI cohort, we unveiled distinct cognitive patterns distinguishing sMCI from pMCI, encompassing 50 features. The investigation into AUC values for individual features across diverse groups sheds light on the nuanced predictive potential within the transition from MCI to AD. In the demographic group, features display modest predictive values, suggesting a limited impact of demographic factors on AD prediction, with AUC ranging from 0.49 to 0.56. The MRI and PET groups demonstrate diverse AUC ranges, substantiating their respective performances. The AUC spans from 0.54 to 0.75 in MRI features, with the hippocampus exhibiting the highest AUC value.
Meanwhile, PET features showcase an AUC range of 0.66 to 0.84, with FBB presenting the highest AUC value in this group. The genotyping group, including features like ABETA and PTAU, falls within an intermediate AUC range of 0.70 to 0.72. In neurocognitive tests, the ADAS group demonstrates robust predictive power (AUC range from 0.80 to 0.83). Diverse AUC values within the cognitive tests group, including CDRSB, FAQ, and mPACCtrailsB, collectively enhance predictive capability, with AUC ranging from 0.63 to 0.83. The RAVLT group shows moderate predictive capability, with AUC ranging from 0.57 to 0.77. EcogPT features align with modest predictive capability, with AUC ranging from 0.49 to 0.58. Conversely, the EcogSP group exhibits high individual predictive values, contributing to commendable performance, with AUC ranging from 0.74 to 0.82. Features with high individual predictive power, such as those from neurocognitive tests, including the ADAS, cognitive tests, EcogSP, and PET, play pivotal roles in enhancing the overall predictive capability of their respective groups. However, it is essential to note that not all groups exhibit equally strong predictive capabilities. In particular, the demographic and EcogPT groups, characterized by lower individual predictive values, reflect a comparatively modest overall predictive performance. Consequently, this nuanced analysis underscores the varied contributions of different modalities, guiding a refined understanding of the complex interplay between diverse assessments in predicting the MCI to AD transition. These insights contribute to a refined sense of the intricate interplay between diverse assessments, guiding future research and personalized approaches for early AD diagnosis and intervention strategies.
Study limitations
It is crucial to recognize the constraints of our study. The modest sample sizes within specific groups may compromise the statistical power required for discerning significant differences, particularly in utilizing AUC for distinctions. As a result, the applicability of our findings to broader populations is circumscribed, necessitating further validation in more extensive cohorts.
Suggestions for future research
In future studies, a comprehensive strategy entails concurrently analyzing cognitive facets such as all ADAS features or RAVLT scores. Moreover, exploring synergies by combining factors across diverse cognitive dimensions could unveil valuable insights, while understanding the temporal evolution of this conversion process over time remains essential for enhancing our understanding of predictive markers for dementia.
Ethical Considerations
Compliance with ethical guidelines
All procedures performed in studies involving human participants were in accordance with the ethical standards of the institutional and or national research committee and with the 1964 Helsinki Declaration and its later amendments or comparable ethical standards. This study was approved by the Ethics Committee of Shahid Beheshti University of Medical Sciences, Tehran, Iran (Code: IR.SBMU.MSP.REC.1402.543). Informed consent was obtained from all participants in the study
Funding
This research was financially supported by Shahid Beheshti University of Medical Sciences, Tehran, Iran (Grant No.: 43007906). Data collection and sharing for this project were funded by ADNI (National Institutes of Health Grant U01 AG024904) and DOD ADNI (Department of Defense award number W81XWH-12-2-0012), with support from the National Institute on Aging, the National Institute of Biomedical Imaging and Bioengineering, and multiple industry and philanthropic contributors.
Authors' contributions
Conceptualization, study design, investigations and writing: All authors; Supervision: Ahmad Shalbaf; Data collection, analysis, and interpretation: Soheil Zarei, Project administration: Ahmad Shalbaf and Reza Shalbaf; Final approval: Soheil Zarei.
Conflict of interest
The authors declared no conflict of interest.
Acknowledgments
The authors would like to express their gratitude to the Alzheimer’s Disease Neuroimaging Initiative (ADNI) for providing access to the dataset used in this study. The authors also extend their appreciation to the research staff and clinicians involved in data collection. Special thanks to colleagues at the Institute for Cognitive Science Studies and Shahid Beheshti University of Medical Sciences for their valuable discussions and feedback. Finally, they appreciate the contributions of all study participants and their families for their involvement in this important research.
References
Aguilar-Navarro, S. G., Mimenza-Alvarado, A. J., Ávila-Funes, J. A., Juárez-Cedillo, T., Bernal-López, C., & Hernández-Favela, C. G. (2017). Clinical and demographic predictors of conversion to dementia in Mexican elderly with mild cognitive impairment. Revista de Investigacion Clinica; Organo del Hospital de Enfermedades de la Nutricion, 69(1), 33–39. [DOI:10.24875/ric.17002064] [PMID]
Panpalli Ates, M., & Yilmaz Can, F. (2020). Which factors can we control the transition from mild cognitive impairment to dementia? Journal of Clinical Neuroscience: Official Journal of the Neurosurgical Society of Australasia, 73, 108–110. [DOI:10.1016/j.jocn.2020.01.015] [PMID]
Badhwar, A., McFall, G. P., Sapkota, S., Black, S. E., Chertkow, H., & Duchesne, S., et al. (2020). A multiomics approach to heterogeneity in Alzheimer’s disease: Focused review and roadmap. Brain: A Journal of Neurology, 143(5), 1315–1331. [DOI:10.1093/brain/awz384] [PMID]
Belleville, S., Fouquet, C., Hudon, C., Zomahoun, H. T. V., Croteau, J., & Consortium for the Early Identification of Alzheimer’s disease-Quebec (2017). Neuropsychological measures that predict progression from mild cognitive impairment to Alzheimer’s type dementia in older adults: A systematic review and meta analysis. Neuropsychology Review, 27(4), 328–353. [DOI:10.1007/s11065-017-9361-5] [PMID]
Berezuk, C., Khan, M., Callahan, B. L., Ramirez, J., Black, S. E., & Zakzanis, K. K., et al. (2023). Sex differences in risk factors that predict progression from mild cognitive impairment to Alzheimer’s dementia. Journal of the International Neuropsychological Society: JINS, 29(4), 360–368. [DOI:10.1017/S1355617722000297] [PMID]
Bohlken, J., Jacob, L., & Kostev, K. (2019). Progression of mild cognitive impairment to dementia in German specialist practices. Dementia (London, England), 18(1), 380–390. [DOI:10.1177/1471301216673919] [PMID]
Breton, A., Casey, D., & Arnaoutoglou, N. A. (2019). Cognitive tests for the detection of mild cognitive impairment (MCI), the prodromal stage of dementia: Meta analysis of diagnostic accuracy studies. International Journal of Geriatric Psychiatry, 34(2), 233-242. [DOI:10.1002/gps.5016] [PMID]
Burke, S. L., Hu, T., Fava, N. M., Li, T., Rodriguez, M. J., & Schuldiner, K. L., et al. (2019). Sex differences in the development of mild cognitive impairment and probable Alzheimer’s disease as predicted by hippocampal volume or white matter hyperintensities. Journal of Women & Aging, 31(2), 140-164. [DOI:10.1080/08952841.2018.1419476] [PMID]
Caminiti, S. P., Ballarini, T., Sala, A., Cerami, C., Presotto, L., & Santangelo, R., et al. (2018). FDG PET and CSF biomarker accuracy in prediction of conversion to different dementias in a large multicentre MCI cohort. NeuroImage. Clinical, 18, 167–177. [DOI:10.1016/j.nicl.2018.01.019] [PMID]
Drzezga, A., Lautenschlager, N., Siebner, H., Riemenschneider, M., Willoch, F., & Minoshima, S., et al. (2003). Cerebral metabolic changes accompanying conversion of mild cognitive impairment into Alzheimer’s disease: A PET follow up study. European Journal of Nuclear Medicine and Molecular Imaging, 30(8), 1104–1113. [DOI:10.1007/s00259-003-1194-1] [PMID]
Fei, M., & Jianhua, W. (2013). Apolipoprotein ε4 allele as a significant risk factor for conversion from mild cognitive impairment to Alzheimer’s disease: A meta analysis of prospective studies. Journal of Molecular Neuroscience, 50(2), 257–263.[DOI:10.1007/s12031-012-9934-y] [PMID]
Gabryelewicz, T., Styczynska, M., Luczywek, E., Barczak, A., Pfeffer, A., & Androsiuk, W., et al. (2007). The rate of conversion of mild cognitive impairment to dementia: Predictive role of depression. International Journal of Geriatric Psychiatry, 22(6), 563-567. [DOI:10.1002/gps.1716] [PMID]
Gao, Q., Gwee, X., Feng, L., Nyunt, M. S. Z., Feng, L., & Collinson, S. L., et al. (2018). Mild cognitive impairment reversion and progression: Rates and predictors in community living older persons in the Singapore Longitudinal Ageing Studies cohort. Dementia and Geriatric Cognitive Disorders Extra, 8(2), 226–237. [DOI:10.1159/000488936] [PMID]
GBD 2019 Dementia Forecasting Collaborators (2022). Estimation of the global prevalence of dementia in 2019 and forecasted prevalence in 2050: an analysis for the Global Burden of Disease Study 2019. The Lancet. Public health, 7(2), e105–e125. [DOI:10.1016/S2468-2667(21)00249-8]
Ghafoori, S., & Shalbaf, A. (2022). Predicting conversion from MCI to AD by integration of rs fMRI and clinical information using 3D convolutional neural network. International Journal of Computer Assisted Radiology and Surgery, 17(7), 1245-1255. [DOI:10.1007/s11548-022-02620-4] [PMID]
Hojjati, S. H., Babajani Feremi, A., & Alzheimer’s Disease Neuroimaging Initiative. (2022). Prediction and modeling of neuropsychological scores in Alzheimer’s disease using multimodal neuroimaging data and artificial neural networks. Frontiers in Computational Neuroscience, 15, 769982. [DOI:10.3389/fncom.2021.769982] [PMID]
Hu, C., Wang, L., Guo, Y., Cao, Z., Lu, Y., & Qin, H. (2020). Study of the risk and preventive factors for progress of mild cognitive impairment to dementia. American Journal of Alzheimer’s Disease & Other Dementias, 35, 1533317520925324. [DOI:10.1177/1533317520925324] [PMID]
Hu, C., Wang, L., Zhao, X., Zhu, B., Tian, M., & Qin, H. (2021). Investigation of risk factors for the conversion of mild cognitive impairment to dementia. The International Journal of Neuroscience, 131(12), 1173–1180. [DOI:10.1080/00207454.2020.1782905] [PMID]
Hu, C., Yu, D., Sun, X., Zhang, M., Wang, L., & Qin, H. (2017). The prevalence and progression of mild cognitive impairment among clinic and community populations: A systematic review and meta analysis. International Psychogeriatrics, 29(10), 1595-1608. [DOI:10.1017/S1041610217000473] [PMID]
Julayanont, P., Brousseau, M., Chertkow, H., Phillips, N., & Nasreddine, Z. S. (2014). Montreal Cognitive Assessment Memory Index Score (MoCA MIS) as a predictor of conversion from mild cognitive impairment to Alzheimer’s disease. Journal of the American Geriatrics Society, 62(4), 679-684. [DOI:10.1111/jgs.12742] [PMID]
Kamal, F., Morrison, C., Maranzano, J., Zeighami, Y., & Dadar, M. (2023). White matter hyperintensity trajectories in patients with progressive and stable mild cognitive impairment. Neurology, 101(8), e815-e824. [DOI:10.1212/WNL.0000000000207514] [PMID]
Lee, S. J., Ritchie, C. S., Yaffe, K., Stijacic Cenzer, I., & Barnes, D. E. (2014). A clinical index to predict progression from mild cognitive impairment to dementia due to Alzheimer’s disease. Plos One, 9(12), e113535. [DOI:10.1371/journal.pone.0113535] [PMID]
Leibing, A. (2014). The earlier the better: Alzheimer’s prevention, early detection, and the quest for pharmacological interventions. Culture, Medicine and Psychiatry, 38(2), 217–236.[DOI:10.1007/s11013-014-9370-2] [PMID]
Leifer, B. P. (2003). Early diagnosis of Alzheimer’s disease: Clinical and economic benefits. Journal of the American Geriatrics Society, 51(5 Suppl Dementia), S281–S288. [DOI:10.1046/j.1532-5415.5153.x] [PMID]
Li, X. X., & Li, Z. (2018). The impact of anxiety on the progression of mild cognitive impairment to dementia in Chinese and English data bases: A systematic review and meta analysis. International Journal of Geriatric Psychiatry, 33(1), 131-140. [DOI:10.1002/gps.4694] [PMID]
Lombardi, G., Crescioli, G., Cavedo, E., Lucenteforte, E., Casazza, G., & Bellatorre, A. G., et al. (2020). Structural magnetic resonance imaging for the early diagnosis of dementia due to Alzheimer’s disease in people with mild cognitive impairment. The Cochrane Database of Systematic Reviews, 3(3), CD009628. [DOI:10.1002/14651858.CD009628.pub2] [PMID]
Mirabnahrazam, G., Ma, D., Lee, S., Popuri, K., Lee, H., & Cao, J., et al. (2022). Machine learning based multimodal neuroimaging genomics dementia score for predicting future conversion to Alzheimer’s disease. Journal of Alzheimer's Disease: JAD, 87(3), 1345–1365. [DOI:10.3233/JAD-220021] [PMID]
Morar, U., Izquierdo, W., Martin, H., Forouzannezhad, P., Zarafshan, E., & Unger, E., et al. (2022). A study of the longitudinal changes in multiple cerebrospinal fluid and volumetric magnetic resonance imaging biomarkers on converter and non converter Alzheimer’s disease subjects with consideration for their amyloid beta status. Alzheimer’s & Dementia: Diagnosis, Assessment & Disease Monitoring, 14(1), e12258. [DOI:10.1002/dad2.12258] [PMID]
Mueller, S. G., Weiner, M. W., Thal, L. J., Petersen, R. C., Jack, C., Jagust, W., Trojanowski, J. Q., Toga, A. W., & Beckett, L. (2005). The Alzheimer's disease neuroimaging initiative. Neuroimaging clinics of North America, 15(4), 869–xii. [DOI: 10.1016/j.nic.2005.09.008] [PMID]
Muscari, A., Clavarino, F., Allegri, V., Farolfi, A., Macchiarulo, M., & Maestri, L., et al. (2021). "2-step MCI-AD": A simple scoring system to predict rapid conversion from mild cognitive impairment to Alzheimer dementia. Archives of Gerontology and geriatrics, 94, 104359.
Pandya, S. Y., Clem, M. A., Silva, L. M., & Woon, F. L. (2016). Does mild cognitive impairment always lead to dementia? A review. Journal of the Neurological Sciences, 369, 57-62. [DOI:10.1016/j.jns.2016.07.055] [PMID]
Pandya, S. Y., Lacritz, L. H., Weiner, M. F., Deschner, M., & Woon, F. L. (2017). Predictors of reversion from mild cognitive impairment to normal cognition. Dementia and Geriatric Cognitive Disorders, 43(3-4), 204–214. [DOI:10.1159/000456070] [PMID]
Petersen, R. C. (2004). Mild cognitive impairment as a diagnostic entity. Journal of Internal Medicine, 256(3), 183–194. [DOI:10.1111/j.1365-2796.2004.01388.x] [PMID]
Petersen, R. C. (2018). How early can we diagnose Alzheimer disease (and is it sufficient)?: The 2017 Wartenberg lecture. Neurology, 91(9), 395–402. [DOI:10.1212/WNL.0000000000006088] [PMID]
Petersen, R. C., Smith, G. E., Waring, S. C., Ivnik, R. J., Tangalos, E. G., & Kokmen, E. (1999). Mild cognitive impairment: Clinical characterization and outcome. Archives of Neurology, 56(3), 303-308. [DOI:10.1001/archneur.56.3.303] [PMID]
Platero, C., & Tobar, M. C. (2020). Longitudinal survival analysis and two group comparison for predicting the progression of mild cognitive impairment to Alzheimer’s disease. Journal of Neuroscience Methods, 341, 108698. [DOI:10.1016/j.jneumeth.2020.108698] [PMID]
Qiu, Y., Li, L., Zhou, T. Y., Lu, W., & Alzheimer's Disease Neuroimaging Initiative (2014). Alzheimer's disease progression model based on integrated biomarkers and clinical measures. Acta Pharmacologica Sinica, 35(9), 1111–1120. [DOI:10.1038/aps.2014.57] [PMID]
Risacher, S. L., & Saykin, A. J. (2013). Neuroimaging and other biomarkers for Alzheimer’s disease: The changing landscape of early detection. Annual Review of Clinical Psychology, 9, 621-648. [DOI: 10.1146/annurev-clinpsy-050212-185535] [PMID]
Rizzi, L., Rosset, I., & Roriz Cruz, M. (2014). Global epidemiology of dementia: Alzheimer’s and vascular types. BioMed Research International, 2014, 908915. [DOI:10.1155/2014/908915] [PMID]
Roberts, R. O., Knopman, D. S., Mielke, M. M., Cha, R. H., Pankratz, V. S., & Christianson, T. J., et al. (2014). Higher risk of progression to dementia in mild cognitive impairment cases who revert to normal. Neurology, 82(4), 317-325. [DOI:10.1212/WNL.0000000000000055] [PMID]
Song, Y. N., Wang, P., Xu, W., Li, J. Q., Cao, X. P., & Yu, J. T., et al. (2018). Risk factors of rapid cognitive decline in Alzheimer’s disease and mild cognitive impairment: A systematic review and meta analysis. Journal of Alzheimer’s Disease, 66(2), 497-515. [DOI:10.3233/JAD-180476] [PMID]
Sörensen, A., Blazhenets, G., Rücker, G., Schiller, F., Meyer, P. T., & Frings, L., et al. (2019). Prognosis of conversion of mild cognitive impairment to Alzheimer’s dementia by voxel wise Cox regression based on FDG PET data. NeuroImage. Clinical, 21, 101637. [DOI:10.1016/j.nicl.2018.101637] [PMID]
Tan, E. Y. L., Köhler, S., Hamel, R. E. G., Muñoz-Sánchez, J. L., Verhey, F. R. J., & Ramakers, I. H. G. B. (2019). Depressive symptoms in mild cognitive impairment and the risk of dementia: A systematic review and comparative meta analysis of clinical and community based studies. Journal of Alzheimer’s Disease, 67(4), 1319-1329. [DOI:10.3233/JAD-180513] [PMID]
Thaipisuttikul, P., Jaikla, K., Satthong, S., & Wisajun, P. (2022). Rate of conversion from mild cognitive impairment to dementia in a Thai hospital based population: A retrospective cohort. Alzheimer's & Dementia (New York, N. Y.), 8(1), e12272. [DOI:10.1002/trc2.12272] [PMID]
Tokuchi, R., Hishikawa, N., Kurata, T., Sato, K., Kono, S., & Yamashita, T., et al. (2014). Clinical and demographic predictors of mild cognitive impairment for converting to Alzheimer’s disease and reverting to normal cognition. Journal of the Neurological Sciences, 346(1-2), 288-292. [DOI:10.1016/j.jns.2014.09.012] [PMID]
Valizadeh, G., Elahi, R., Hasankhani, Z., Rad, H. S., & Shalbaf, A. (2024). Deep learning approaches for early prediction of conversion from MCI to AD using MRI and clinical data: A systematic review. Archives of Computational Methods in Engineering, 1-70. [Link]
Wang, M., Sajobi, T. T., Ismail, Z., Seitz, D., Chekouo, T., & Forkert, N. D., et al. (2022). A pragmatic dementia risk score for patients with mild cognitive impairment in a memory clinic population: Development and validation of a dementia risk score using routinely collected data. Alzheimer's & Dementia (New York, N. Y.), 8(1), e12301. [DOI:10.1002/trc2.12301] [PMID]
Wilcoxon, F. (1992). Individual comparisons by ranking methods. In S. Kotz & N.L. Johnson (Eds), Breakthroughs in Statistics: Methodology and Distribution (pp. 196-202). New York, NY: Springer New York. [Link]
Xiao, Q., Xi, J., Wang, R., Zhao, Q., Liang, X., & Wu, W., et al. (2022). The relationship between low density lipoprotein cholesterol and progression of mild cognitive impairment: The influence of rs6859 in PVRL2. Frontiers in Genetics, 13, 823406. [DOI:10.3389/fgene.2022.823406] [PMID]
Xue, H., Sun, Q., Liu, L., Zhou, L., & Liang, R., He, R., et al. (2017). Risk factors of transition from mild cognitive impairment to Alzheimer’s disease and death: A cohort study. Comprehensive Psychiatry, 78, 91-97. [DOI:10.1016/j.comppsych.2017.07.003] [PMID]
Zhou, Y., Song, Z., Han, X., Li, H., & Tang, X. (2021). Prediction of Alzheimer’s disease progression based on magnetic resonance imaging. ACS Chemical Neuroscience, 12(22), 4209–4223. [DOI:10.1021/acschemneuro.1c00472] [PMID]
Type of Study: Original |
Subject:
Cognitive Neuroscience
Received: 2024/04/20 | Accepted: 2024/10/26 | Published: 2025/03/18
Received: 2024/04/20 | Accepted: 2024/10/26 | Published: 2025/03/18
Send email to the article author
| Rights and permissions | |
 |
This work is licensed under a Creative Commons Attribution-NonCommercial 4.0 International License. |
![]()
Copyright © The Author(s);
This is an open access article distributed under the terms of the Creative Commons Attribution License (CC-By-NC), which permits use, distribution, and reproduction in any medium, provided the original work is properly cited and is not used for commercial purposes.
Contact Information
