

Volume 16 - Special Issue on Cognitive Sciences
BCN 2025, 16 - Special Issue on Cognitive Sciences: 299-308 |
Back to browse issues page


Download citation:
BibTeX | RIS | EndNote | Medlars | ProCite | Reference Manager | RefWorks
Send citation to:


BibTeX | RIS | EndNote | Medlars | ProCite | Reference Manager | RefWorks
Send citation to:
Fakhari R, Moradi A, Ebrahimpour R, Khosrowabadi R. Structural Balance of Resting-State Brain Network in Attention Deficit Hyperactivity Disorder. BCN 2025; 16 (S1) :299-308
URL: http://bcn.iums.ac.ir/article-1-2788-en.html
URL: http://bcn.iums.ac.ir/article-1-2788-en.html


1- Institute for Cognitive Sciences Studies, Tehran, Iran.
2- Department of Clinical Psychology, Faculty of Psychology and Education, Kharrazmi University, Tehran, Iran.
3- Center for Cognitive Science, Institute for Convergence Science & Technology, Sharif University of Technology, Tehran, Iran.
4- Institute for Cognitive and Brain Sciences, Shahid Beheshti University, Tehran, Iran.
Keywords: Attention deficit hyperactivity disorder (ADHD), Functional brain network, Resting-state fMRI, Structural balance theory
Full-Text [PDF 3302 kb]
| Abstract (HTML)
Full-Text:
1. Introduction
Attention deficit hyperactivity disorder (ADHD) is a developmental neurological disorder, and its main features are difficulty in regulating attention and controlling impulsive movements and hyperactivity (APA, 2013; Tosto et al., 2015; Rappley, 2005). Although ADHD generally develops in childhood, it may be diagnosed later in life. The disorder lasts until adolescence and adulthood and affects various aspects of a person’s life, such as success in education and work, personal relationships, health, and financial issues. We have three types of ADHD: Hyperactive, inattentive, and a combination of both.
In recent years, functional network studies of hyperactive ADHD patients obtained from functional magnetic resonance imaging have shown that these patients are hyperconnected at inter-network levels, such as the dorsal and ventral attention network, salience network, and default mode network. There have also been changes within these networks, and it has also shown how these changes can be related to patients’ behavioral symptoms (Castellanos & Proal, 2012; Gao et al., 2019; Sripada et al., 2014). Although many studies have been conducted using the network approach in ADHD (Weyandt et al., 2013; Ashtar et al., 2005; Witt & Stevens, 2015; Cao et al., 2013; Beare et al., 2017), more efforts should be made with new tools based on the collective behavior of connections to understand better the systemic behavior of brain regions in this disorder.
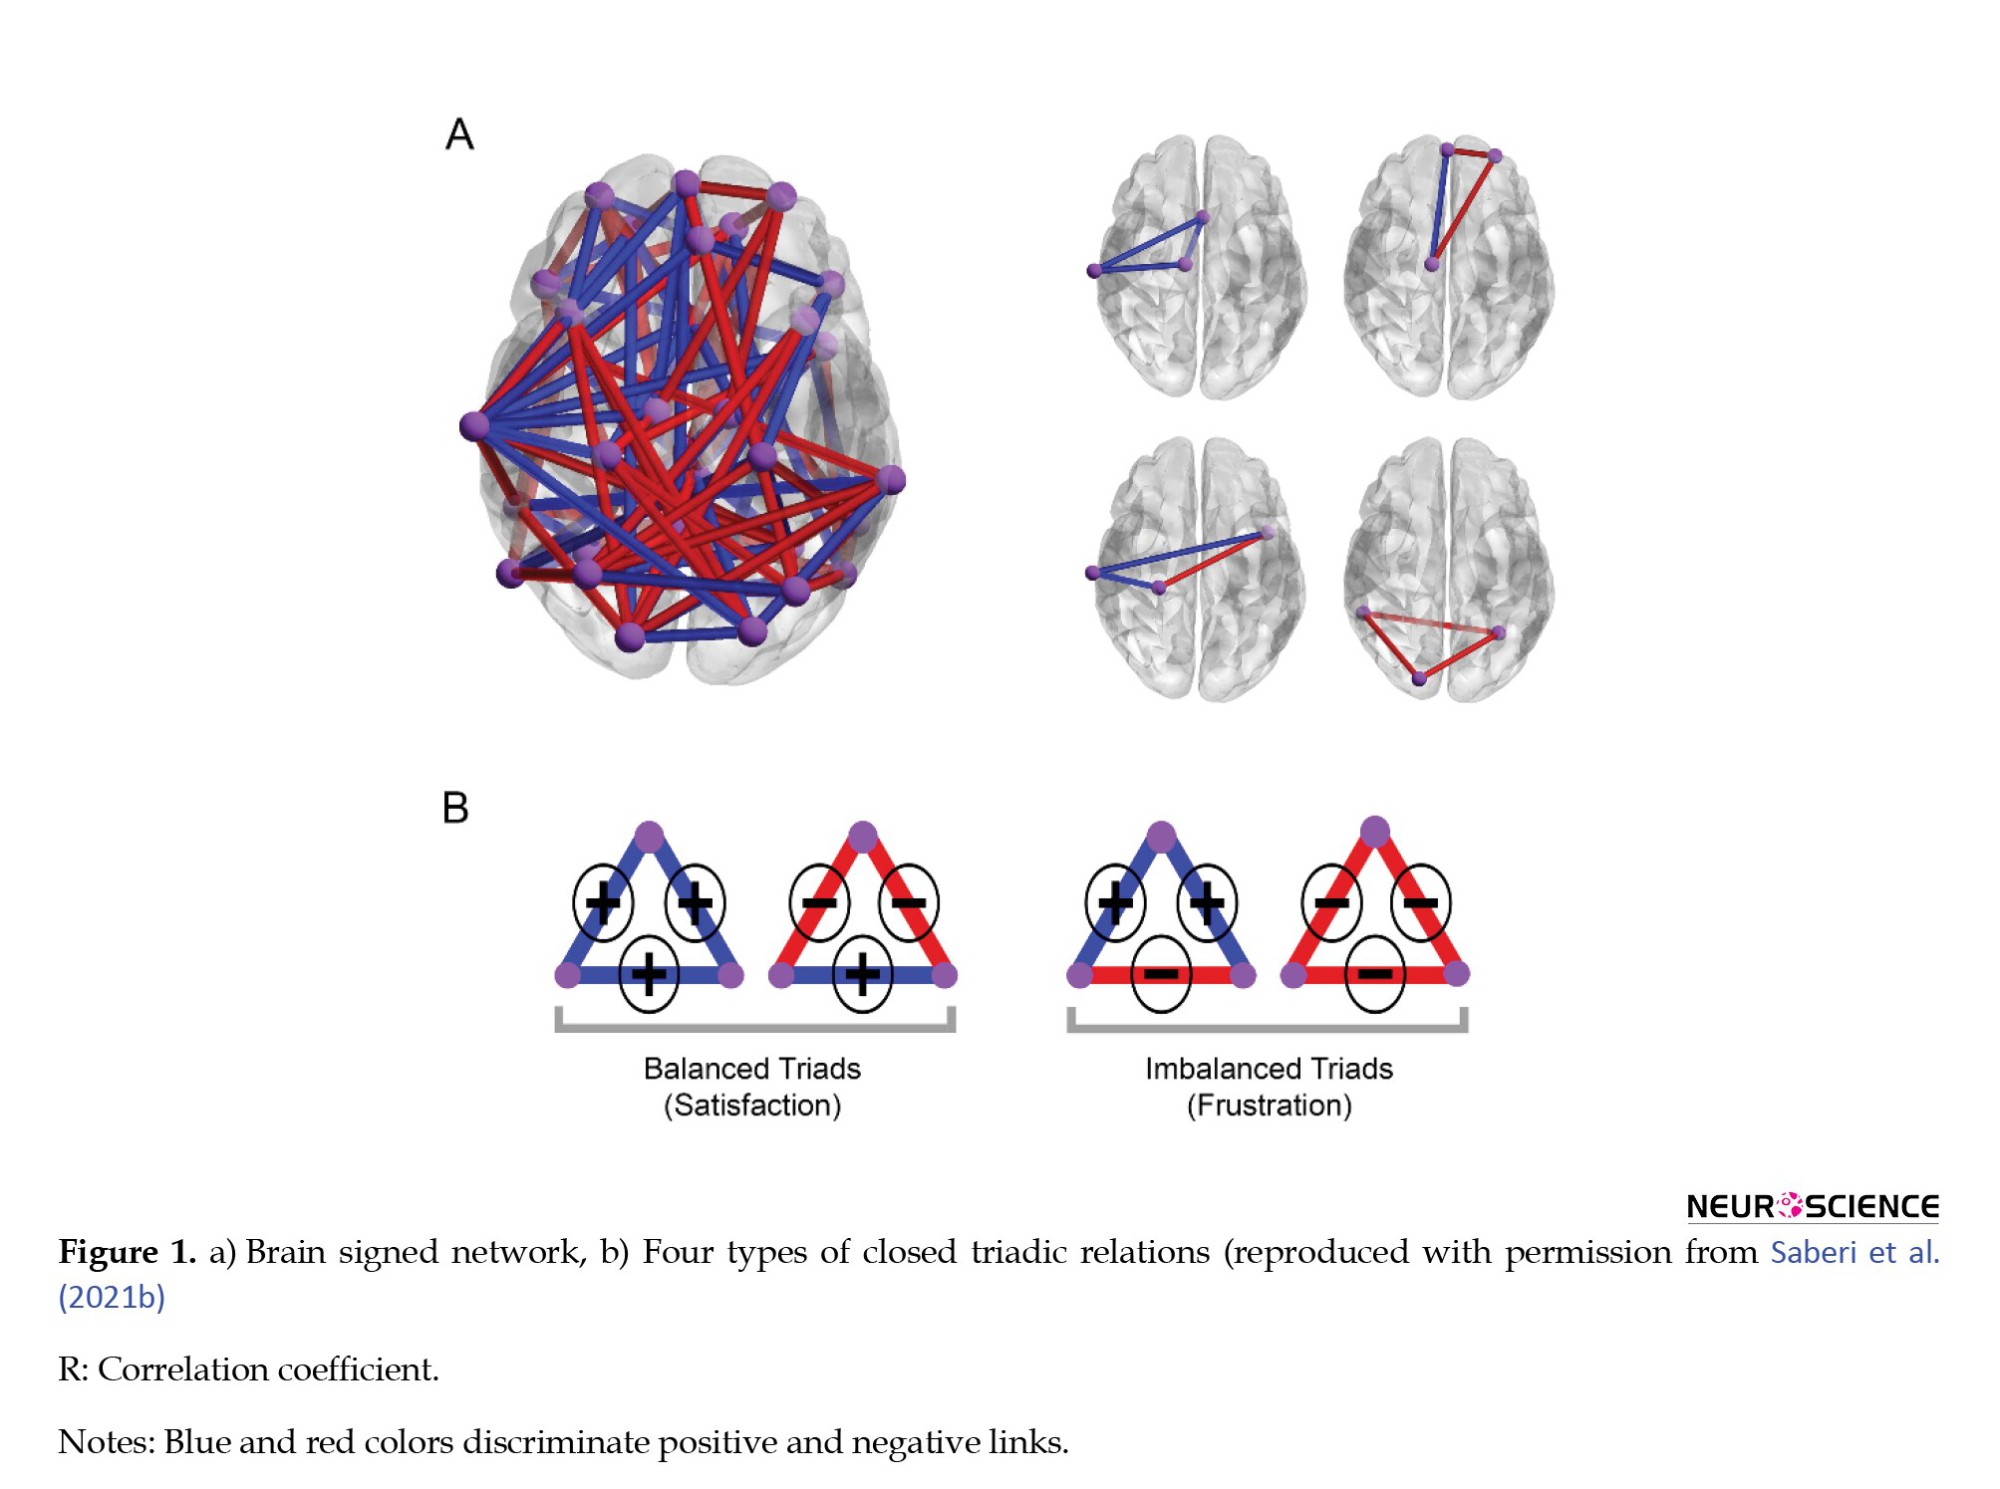
According to the above-mentioned approach, it is imperative to study the features that represent complexity in the brain network (Sporns, 2013; Rubinov & Sporns, 2010; Sporns, 2014). One of these features is the organization of network components. Structural balance is another achievement of network science inspired by interpersonal social relationships (Heider, 1946; Heider, 2013). Brain network researchers traditionally study the dual relationships of nodes and use them to describe the collective behavior of the brain network. While in structural balance, the three relations of nodes are considered. The important point is that the relationship of two nodes in a network does not depend solely on them and is strongly influenced by other relationships. There are generally four modes for a triadic relationship (Rapoport, 1963; Marvel et al., 2009): Your friend’s friend is your friend, the enemy of your enemy is your friend, the enemy of your enemy is your enemy, and your friend’s friend is your enemy. The first and the second triads are called the balance triad, and the third and fourth ones are called the unbalanced triad. Unbalanced triads are unstable and must be balanced and returned to a stable state by changing one or two relationships (Antal et al., 2005). The number of triadic relations we can have in an N-node network is a combination of 3 of N. The higher the balance triads of a network compared to its unbalanced triads, the closer that network is to the overall balance. The lowest possible energy is when all three are unbalanced, and the highest is when all three are unbalanced (Marvel et al., 2009).
In recent years, our research colleagues have tried to use this theory and its features to study brain networks (Figure 1) (Saberi et al., 2021a; Saberi et al., 2021b; Saberi et al., 2022). In conceptualizations, the synchrony and anti-synchrony between the temporal activities of the brain regions determine the signs of the links in the signed network of the brain. It has been shown that the brain network is in a meta-stable state close to absolute stability and ready for phase transition to another mode (Saberi et al., 2021a). A meta-stable state is a temporary and unstable condition in which a system exists for a considerable period before transitioning to other states. Despite its instability, the system remains in the meta-stable state until it is disturbed by an external force or event. In addition, a prospective study of balance-energy for brain networks can provide helpful information about the brain network’s dynamics, flexibility, and changeability that can be associated with the symptoms and deficits of mental disorders.
We hypothesized that the effect of dysconnectivity and antisynchrony should mainly be local and may not influence the overall stability and flexibility of the network in ADHD. So, in this study, we intend to study the structural balance of functional brain networks and their global effect on ADHD. We compared the balanced energy of functional brain networks of healthy people with three subtypes of ADHD. We also examined the relationship between the behavioral characteristics of the indicators associated with this disorder and balance energy. Because previous studies have emphasized structural balance changes over a lifetime (Saberi et al., 2021b), we compared the relationship between age and balanced energy between healthy and ADHD patients.
2. Materials and Methods
Study participants
The participants of this study were selected from the ADHD-200 project (ADHD-200 Consortium, 2012), a consortium of many universities. We used all available subjects. In this study, there were 947 healthy and ADHD people. ADHD patients were divided into three groups: Hyperactive, inattentive, and combined. The participants’ ages range from 7 to 21, including males and females.
Brain activity time series
We used data from ADHD preprocessed (Bellec et al., 2017). The Athena pipeline preprocesses the existing images (Craddock et al., 2012) that use FSL (the FMRIB Software Library) (Jenkinson et al., 2012) and analysis of functional neuroimages (AFNI) (Cox, 1996). They included skull-stripping, segmentation into cerebrospinal fluid (CSF), white matter (WM), and gray matter (GM), and normalization to MNI (Montreal Neurological Institute) standard space for structural images and slice timing correction, deobliquing, motion correction, co-registration to native space, normalizing to MNI standard space, temporal band-pass filtering, and spatial smoothing for functional images in addition to extracting brain activity time-series based on the three atlases of AAL (automated anatomical atlas), CC200 (Craddock 200), and CC400 (Craddock 400) (Craddock et al., 2012; Tzourio-Mazoyer et al., 2002). These atlases include 116, 192, and 392 brain regions, respectively. Each time series corresponds to a region, representing that area’s activity over time. We should mention that the global signal has not been removed. In addition, AAL is an anatomical parcellation atlas. However, CC200 and CC400 were developed based on brain function, so we used them to increase the reliability of the results.
Signed networks
For each participant, we developed a continuity matrix whose values represent the temporal correlation of the time series related to the two regions of the brain. We calculated this property for each subject and each pair of regions to full matrices. Then, we considered signs of correlations to provide a signed network for each subject. Thus, if the correlation value is positive, the corresponding link becomes positive, and if the correlation value turns negative, the corresponding network link becomes negative. Thus, we developed a signed network for each parcellation and each subject.
Balancing energy
Marvel et al. formulated balance-energy in the context of physics (Marvel et al., 2009). If we set the friendship between two nodes to +1 and the enmity between the two nodes to -1, the energy of a triad will be as follows (Equation 1):

, where the value of Sij corresponds to the friendship and enmity between nodes i and j, the product of these three factors is equal to +1 in the balanced triad and -1 in the unbalanced triad. Because in physics, a steady state that does not need to change has less energy, and balanced triads do not need to change, we multiplied this product by a negative. Thus, the energy of a triad balance is -1, and the energy of an unbalanced triad is +1.
In this context, Marvel et al., (2009) stated the structural balance-energy as the average of the energy of all triads:
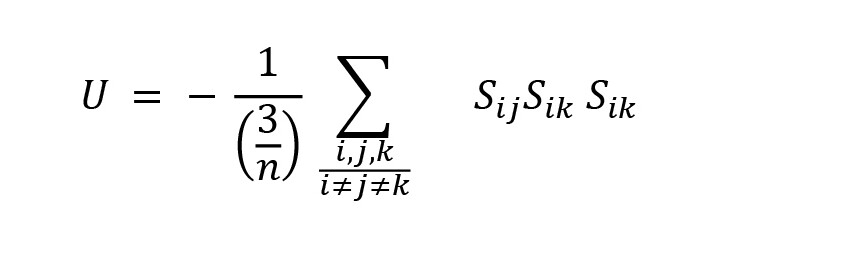
In this formula, the sum is based on the energy of the triads, n is the number of network nodes, and (3/n) is the combination of 3 of n as the number of triads in the network. The network balance-energy ranges between -1 and +1. If all three triads are balanced, the energy is equal to -1.
Tendency to make hub (TMH)
TMH is a global hubness measure introduced by Saberi et al., (2021b). It matters in structural balance investigation since they showed that increasing global hubness of signed links is correlated to decreasing balance energy. TMH is defined as follows:
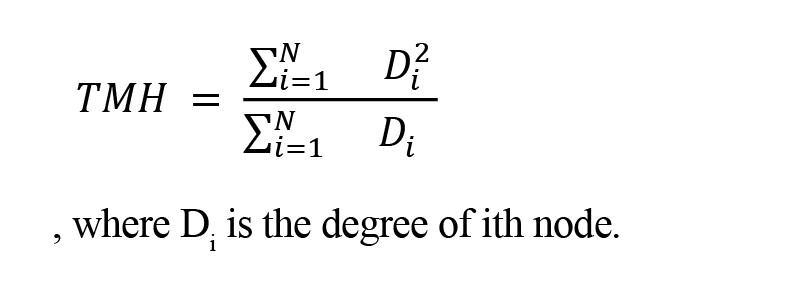
, where Di is the degree of ith node.
Statistical analysis
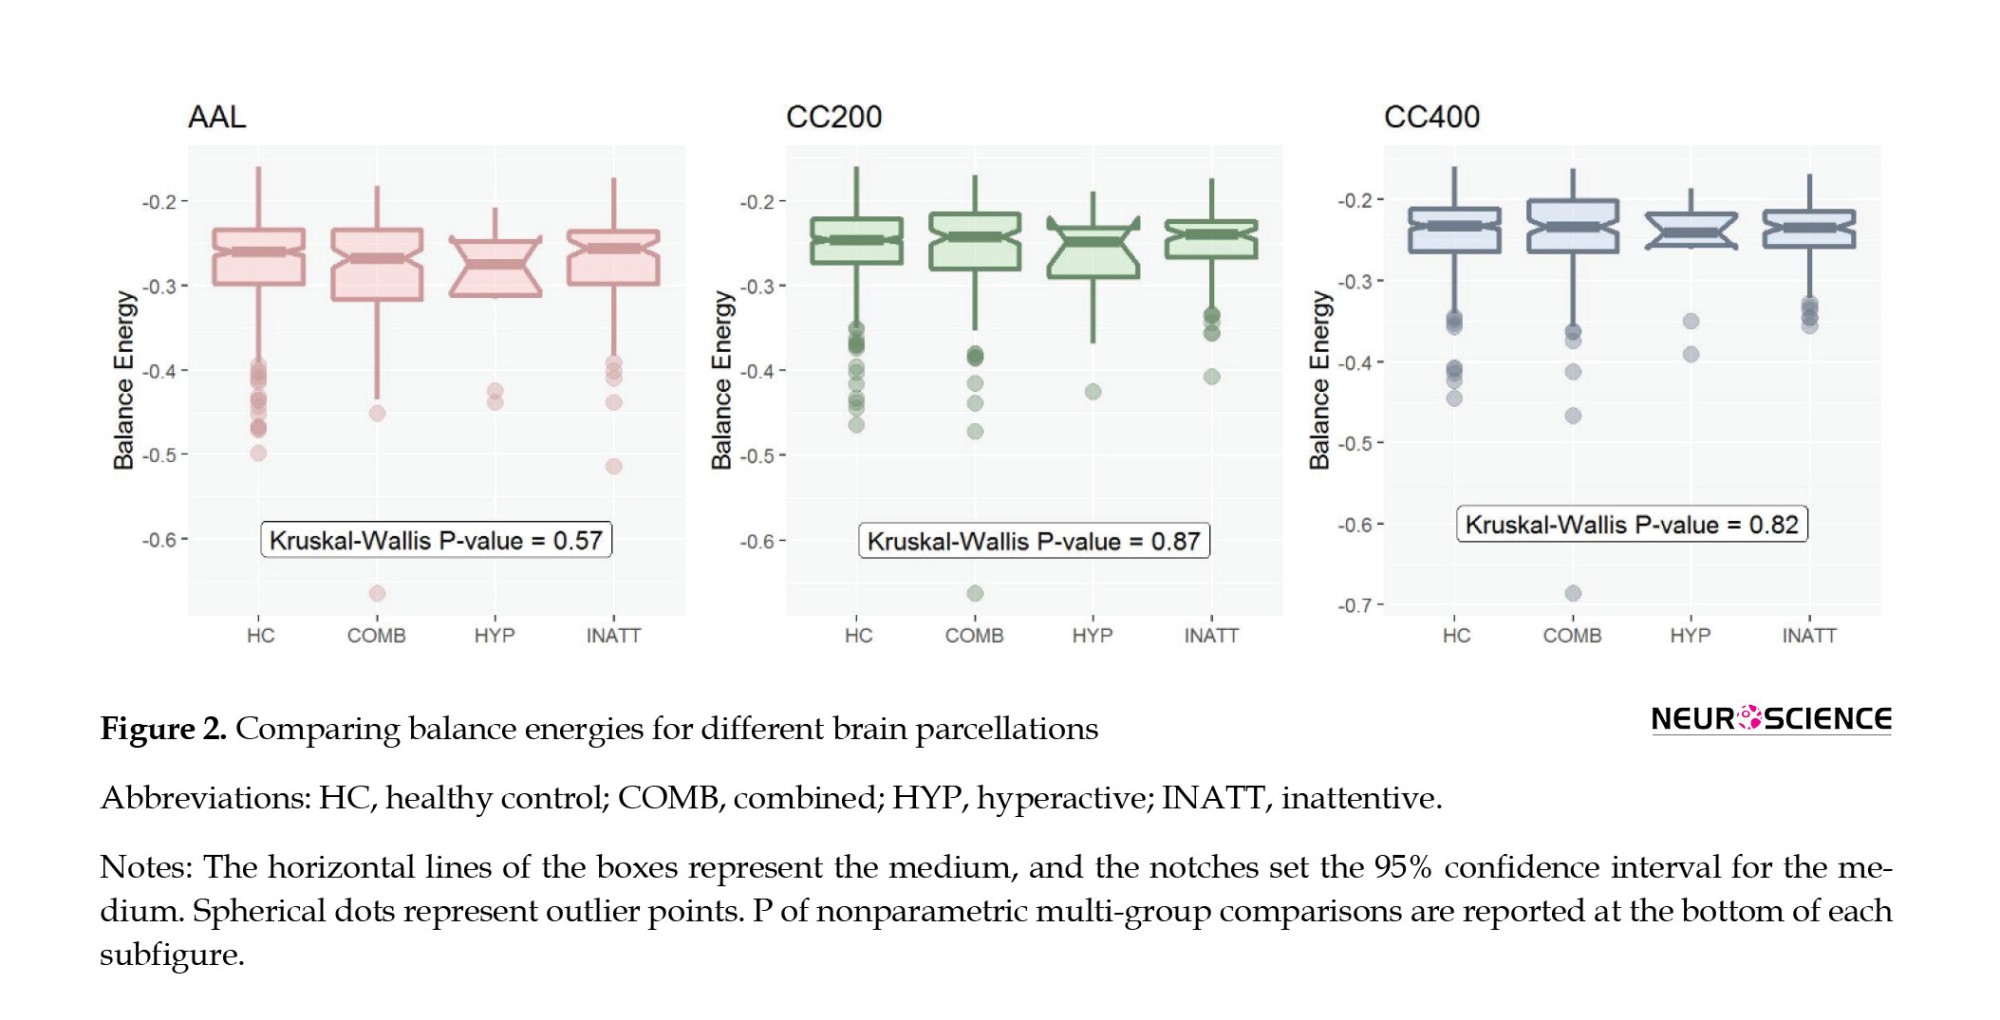
In multi-group comparisons of balance energies, we first checked the normality of the distribution with the Shapiro-Wilcoxon test. Since these distributions were abnormal, we resorted to nonparametric statistics and the Kruskal-Wallis test (Figure 2).
We also used the post hoc Dunn test for afterward comparisons and the Pearson correlation test to examine the relationships between continuous behavioral variables and balance energies (Figure 3).
Also, we used the analysis of variance (ANOVA) to compare TMH between groups of subjects since TMH distributions were normal. To compare the relationship between age and balanced energy between healthy and patient people, we used the analysis of covariance (ANCOVA) in which age was a covariate and group was the dependent variable (Figure 4).
We also used ANOVA to compare each connection between 4 groups of subjects (Figure 6).
We also used R software and the “ggplot2” package to analyze the data and provide graphic information (Team, 2013; Wickham et al., 2016).
3. Results
Between-group comparison of the balance energies
We calculated the functional networks’ balance energy, representing the structural balance, and compared them between the healthy controls and groups of ADHD disorders. The patients were divided into three groups: Combined, hyperactive, and inattentive. Figure 2 shows the intergroup comparison of three patients and one healthy group for three AAL, CC200, and CC400 brain parcellations. Since balance energies had no normal distributions (P of Shapiro-Wilk test <0.001), we chose nonparametric statistics for multi-group comparisons and used the Kruskal-Wallis test. As Figure 2 shows, there is no significant difference between the balance energies of the different groups.
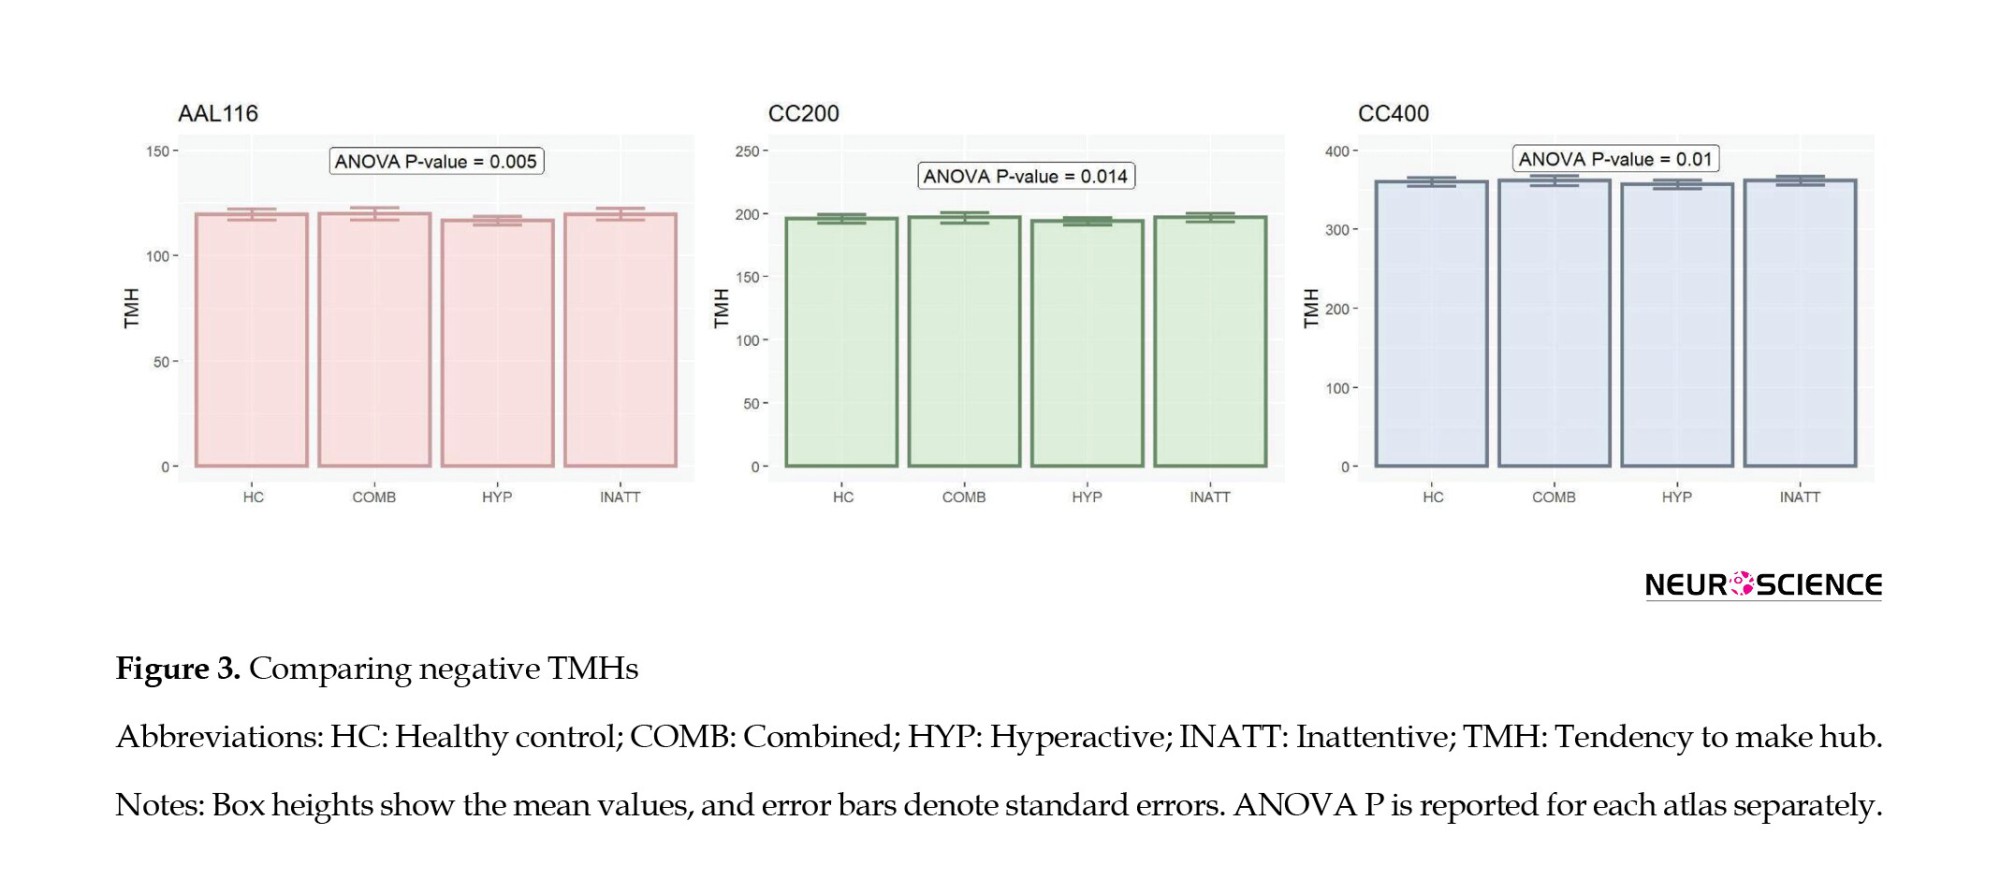
Between-group comparison of negative TMHs
We obtained TMH of negative subnetworks for each subject and its parcellation altases. ANOVA showed significant differences between TMH of different types of subjects (AAL: P=0.00508, CC200: P=0.0142, CC400: P=0.0105) (Figure 3). Also, post hoc tests indicate that the hyperactive group has significantly lower TMH than others.
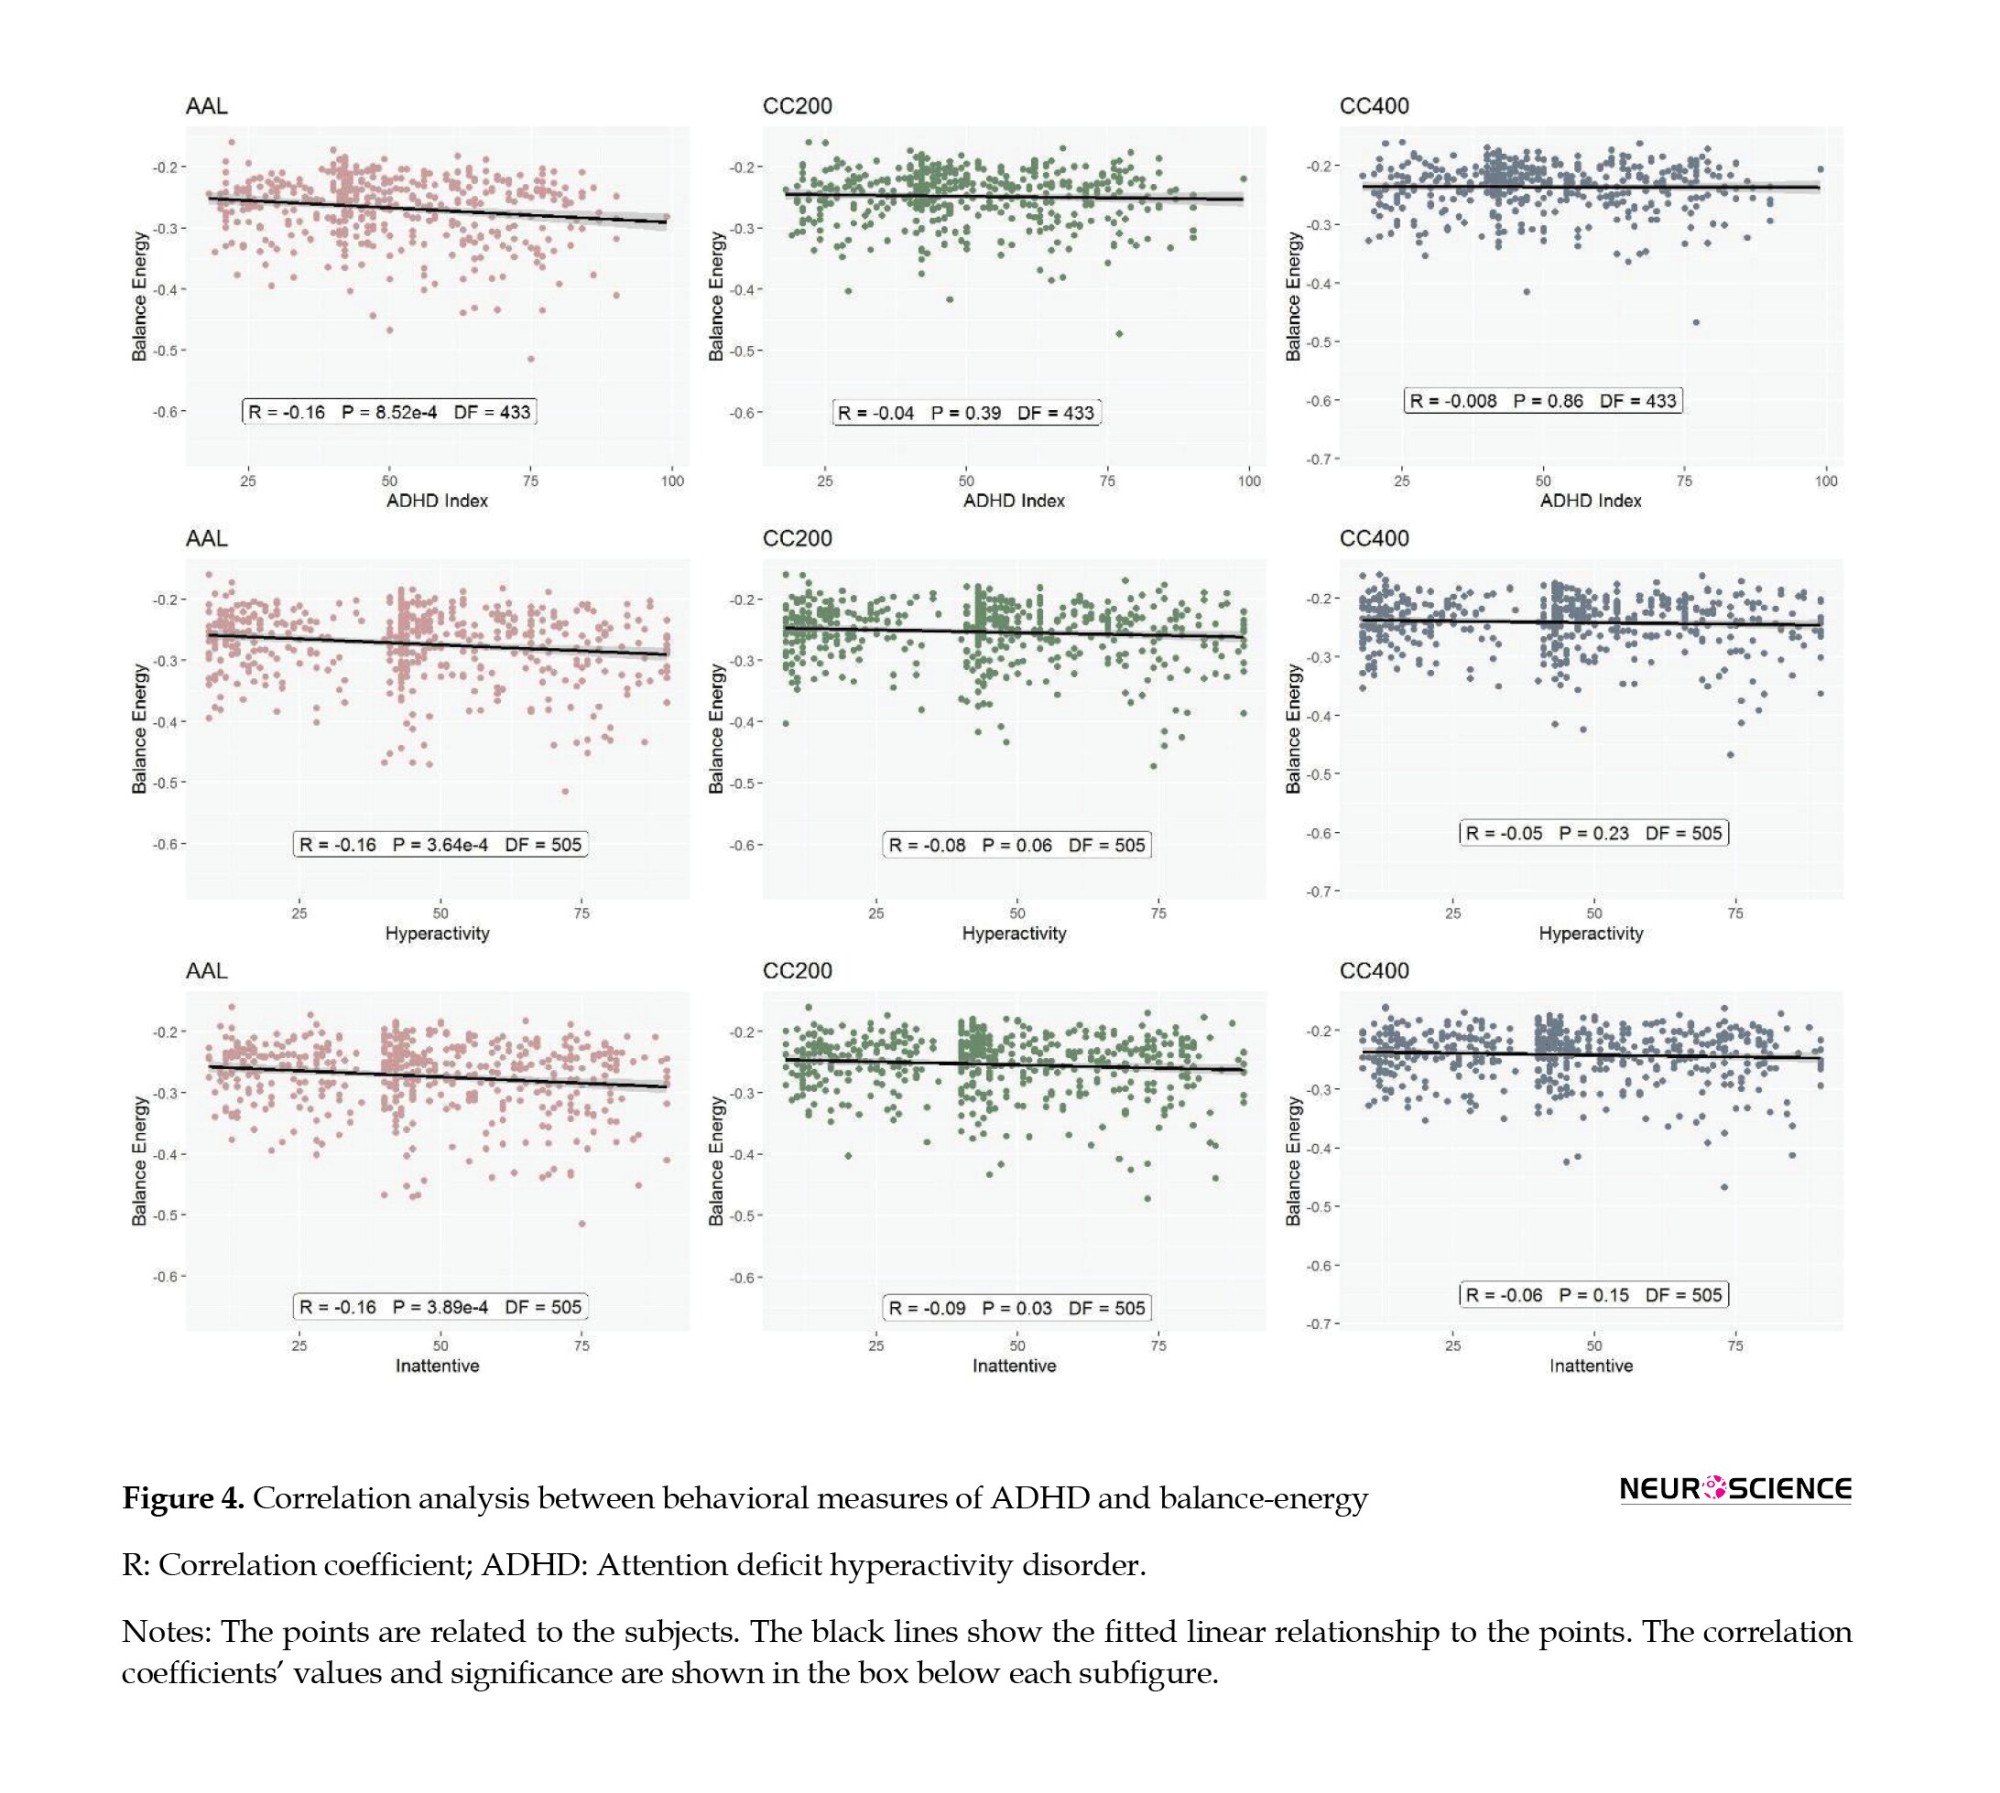
Relationship between behavioral metrics and balance energy
We examined the linear relationship between the three important behavioral variables for ADHD, including ADHD index, hyperactivity, and inattention, with the network balance-energy for the three brain parcellations. Figure 4 shows that the ADHD index has a significant linear relationship with the balance-energy in the AAL atlas (R=-0.16, P=8.52e-4), although no significant relationship was found in the other atlases. Examining the relationship between hyperactivity and balance energies, a significant linear relationship is observed for AAL and CC200 atlases (AAL: R=-0.16, P=3.64e-4; CC200: R=-0.08, P=0.06). Also, the study of the relationship between the Inattention and balance-energy shows a significant relationship for AAL and CC200 atlases (AAL: R=-0.16, P=3.89e-4; CC200: R=-0.09, P=0.03).
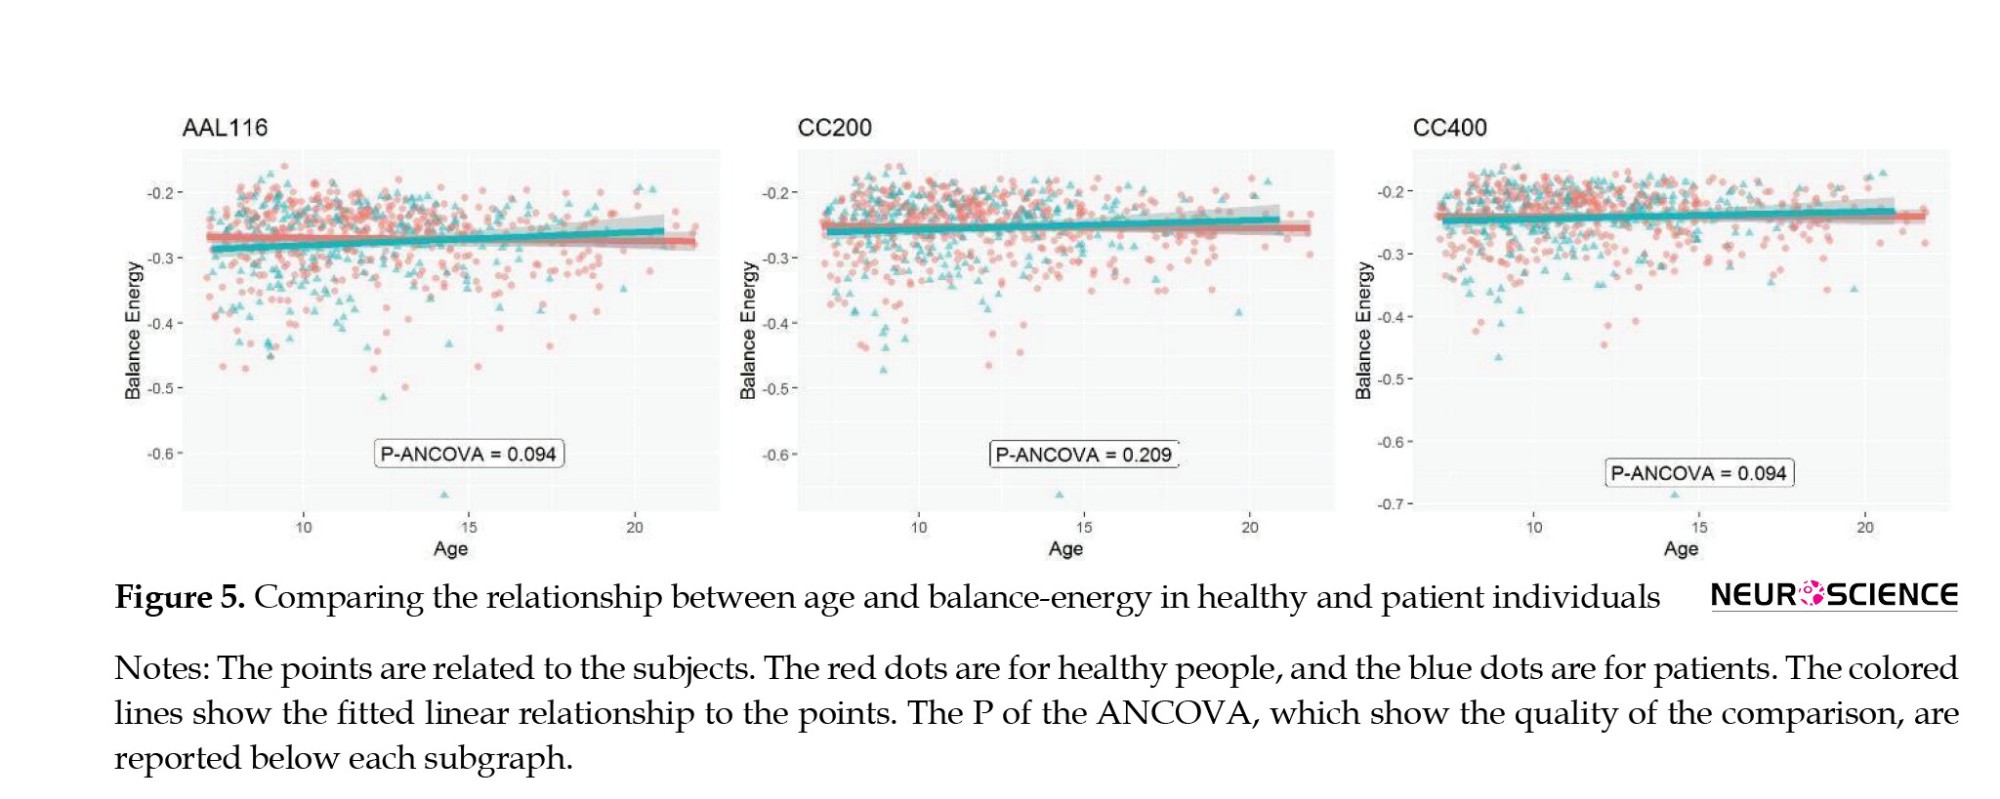
Relationship between age and balanced energy
Previous studies have observed that the number of imbalanced triads changes over a lifespan (Saberi et al., 2021b). Therefore, we examined whether age and energy balance relationship differs between healthy and patient groups. We grouped all three patient subtypes and compared them with healthy individuals. Figure 5 shows a correlation comparison, with ANCOVA results showing a slight difference between patients and healthy individuals in the brain parcellations of AAL (F=2.805, P=0.094).
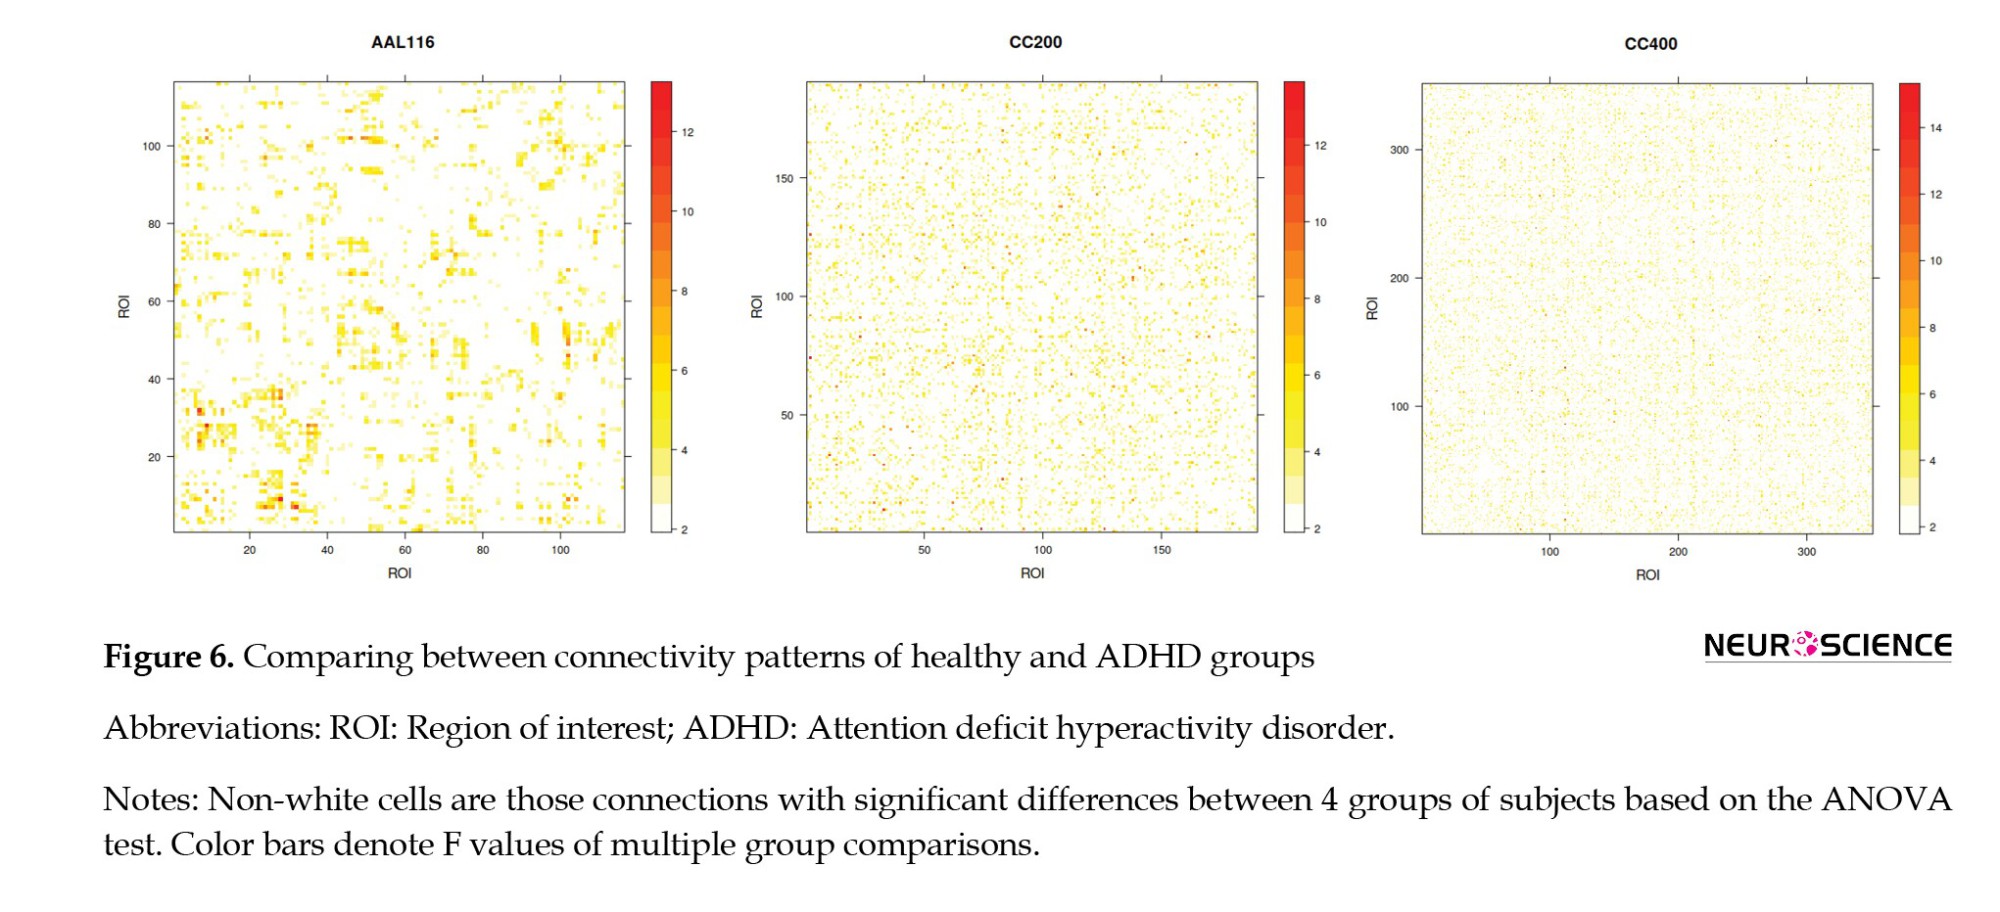
Between-group connectivity differences
As we showed, there are no significant differences between the balance energies of different groups. Considering that balance-energy is a global network measure, we decided to check functional links, which are the main local measures. So, we compared the connectivity patterns of patients and healthy subjects to check for any significant differences in the level of connections. Figure 6 shows vast connections with significant differences between healthy and three subtypes for all three parcellations.
4. Discussion
Results showed that the balanced energy of the functional networks of the brain of the patient and healthy groups was not different. However, hyperactive patients have significantly lower hubnees in their negative subnetworks. There was also a negative correlation between behavioral measures associated with ADHD and brain balance-energy in some brain parcellations. The linear relationship between age and balanced energy also had a weak difference between healthy and patient people, which is not very significant but cannot be ignored.
Numerous studies have been performed on the networks of ADHD, in many of which researchers have shown differences in the local and global properties of the brain network of healthy people with ADHD disorders (Gao et al., 2019; Cao et al., 2013). The networks studied before in this field were binary networks that had or did not have a connection. However, in this study, we examined the signed brain network to provide the readers with information on the structure of structural balance and network stability, which was a new approach, and no difference was found in balance.
“The whole is greater than the sum of the parts” is an expression attributed to Aristotle, one of the main concepts of complex systems. It tells us some features in the system expressed in the collection of elements. Our results show that although healthy and AHDH connectivity patterns are different (Figure 6), the connections form a global topology with the same balance energy. This finding means that exploring local measures is important to clarifying the mechanism of ADHD.
The study of structural balance in the brain network is a new research theme, and its capacities have recently been revealed. One of the studies showed that gathering functional signed connections around nodes leads the brain to lower energy and greater stability (Saberi et al., 2021a). The structural balance of the brain also changes over a lifespan (Saberi et al., 2021b). Another study identified the pattern of frustrations (imbalanced triads) as the source of conflictual brain link arrangements (Saberi et al., 2022). The significance of negative links topology on functional network balance was investigated during pleasant and unpleasant stimuli (Soleymani et al., 2023). Recently, structural balance in obsessive-compulsive disorder (OCD) was explored, with a particular emphasis on the role of positive and negative link arrangements (Talesh et al., 2023).
Examining the structural balance in disorders can be particularly interesting because it provides information about the quality of the organization of connections and can reveal the mechanism of brain disorders. Our research aligns with previous research and explores the finding that the mechanism of ADHD is not well-known.
As we know, patients with ADHD have poor cognitive control; for example, they have a relatively poor ability to pay attention and control inhibition (Rappley, 2005). On the one hand, we have shown that as the disease score increases, the energy balance decreases, and the network stability increases. Increasing stability and decreasing energy is proportional to decreasing flexibility because the system loses its flexibility at low energy and cannot easily switch between different states. Therefore, this study’s findings can help better identify the disorder’s brain mechanism at the network level. As shown in Figure 3, the correlations are significant in some cases but not others. Therefore, developing and modifying the method of checking the balance, strengthening the information obtained from the brain, and improving the methods of determining the level of behavioral symptoms may also lead to more accurate and robust results.
A recent study showed that structural balance changes over age (Saberi et al., 2021b). In this study, according to the age of the participants, we could focus only on the lower age groups and try to examine the linear relationship between the age of the participants and their brain balance-energy in a continuous analysis. There was a relative difference in this relationship between healthy and patient people in the two atlases. The results suggest that further studies are needed in this case as well.
Studies on brain networks show that the results obtained in some cases are selected under the influence of the atlas (Domhof et al., 2021; Popovych et al., 2021). Therefore, it is important to see whether the results are independent of the type of parcellation. An important point we tried to observe in this study was reviewing the results with different atlases. Because we wanted to compare the reproducibility of the results using other atlases. The findings of this study showed that the results obtained from the AAL atlas show relatively stronger differences and relationships. These results are relatively weak at CC200 and CC400 atlases but, in most cases, are unavoidable. Therefore, the results obtained in the network balance study are almost independent of the atlas, but the type of atlas selected affects their quality, which seems to be a legitimate argument.
Overall, the structural balance of functional brain networks is not significantly different between healthy individuals and ADHD patients, although the greatest behavioral symptoms of these patients cause more balanced brain networks. Combining these two pieces of findings, the mechanisms needed to study the systemic features of the brain still need to be developed so that we can provide a better explanation, just as the behavioral mechanisms of this disorder need to be developed.
5. Conclusion
Based on the results of this study, it is suggested that further research be done on the effects of ADHD on the structural balance of the brain and that the variables in the analysis should be modified to achieve more valid results. Significant differences in TMH values indicate that more topological investigation can obtain further information on the balance-related mechanism of ADHD. We proposed an investigation of local balance-based measures to reveal ADHD mechanisms at the level of a network. In addition, this approach can be studied in other diseases, and these studies can also be done on the brain images to examine the structural balance of patients’ brains during activity.
Ethical Considerations
Compliance with ethical guidelines
There were no ethical considerations to be considered in this research.
Funding
This research did not receive any grant from funding agencies in the public, commercial, or non-profit sectors.
Authors' contributions
All authors contributed equally to the conception and design of the study, data collection and analysis, interception of the results and drafting of the manuscript. Each author approved the final version of the manuscript for submission.
Conflict of interest
The authors declared no conflict of interest.
References
Attention deficit hyperactivity disorder (ADHD) is a developmental neurological disorder, and its main features are difficulty in regulating attention and controlling impulsive movements and hyperactivity (APA, 2013; Tosto et al., 2015; Rappley, 2005). Although ADHD generally develops in childhood, it may be diagnosed later in life. The disorder lasts until adolescence and adulthood and affects various aspects of a person’s life, such as success in education and work, personal relationships, health, and financial issues. We have three types of ADHD: Hyperactive, inattentive, and a combination of both.
In recent years, functional network studies of hyperactive ADHD patients obtained from functional magnetic resonance imaging have shown that these patients are hyperconnected at inter-network levels, such as the dorsal and ventral attention network, salience network, and default mode network. There have also been changes within these networks, and it has also shown how these changes can be related to patients’ behavioral symptoms (Castellanos & Proal, 2012; Gao et al., 2019; Sripada et al., 2014). Although many studies have been conducted using the network approach in ADHD (Weyandt et al., 2013; Ashtar et al., 2005; Witt & Stevens, 2015; Cao et al., 2013; Beare et al., 2017), more efforts should be made with new tools based on the collective behavior of connections to understand better the systemic behavior of brain regions in this disorder.
According to the above-mentioned approach, it is imperative to study the features that represent complexity in the brain network (Sporns, 2013; Rubinov & Sporns, 2010; Sporns, 2014). One of these features is the organization of network components. Structural balance is another achievement of network science inspired by interpersonal social relationships (Heider, 1946; Heider, 2013). Brain network researchers traditionally study the dual relationships of nodes and use them to describe the collective behavior of the brain network. While in structural balance, the three relations of nodes are considered. The important point is that the relationship of two nodes in a network does not depend solely on them and is strongly influenced by other relationships. There are generally four modes for a triadic relationship (Rapoport, 1963; Marvel et al., 2009): Your friend’s friend is your friend, the enemy of your enemy is your friend, the enemy of your enemy is your enemy, and your friend’s friend is your enemy. The first and the second triads are called the balance triad, and the third and fourth ones are called the unbalanced triad. Unbalanced triads are unstable and must be balanced and returned to a stable state by changing one or two relationships (Antal et al., 2005). The number of triadic relations we can have in an N-node network is a combination of 3 of N. The higher the balance triads of a network compared to its unbalanced triads, the closer that network is to the overall balance. The lowest possible energy is when all three are unbalanced, and the highest is when all three are unbalanced (Marvel et al., 2009).
In recent years, our research colleagues have tried to use this theory and its features to study brain networks (Figure 1) (Saberi et al., 2021a; Saberi et al., 2021b; Saberi et al., 2022). In conceptualizations, the synchrony and anti-synchrony between the temporal activities of the brain regions determine the signs of the links in the signed network of the brain. It has been shown that the brain network is in a meta-stable state close to absolute stability and ready for phase transition to another mode (Saberi et al., 2021a). A meta-stable state is a temporary and unstable condition in which a system exists for a considerable period before transitioning to other states. Despite its instability, the system remains in the meta-stable state until it is disturbed by an external force or event. In addition, a prospective study of balance-energy for brain networks can provide helpful information about the brain network’s dynamics, flexibility, and changeability that can be associated with the symptoms and deficits of mental disorders.
We hypothesized that the effect of dysconnectivity and antisynchrony should mainly be local and may not influence the overall stability and flexibility of the network in ADHD. So, in this study, we intend to study the structural balance of functional brain networks and their global effect on ADHD. We compared the balanced energy of functional brain networks of healthy people with three subtypes of ADHD. We also examined the relationship between the behavioral characteristics of the indicators associated with this disorder and balance energy. Because previous studies have emphasized structural balance changes over a lifetime (Saberi et al., 2021b), we compared the relationship between age and balanced energy between healthy and ADHD patients.
2. Materials and Methods
Study participants
The participants of this study were selected from the ADHD-200 project (ADHD-200 Consortium, 2012), a consortium of many universities. We used all available subjects. In this study, there were 947 healthy and ADHD people. ADHD patients were divided into three groups: Hyperactive, inattentive, and combined. The participants’ ages range from 7 to 21, including males and females.
Brain activity time series
We used data from ADHD preprocessed (Bellec et al., 2017). The Athena pipeline preprocesses the existing images (Craddock et al., 2012) that use FSL (the FMRIB Software Library) (Jenkinson et al., 2012) and analysis of functional neuroimages (AFNI) (Cox, 1996). They included skull-stripping, segmentation into cerebrospinal fluid (CSF), white matter (WM), and gray matter (GM), and normalization to MNI (Montreal Neurological Institute) standard space for structural images and slice timing correction, deobliquing, motion correction, co-registration to native space, normalizing to MNI standard space, temporal band-pass filtering, and spatial smoothing for functional images in addition to extracting brain activity time-series based on the three atlases of AAL (automated anatomical atlas), CC200 (Craddock 200), and CC400 (Craddock 400) (Craddock et al., 2012; Tzourio-Mazoyer et al., 2002). These atlases include 116, 192, and 392 brain regions, respectively. Each time series corresponds to a region, representing that area’s activity over time. We should mention that the global signal has not been removed. In addition, AAL is an anatomical parcellation atlas. However, CC200 and CC400 were developed based on brain function, so we used them to increase the reliability of the results.
Signed networks
For each participant, we developed a continuity matrix whose values represent the temporal correlation of the time series related to the two regions of the brain. We calculated this property for each subject and each pair of regions to full matrices. Then, we considered signs of correlations to provide a signed network for each subject. Thus, if the correlation value is positive, the corresponding link becomes positive, and if the correlation value turns negative, the corresponding network link becomes negative. Thus, we developed a signed network for each parcellation and each subject.
Balancing energy
Marvel et al. formulated balance-energy in the context of physics (Marvel et al., 2009). If we set the friendship between two nodes to +1 and the enmity between the two nodes to -1, the energy of a triad will be as follows (Equation 1):
, where the value of Sij corresponds to the friendship and enmity between nodes i and j, the product of these three factors is equal to +1 in the balanced triad and -1 in the unbalanced triad. Because in physics, a steady state that does not need to change has less energy, and balanced triads do not need to change, we multiplied this product by a negative. Thus, the energy of a triad balance is -1, and the energy of an unbalanced triad is +1.
In this context, Marvel et al., (2009) stated the structural balance-energy as the average of the energy of all triads:
In this formula, the sum is based on the energy of the triads, n is the number of network nodes, and (3/n) is the combination of 3 of n as the number of triads in the network. The network balance-energy ranges between -1 and +1. If all three triads are balanced, the energy is equal to -1.
Tendency to make hub (TMH)
TMH is a global hubness measure introduced by Saberi et al., (2021b). It matters in structural balance investigation since they showed that increasing global hubness of signed links is correlated to decreasing balance energy. TMH is defined as follows:
, where Di is the degree of ith node.
Statistical analysis
In multi-group comparisons of balance energies, we first checked the normality of the distribution with the Shapiro-Wilcoxon test. Since these distributions were abnormal, we resorted to nonparametric statistics and the Kruskal-Wallis test (Figure 2).
We also used the post hoc Dunn test for afterward comparisons and the Pearson correlation test to examine the relationships between continuous behavioral variables and balance energies (Figure 3).
Also, we used the analysis of variance (ANOVA) to compare TMH between groups of subjects since TMH distributions were normal. To compare the relationship between age and balanced energy between healthy and patient people, we used the analysis of covariance (ANCOVA) in which age was a covariate and group was the dependent variable (Figure 4).
We also used ANOVA to compare each connection between 4 groups of subjects (Figure 6).
We also used R software and the “ggplot2” package to analyze the data and provide graphic information (Team, 2013; Wickham et al., 2016).
3. Results
Between-group comparison of the balance energies
We calculated the functional networks’ balance energy, representing the structural balance, and compared them between the healthy controls and groups of ADHD disorders. The patients were divided into three groups: Combined, hyperactive, and inattentive. Figure 2 shows the intergroup comparison of three patients and one healthy group for three AAL, CC200, and CC400 brain parcellations. Since balance energies had no normal distributions (P of Shapiro-Wilk test <0.001), we chose nonparametric statistics for multi-group comparisons and used the Kruskal-Wallis test. As Figure 2 shows, there is no significant difference between the balance energies of the different groups.
Between-group comparison of negative TMHs
We obtained TMH of negative subnetworks for each subject and its parcellation altases. ANOVA showed significant differences between TMH of different types of subjects (AAL: P=0.00508, CC200: P=0.0142, CC400: P=0.0105) (Figure 3). Also, post hoc tests indicate that the hyperactive group has significantly lower TMH than others.
Relationship between behavioral metrics and balance energy
We examined the linear relationship between the three important behavioral variables for ADHD, including ADHD index, hyperactivity, and inattention, with the network balance-energy for the three brain parcellations. Figure 4 shows that the ADHD index has a significant linear relationship with the balance-energy in the AAL atlas (R=-0.16, P=8.52e-4), although no significant relationship was found in the other atlases. Examining the relationship between hyperactivity and balance energies, a significant linear relationship is observed for AAL and CC200 atlases (AAL: R=-0.16, P=3.64e-4; CC200: R=-0.08, P=0.06). Also, the study of the relationship between the Inattention and balance-energy shows a significant relationship for AAL and CC200 atlases (AAL: R=-0.16, P=3.89e-4; CC200: R=-0.09, P=0.03).
Relationship between age and balanced energy
Previous studies have observed that the number of imbalanced triads changes over a lifespan (Saberi et al., 2021b). Therefore, we examined whether age and energy balance relationship differs between healthy and patient groups. We grouped all three patient subtypes and compared them with healthy individuals. Figure 5 shows a correlation comparison, with ANCOVA results showing a slight difference between patients and healthy individuals in the brain parcellations of AAL (F=2.805, P=0.094).
Between-group connectivity differences
As we showed, there are no significant differences between the balance energies of different groups. Considering that balance-energy is a global network measure, we decided to check functional links, which are the main local measures. So, we compared the connectivity patterns of patients and healthy subjects to check for any significant differences in the level of connections. Figure 6 shows vast connections with significant differences between healthy and three subtypes for all three parcellations.
4. Discussion
Results showed that the balanced energy of the functional networks of the brain of the patient and healthy groups was not different. However, hyperactive patients have significantly lower hubnees in their negative subnetworks. There was also a negative correlation between behavioral measures associated with ADHD and brain balance-energy in some brain parcellations. The linear relationship between age and balanced energy also had a weak difference between healthy and patient people, which is not very significant but cannot be ignored.
Numerous studies have been performed on the networks of ADHD, in many of which researchers have shown differences in the local and global properties of the brain network of healthy people with ADHD disorders (Gao et al., 2019; Cao et al., 2013). The networks studied before in this field were binary networks that had or did not have a connection. However, in this study, we examined the signed brain network to provide the readers with information on the structure of structural balance and network stability, which was a new approach, and no difference was found in balance.
“The whole is greater than the sum of the parts” is an expression attributed to Aristotle, one of the main concepts of complex systems. It tells us some features in the system expressed in the collection of elements. Our results show that although healthy and AHDH connectivity patterns are different (Figure 6), the connections form a global topology with the same balance energy. This finding means that exploring local measures is important to clarifying the mechanism of ADHD.
The study of structural balance in the brain network is a new research theme, and its capacities have recently been revealed. One of the studies showed that gathering functional signed connections around nodes leads the brain to lower energy and greater stability (Saberi et al., 2021a). The structural balance of the brain also changes over a lifespan (Saberi et al., 2021b). Another study identified the pattern of frustrations (imbalanced triads) as the source of conflictual brain link arrangements (Saberi et al., 2022). The significance of negative links topology on functional network balance was investigated during pleasant and unpleasant stimuli (Soleymani et al., 2023). Recently, structural balance in obsessive-compulsive disorder (OCD) was explored, with a particular emphasis on the role of positive and negative link arrangements (Talesh et al., 2023).
Examining the structural balance in disorders can be particularly interesting because it provides information about the quality of the organization of connections and can reveal the mechanism of brain disorders. Our research aligns with previous research and explores the finding that the mechanism of ADHD is not well-known.
As we know, patients with ADHD have poor cognitive control; for example, they have a relatively poor ability to pay attention and control inhibition (Rappley, 2005). On the one hand, we have shown that as the disease score increases, the energy balance decreases, and the network stability increases. Increasing stability and decreasing energy is proportional to decreasing flexibility because the system loses its flexibility at low energy and cannot easily switch between different states. Therefore, this study’s findings can help better identify the disorder’s brain mechanism at the network level. As shown in Figure 3, the correlations are significant in some cases but not others. Therefore, developing and modifying the method of checking the balance, strengthening the information obtained from the brain, and improving the methods of determining the level of behavioral symptoms may also lead to more accurate and robust results.
A recent study showed that structural balance changes over age (Saberi et al., 2021b). In this study, according to the age of the participants, we could focus only on the lower age groups and try to examine the linear relationship between the age of the participants and their brain balance-energy in a continuous analysis. There was a relative difference in this relationship between healthy and patient people in the two atlases. The results suggest that further studies are needed in this case as well.
Studies on brain networks show that the results obtained in some cases are selected under the influence of the atlas (Domhof et al., 2021; Popovych et al., 2021). Therefore, it is important to see whether the results are independent of the type of parcellation. An important point we tried to observe in this study was reviewing the results with different atlases. Because we wanted to compare the reproducibility of the results using other atlases. The findings of this study showed that the results obtained from the AAL atlas show relatively stronger differences and relationships. These results are relatively weak at CC200 and CC400 atlases but, in most cases, are unavoidable. Therefore, the results obtained in the network balance study are almost independent of the atlas, but the type of atlas selected affects their quality, which seems to be a legitimate argument.
Overall, the structural balance of functional brain networks is not significantly different between healthy individuals and ADHD patients, although the greatest behavioral symptoms of these patients cause more balanced brain networks. Combining these two pieces of findings, the mechanisms needed to study the systemic features of the brain still need to be developed so that we can provide a better explanation, just as the behavioral mechanisms of this disorder need to be developed.
5. Conclusion
Based on the results of this study, it is suggested that further research be done on the effects of ADHD on the structural balance of the brain and that the variables in the analysis should be modified to achieve more valid results. Significant differences in TMH values indicate that more topological investigation can obtain further information on the balance-related mechanism of ADHD. We proposed an investigation of local balance-based measures to reveal ADHD mechanisms at the level of a network. In addition, this approach can be studied in other diseases, and these studies can also be done on the brain images to examine the structural balance of patients’ brains during activity.
Ethical Considerations
Compliance with ethical guidelines
There were no ethical considerations to be considered in this research.
Funding
This research did not receive any grant from funding agencies in the public, commercial, or non-profit sectors.
Authors' contributions
All authors contributed equally to the conception and design of the study, data collection and analysis, interception of the results and drafting of the manuscript. Each author approved the final version of the manuscript for submission.
Conflict of interest
The authors declared no conflict of interest.
References
ADHD-200 consortium. (2012). The ADHD-200 consortium: A model to advance the translational potential of neuroimaging in clinical neuroscience. Frontiers in Systems Neuroscience, 6, 62. [DOI:10.3389/fnsys.2012.00062] [PMID]
American Psychiatric Association. (2013). Diagnostic and statistical manual of mental disorders: DSM-5. Washington: American Psychiatric Association. [DOI:10.1176/appi.books.9780890425596]
Antal, T., Krapivsky, P. L., & Redner, S. (2005). Dynamics of social balance on networks. Physical Review. E, Statistical, Nonlinear, and Soft Matter Physics, 72(3 Pt 2), 036121. [DOI:10.1103/PhysRevE.72.036121] [PMID]
Ashtari, M., Kumra, S., Bhaskar, S. L., Clarke, T., Thaden, E., & Cervellione, K. L., et al. (2005). Attention-deficit/hyperactivity disorder: A preliminary diffusion tensor imaging study. Biological Psychiatry, 57(5), 448–455. [DOI:10.1016/j.biopsych.2004.11.047] [PMID]
Beare, R., Adamson, C., Bellgrove, M. A., Vilgis, V., Vance, A., & Seal, M. L., et al. (2017). Altered structural connectivity in ADHD: A network based analysis. Brain Imaging and Behavior, 11(3), 846-858. [DOI:10.1007/s11682-016-9559-9] [PMID]
Bellec, P., Chu, C., Chouinard-Decorte, F., Benhajali, Y., Margulies, D. S., & Craddock, R. C. (2017). The neuro bureau ADHD-200 preprocessed repository. NeuroImage, 144(Pt B), 275–286. [DOI:10.1016/j.neuroimage.2016.06.034] [PMID]
Cao, Q., Shu, N., An, L., Wang, P., Sun, L., & Xia, M. R., et al. (2013). Probabilistic diffusion tractography and graph theory analysis reveal abnormal white matter structural connectivity networks in drug-naive boys with attention deficit/hyperactivity disorder. The Journal of Neuroscience: The Official Journal of the Society for Neuroscience, 33(26), 10676–10687.[DOI:10.1523/JNEUROSCI.4793-12.2013] [PMID]
Castellanos, F. X., & Proal, E. (2012). Large-scale brain systems in ADHD: Beyond the prefrontal-striatal model. Trends in Cognitive Sciences, 16(1), 17–26. [DOI:10.1016/j.tics.2011.11.007] [PMID]
Craddock, R. C., James, G. A., Holtzheimer, P. E., 3rd, Hu, X. P., & Mayberg, H. S. (2012). A whole brain fMRI atlas generated via spatially constrained spectral clustering. Human Brain Mapping, 33(8), 1914–1928. [DOI:10.1002/hbm.21333] [PMID]
Cox, R. W. (1996). AFNI: Software for analysis and visualization of functional magnetic resonance neuroimages. Computers and Biomedical Research, 29(3), 162-173. [DOI:10.1006/cbmr.1996.0014] [PMID]
Domhof, J. W., Jung, K., Eickhoff, S. B., & Popovych, O. V. (2021). Parcellation-induced variation of empirical and simulated brain connectomes at group and subject levels. Network Neuroscience (Cambridge, Mass.), 5(3), 798–830. [DOI:10.1162/netn_a_00202] [PMID]
Gao, Y., Shuai, D., Bu, X., Hu, X., Tang, S., & Zhang, L., et al. (2019). Impairments of large-scale functional networks in attention-deficit/hyperactivity disorder: A meta-analysis of resting-state functional connectivity. Psychological Medicine, 49(15), 2475–2485. [DOI:10.1017/S003329171900237X] [PMID]
Heider, F. (1946). Attitudes and cognitive organization. The Journal of Psychology, 21, 107–112. [DOI:10.1080/00223980.1946.9917275] [PMID]
Heider, F. (2013). The psychology of interpersonal relations. New York: Psychology Press. [DOI:10.4324/9780203781159]
Jenkinson, M., Beckmann, C. F., Behrens, T. E., Woolrich, M. W., & Smith, S. M. (2012). Fsl. Neuroimage, 62(2), 782-790. [DOI:10.1016/j.neuroimage.2011.09.015] [PMID]
Marvel, S. A., Strogatz, S. H., & Kleinberg, J. M. (2009). Energy landscape of social balance. Physical Review Letters, 103(19), 198701. [DOI:10.1103/PhysRevLett.103.198701] [PMID]
Popovych, O. V., Jung, K., Manos, T., Diaz-Pier, S., Hoffstaedter, F., & Schreiber, J., et al. (2021). Inter-subject and inter-parcellation variability of resting-state whole-brain dynamical modeling. Neuroimage, 236, 118201. [DOI:10.1016/j.neuroimage.2021.118201] [PMID]
Rappley, M. D. (2005). Attention deficit-hyperactivity disorder. The New England Journal of Medicine, 352(2), 165–173.[DOI:10.1056/NEJMcp032387] [PMID]
Rapoport, A. (1963). Mathematical models of social interaction. New Jersey: John Wiley & Sons. [Link]
Rubinov, M., & Sporns, O. (2010). Complex network measures of brain connectivity: Uses and interpretations. NeuroImage, 52(3), 1059–1069. [DOI:10.1016/j.neuroimage.2009.10.003] [PMID]
Saberi, M., Khosrowabadi, R., Khatibi, A., Misic, B., & Jafari, G. (2021). Topological impact of negative links on the stability of resting-state brain network. Scientific Reports, 11(1), 1-14. [DOI:10.1038/s41598-021-81767-7]
Saberi, M., Khosrowabadi, R., Khatibi, A., Misic, B., & Jafari, G. (2021). Requirement to change of functional brain network across the lifespan. Plos One, 16(11), e0260091. [DOI:10.1371/journal.pone.0260091] [PMID]
Saberi, M., Khosrowabadi, R., Khatibi, A., Misic, B., & Jafari, G. (2022). Pattern of frustration formation in the functional brain network. bioRxiv. [DOI:10.1101/2022.05.29.493932]
Sripada, C., Kessler, D., Fang, Y., Welsh, R. C., Prem Kumar, K., & Angstadt, M. (2014). Disrupted network architecture of the resting brain in attention‐deficit/hyperactivity disorder. Human Brain Mapping, 35(9), 4693-4705. [DOI:10.1002/hbm.22504] [PMID]
Soleymani, F., Khosrowabadi, R., Pedram, M. M., & Hatami, J. (2023). Impact of negative links on the structural balance of brain functional network during emotion processing. Scientific Reports, 13(1), 15983. [DOI:10.1038/s41598-023-43178-8] [PMID]
Sporns, O. (2013). Network attributes for segregation and integration in the human brain. Current Opinion in Neurobiology, 23(2), 162–171. [DOI:10.1016/j.conb.2012.11.015] [PMID]
Sporns, O. (2014). Contributions and challenges for network models in cognitive neuroscience. Nature Neuroscience, 17(5), 652–660. [DOI:10.1038/nn.3690] [PMID]
Talesh, A., Zarei, A., Yazdi-Ravandi, S., Ghaleiha, A., Shamsaei, F., & Matinnia, N., et al. (2023). Balance-energy of resting state network in obsessive-compulsive disorder. Scientific Reports, 13(1), 10423. [DOI:10.1038/s41598-023-37304-9] [PMID]
Tosto, M. G., Momi, S. K., Asherson, P., & Malki, K. (2015). A systematic review of attention deficit hyperactivity disorder (ADHD) and mathematical ability: current findings and future implications. BMC Medicine, 13, 204. [DOI:10.1186/s12916-015-0414-4] [PMID]
Tzourio-Mazoyer, N., Landeau, B., Papathanassiou, D., Crivello, F., Etard, O., & Delcroix, N., et al. (2002). Automated anatomical labeling of activations in SPM using a macroscopic anatomical parcellation of the MNI MRI single-subject brain. NeuroImage, 15(1), 273–289. [DOI:10.1006/nimg.2001.0978] [PMID]
Weyandt, L., Swentosky, A., & Gudmundsdottir, B. G. (2013). Neuroimaging and ADHD: fMRI, PET, DTI findings, and methodological limitations. Developmental Neuropsychology, 38(4), 211-225. [DOI:10.1080/87565641.2013.783833] [PMID]
Type of Study: Original |
Subject:
Cognitive Neuroscience
Received: 2023/09/3 | Accepted: 2024/01/21 | Published: 2025/03/18
Received: 2023/09/3 | Accepted: 2024/01/21 | Published: 2025/03/18
Send email to the article author
| Rights and permissions | |
 |
This work is licensed under a Creative Commons Attribution-NonCommercial 4.0 International License. |
![]()
Copyright © The Author(s);
This is an open access article distributed under the terms of the Creative Commons Attribution License (CC-By-NC), which permits use, distribution, and reproduction in any medium, provided the original work is properly cited and is not used for commercial purposes.
Contact Information
