

Volume 16 - Special Issue on Cognitive Sciences
BCN 2025, 16 - Special Issue on Cognitive Sciences: 323-332 |
Back to browse issues page


Download citation:
BibTeX | RIS | EndNote | Medlars | ProCite | Reference Manager | RefWorks
Send citation to:


BibTeX | RIS | EndNote | Medlars | ProCite | Reference Manager | RefWorks
Send citation to:
Mobarezpour J, Latifi Z, Ghaderi R. Differential Complexity of Information Processing during Motor Imagination in Adults versus Children. BCN 2025; 16 (S1) :323-332
URL: http://bcn.iums.ac.ir/article-1-2759-en.html
URL: http://bcn.iums.ac.ir/article-1-2759-en.html
Differential Complexity of Information Processing during Motor Imagination in Adults versus Children


1- Institute for Cognitive and Brain Sciences, Shahid Beheshti University, Tehran, Iran.
2- Science & Research Branch, Islamic Azad University, Tehran, Iran.
2- Science & Research Branch, Islamic Azad University, Tehran, Iran.
Keywords: Motor imagery, Electroencephalography (EEG), Higuchi’s fractal dimension (HFD), Complexity
Full-Text [PDF 2152 kb]
| Abstract (HTML)
Full-Text:
1. Introduction
Motor imagery results from brain activities related to the imagination of a motor action without actually performing the movement. It is mainly based on the modulation of sensorimotor rhythms that could be traced by recording the μ (8–13 Hz) and β (13–30 Hz) frequency bands of EEG signals (Pfurtscheller, 2001b). Studies have shown that imagination of unilateral hand movement desynchronizes the µ rhythm at the contralateral side and synchronizes the β rhythm at the ipsilateral side (Pfurtscheller, 2001a). Moreover, the brain mechanism of motor imagery has been investigated using various techniques, including functional connectivity (Ghosh, 2015; Hamedi, 2015; Petrovic et al., 2017), power spectral density (Kim et al., 2018; Zhao, 2013), filter bank common spatial pattern (Ang et al., 2012), and fractal dimension (FD) (Aguilar, 2014; Liu et al., 2017), mainly to find a suitable feature for brain-computer interface (BCI) applications. Other studies have also shown that the complexities of information processing during motor imagination of various body parts are different (Phothisonothai & Nakagawa, 2007).
Nevertheless, it is still unclear whether motor imagery mechanisms change during development. In this study, we hypothesized that the brain mechanism of motor imagination changes during development from childhood to adulthood to handle more complex tasks. We aimed to show that when children develop, the brain mechanism related to motor imagination must also get more complicated. Increased EEG complexity is necessary to compress the related information for more complex tasks. The complexity of an electroencephalography (EEG) signal could be estimated by measuring its properties, such as nonlinearity, non-stationary, and chaotic behavior (Sheng, 2011).
The chaotic property of the EEG signal shows that it is not random, and its complexity can be estimated by measuring its FD (lEE, 2005). On the other hand, the EEG signal’s FD can be estimated in frequency, phase, or time domains (Raghavendra, 2010). In this study, we decided to calculate the FD of the EEG signal in the time domain based on its fractal geometry since it does not require any transfer to other spaces and typically takes less running time than other domains (Raghavendra, 2010). Fractal geometry is a mathematical tool to describe objects in space (Figure 1) (WikipedIa, 2025), and it is helpful for the analysis of biological data, such as the fractal structure of the nervous system (Di Ieva et al., 2015). In addition to structure, biological functions such as EEG and electrocardiography (ECG) signals have also presented fractal behavior. FD of a time series is a statistical measure that presents self-similarities over a time interval.
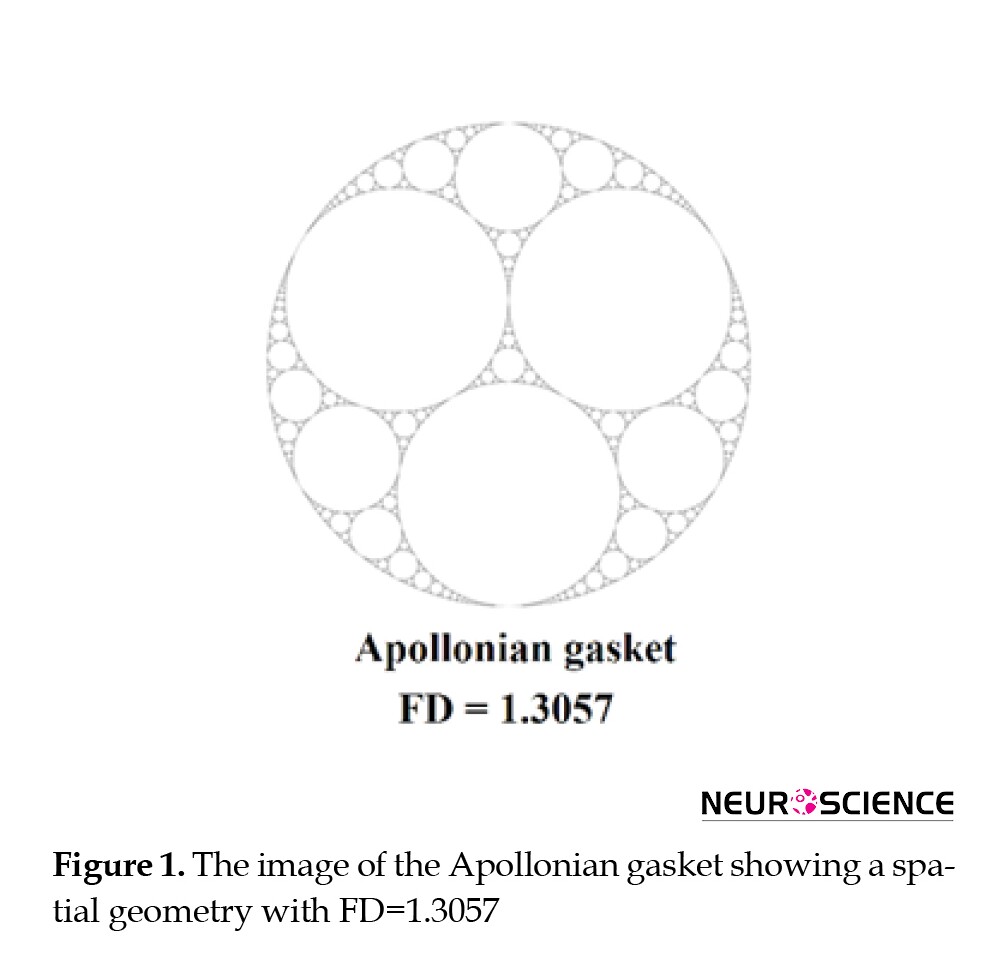
The FD of a time series signal has a value bigger than 1 and smaller than 2 (1< FD <2). Various methods can be used to calculate the fractal geometry, including Higuchi (Fraga, 2017; Raghavendra, 2010), Katz (Fraga, 2017; Raghavendra, 2010), and box-counting (Fraga, 2017; Raghavendra, 2010). The EEG time series used in this study comprised short interval trials; therefore, the Higuchi method, which accurately estimates the FD in short-time intervals, was used (Accardo et al., 1997; Al-Nuaimi et al., 2017; Esteller R, 2001; Higuchi, 1988). Subsequently, Higuchi’s FD (HFD) of EEG signal was statistically compared during the hand-motor imagination of children and adult groups. Experimental design and research methodology are explained in the following section. Then, data analysis and HFD comparisons of children and adult groups are presented. Subsequently, results are demonstrated, and conclusions on the findings are provided.
2. Materials and Methods
Study participants
This study recorded data for children from ten boys aged 8 to 13 years old (Mean±SD: 10.70±1.83) at the Institute for Cognitive and Brain Sciences, Shahid Beheshti University, Tehran City, Iran. Data for 9 male adults was also obtained from dataset 2a of the BCI competition IV (BCI Competition IV, 2025).
Experimental setup
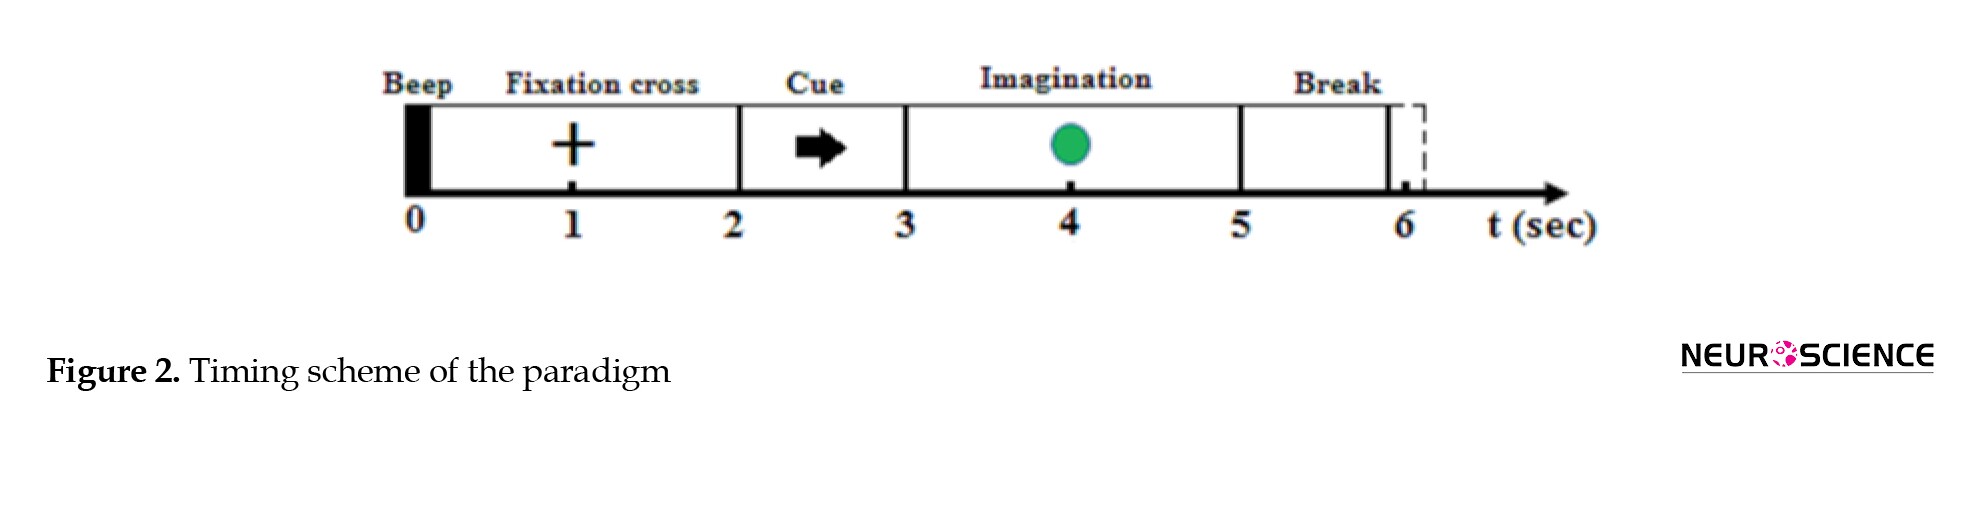
In this study, the subjects were seated in front of a 42-inch computer screen, and hand-motor imagery was performed in the following sequence. At the beginning of each trial (t=0 s), a short acoustic warning tone was presented, and a fixation cross appeared on the grey screen for 2 seconds. After two seconds (t=2 s), a cue in the form of an arrow pointing either to the left or right (corresponding to one of the two classes of left-hand or right-hand motor imagination) appeared and remained on the screen for 1 second. Subsequently, a green circular surface prompted the subjects 2 seconds to perform the desired motor imagery task without providing any feedback until the cue disappeared. A short break between 0.8 and 1.2 seconds was considered the inter-stimuli interval. Three rounds of 64 trials were presented to the subjects with 2.5 minutes rest between them. Figure 2 illustrates the experimental paradigm.
Data for adults were also recorded in the same paradigm from 9 adults during four different motor imagery tasks, including left hand (class 1), right hand (class 2), both feet (class 3), and the tongue (class 4) movement imagination. Only the left-hand and the right-hand data were used in our study.
Data recording and preprocessing
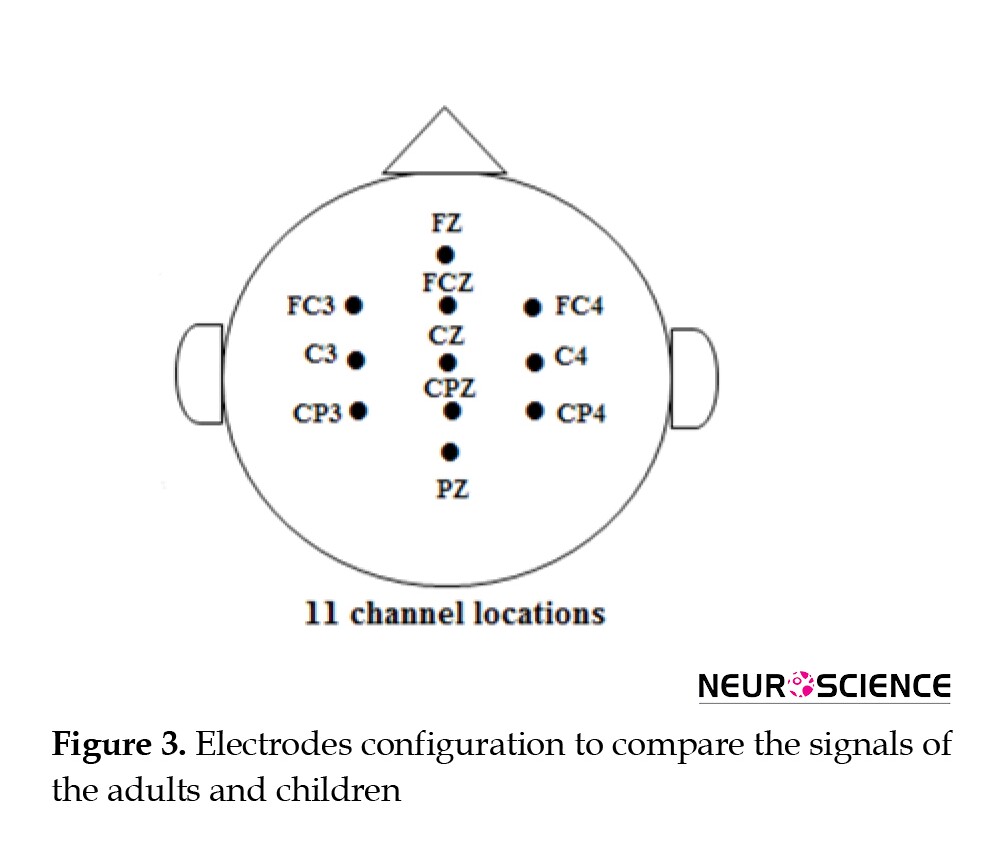
EEG data recording for children was performed using 32 Ag/AgCl electrodes with an EEG8 amplifier (PsychoLab, Contact Precision Instruments, UK) with a sampling frequency of 1024 Hz. Subsequently, a preprocessing pipeline was used to clean the EEG data. The preprocessing stages comprised removing linear bias, low-pass data filtering (<100 Hz), and re-referencing to the average channel. Then, to adopt the BCI competition IV study, the sampling rate was adjusted to 250 Hz, and the data of the 11 electrodes with common configurations in these two studies were chosen (Figure 3).
After that, EEG trials of 2 seconds were selected from the end of each cue. Finally, the average trials for each hand motor imagery class were used to compare adults and children.
Fractal analysis using Higuchi method
Higuchi’s FD (HFD) was used in this study to compare the motor imagination between two groups of adults and children. This method is suitable for short-time signals (Accardo et al., 1997; Al-Nuaimi et al., 2017; Esteller R, 2001; Higuchi, 1988). Since the HFD value depends on the window length and overlap size, various window lengths range from 440 to 600 ms with an overlap of 40 to 200 ms and an increasing step of 20 ms.
The HFD method converts short-term signals to new ones with different window lengths. For example, if a signal has N points. The new signals are like Equation 1.
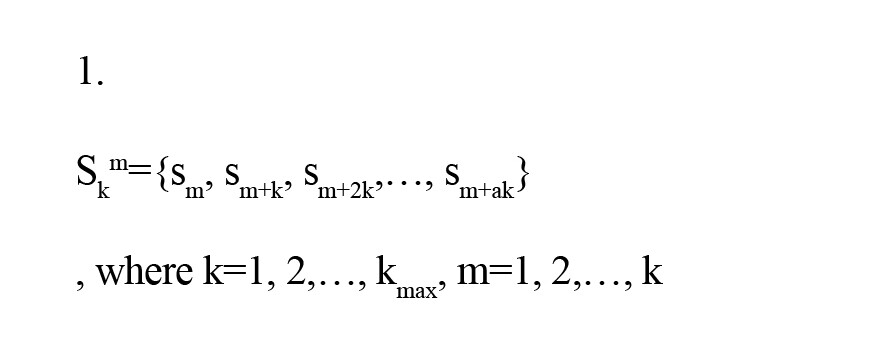
and a=(N-m)/k, which N is the number of the points and a rounds toward the floor.
Based on the results of previous studies (Hinrikus et al., 2011; Spasic et al., 2005), the maximum delay factor kmax=8 was chosen in this study.
The following example presents the forming of the time series if k=2 and N=100; then, for this case, those are as follows:
Each time series has a geometric length that is calculated by Equation 2.
, which (N-1)/ak is a normalizing factor. Subsequently, the mean geometric length for each case is determined by Equation 3.
If L ̅k□ α k-FD then the short-term signal is a fractal with dimension FD. Therefore, the graph of log10L ̅k□ versus log101/k should approximate a straight line with a slope equal to FD. This line is determined by a linear least squares method. In this study, the average of fractal dimensions in all window trials was calculated and noted as the HFD of the EEG signal.
3. Results
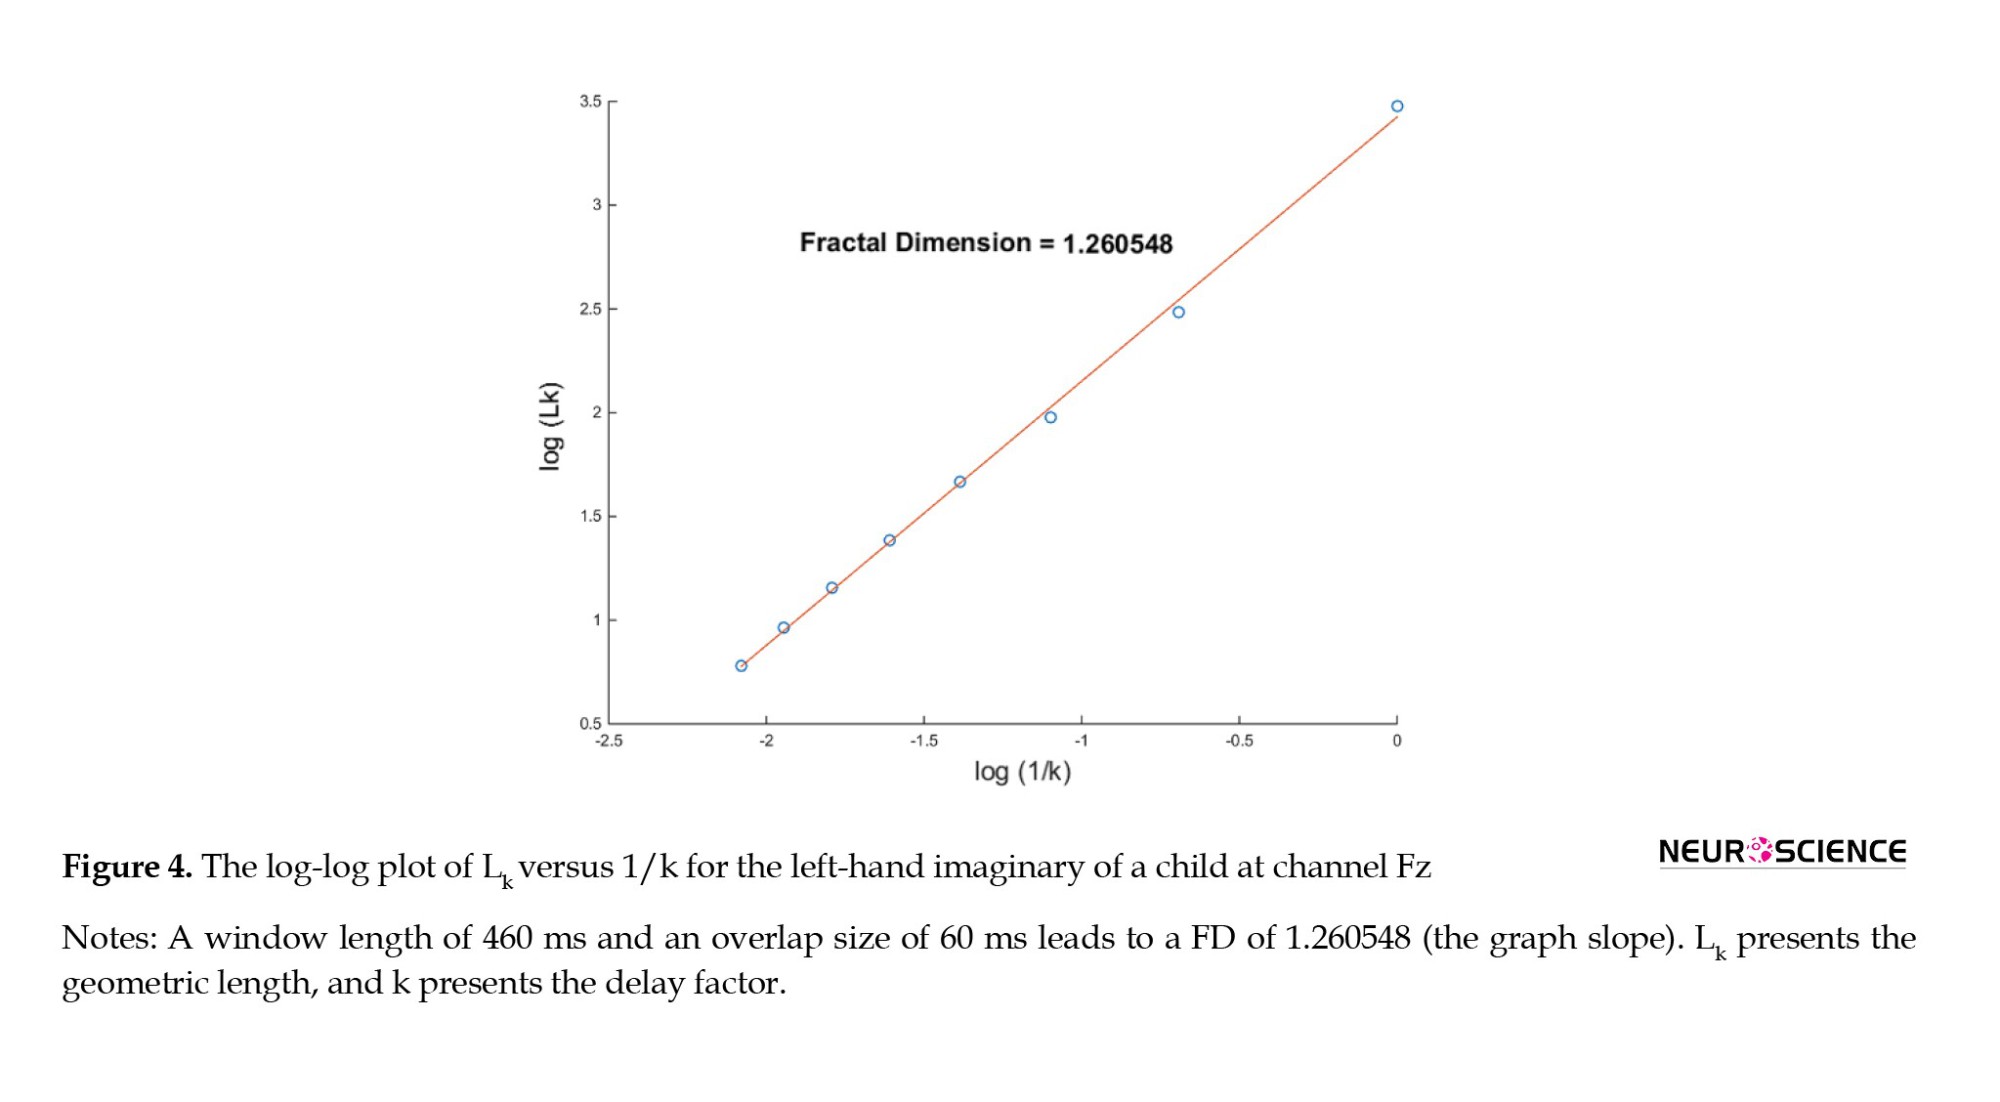
The HFD of EEG signals was calculated channel-wise for all subjects. The HFD was calculated in various window lengths with similar related overlap sizes (Figure 4).
Subsequently, a group-wise average of HFDs for different window lengths with their related overlap sizes was calculated for each channel distinctly (Figure 5).
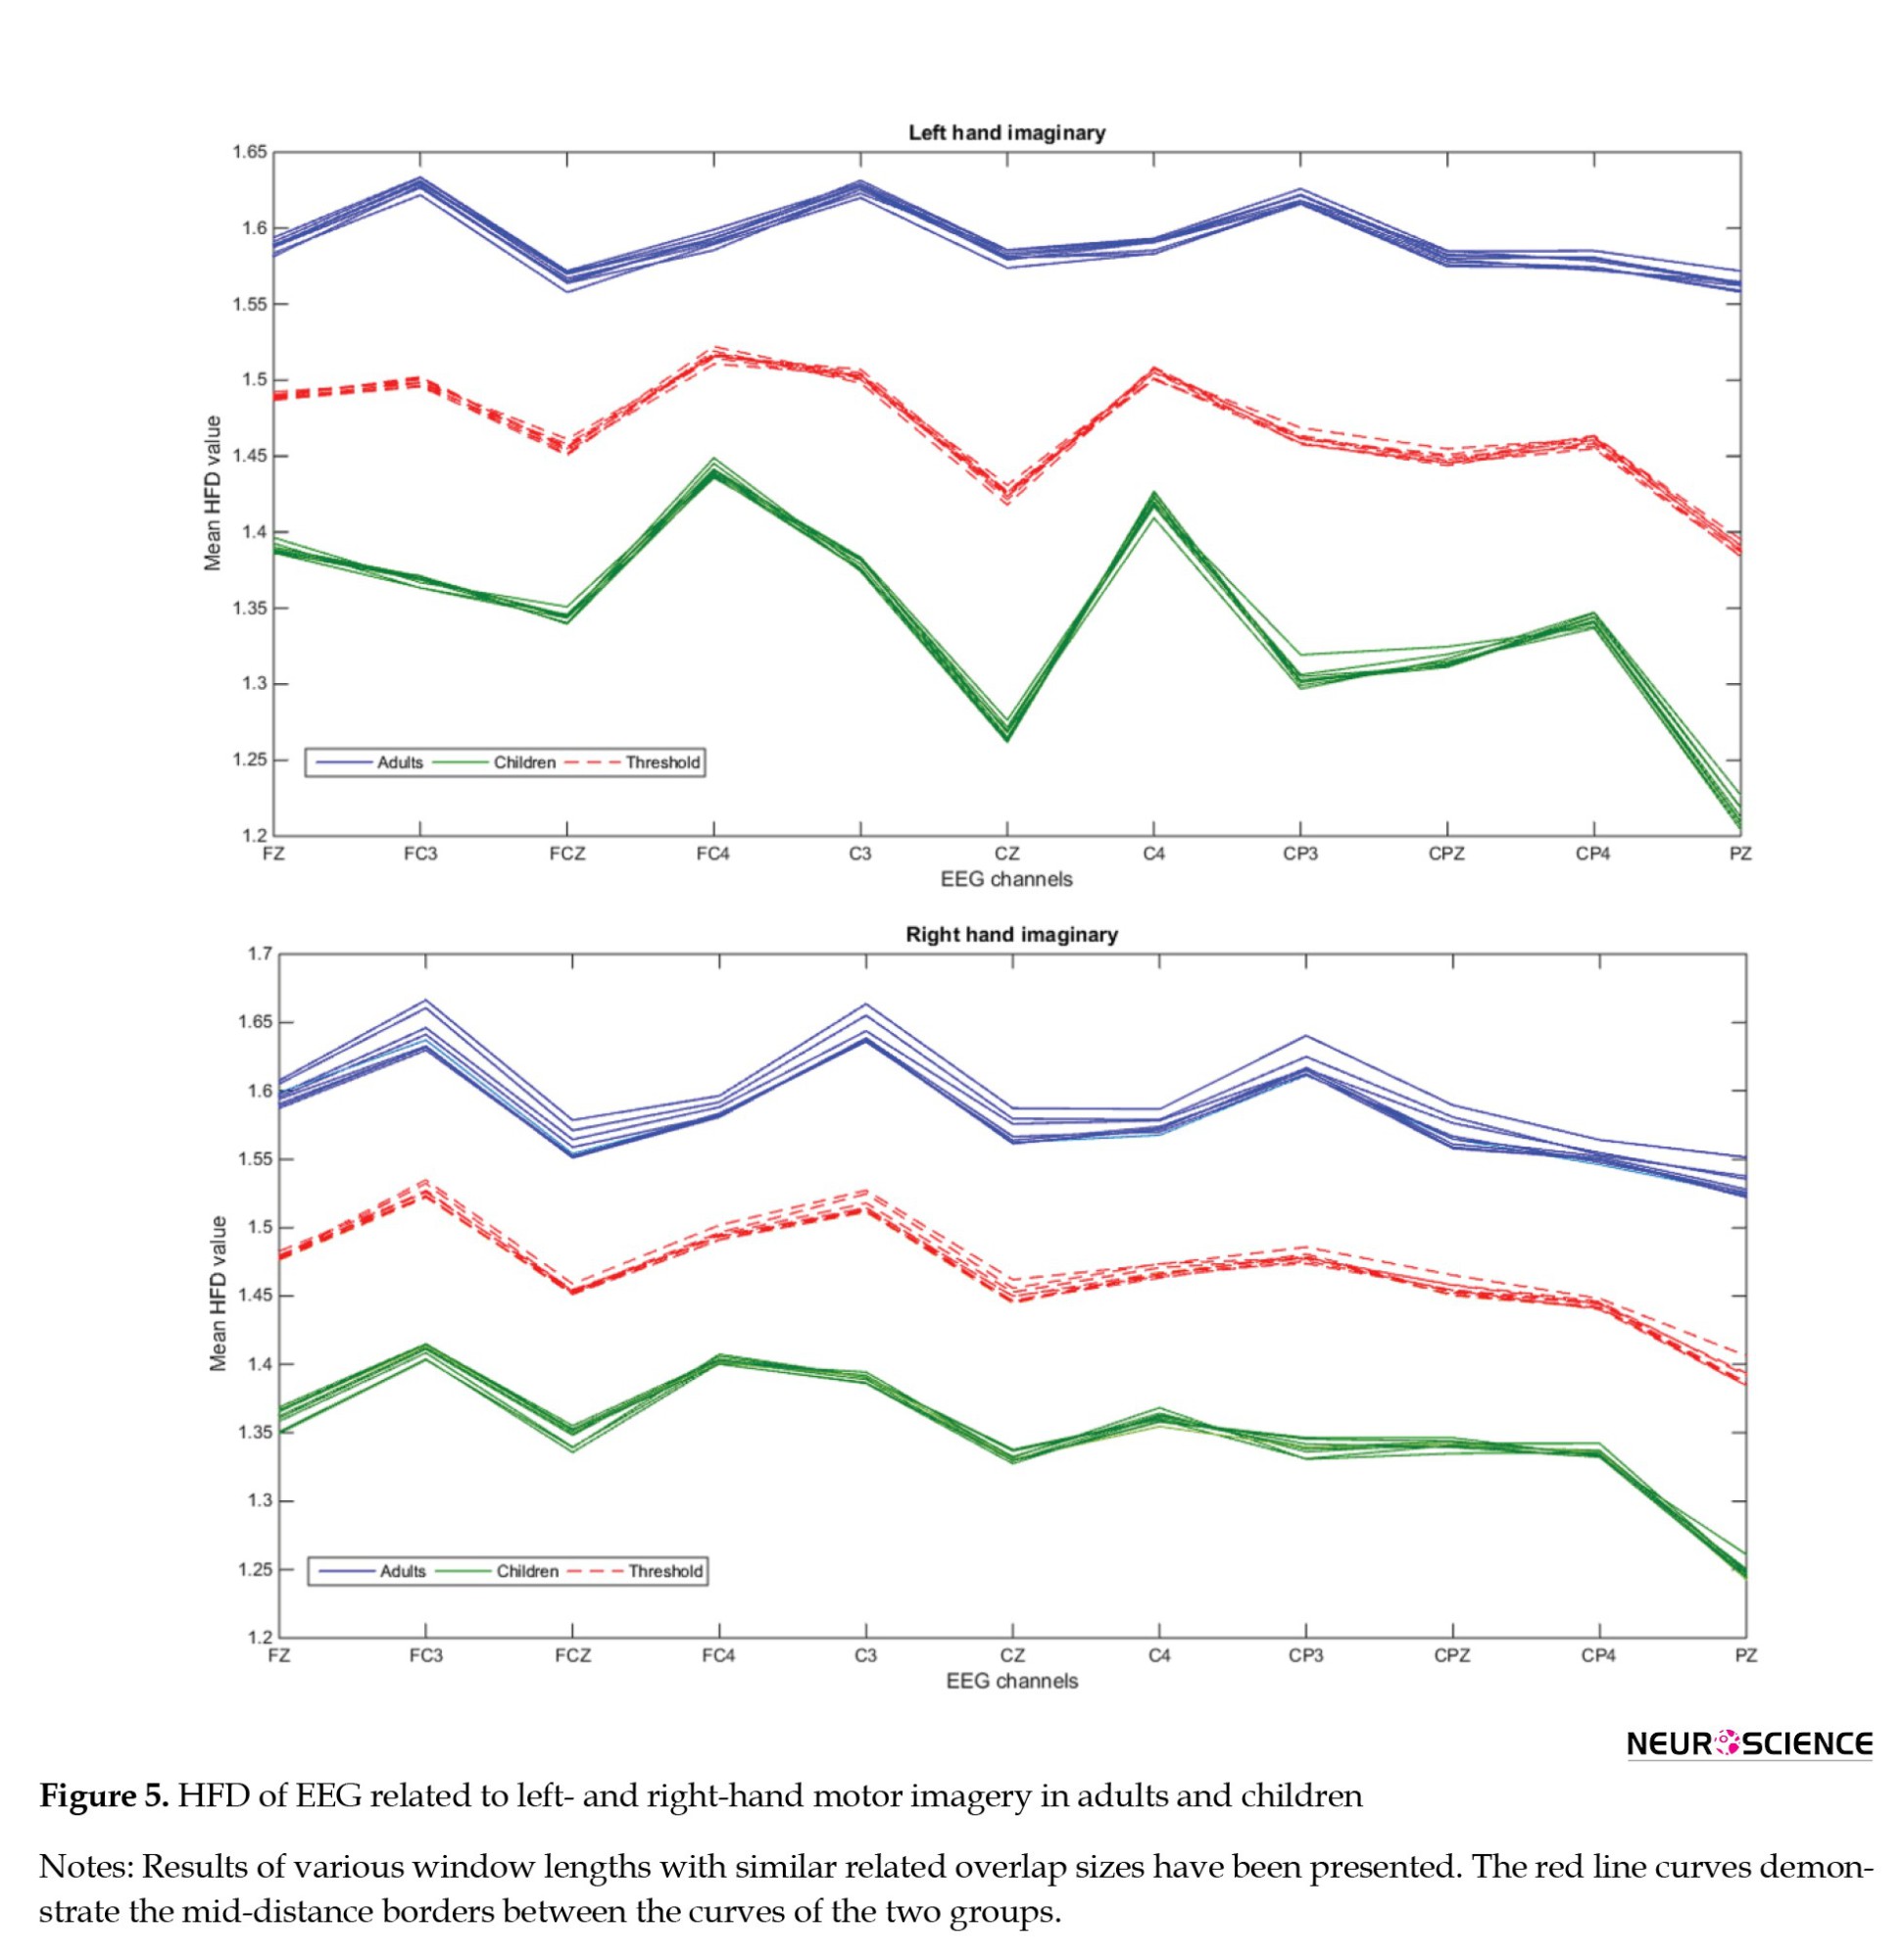
This information for left and right hands motor imagery was presented separately in Figure 5 with different curves. In the end, the average of these HFD graphs for both groups was calculated as a result of their HFD curve (Figure 6).

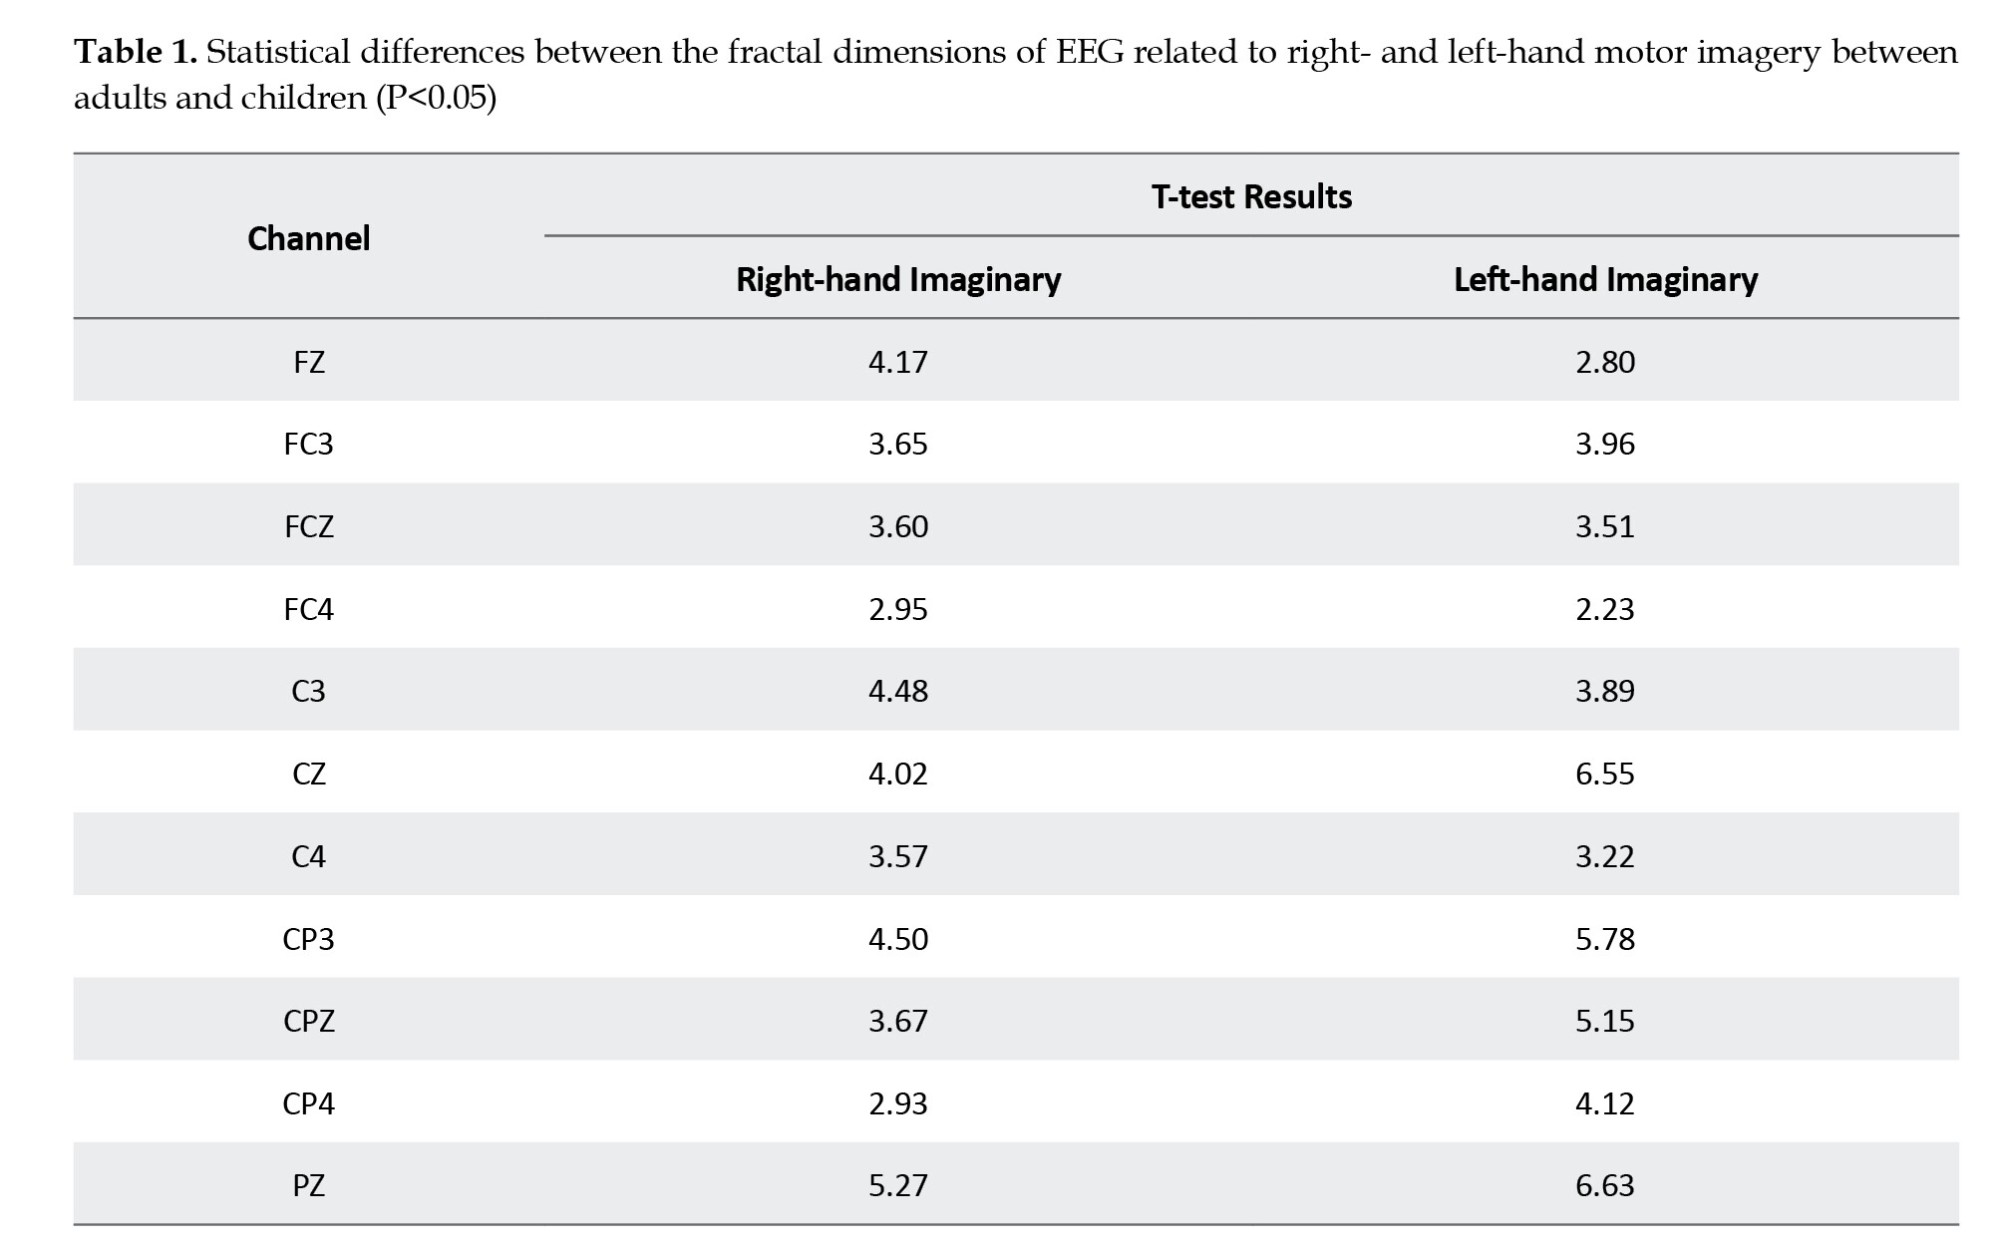
Finally, to determine whether the difference between the two groups is statistically significant, after the Kolmogorov-Smirnov test for normality, a two-sample t test was performed between HFDs of two groups for each channel separately. Significant results (P<0.05) are presented in Table 1, and topographical mapping of the contrast HFDs is presented in Figure 7.
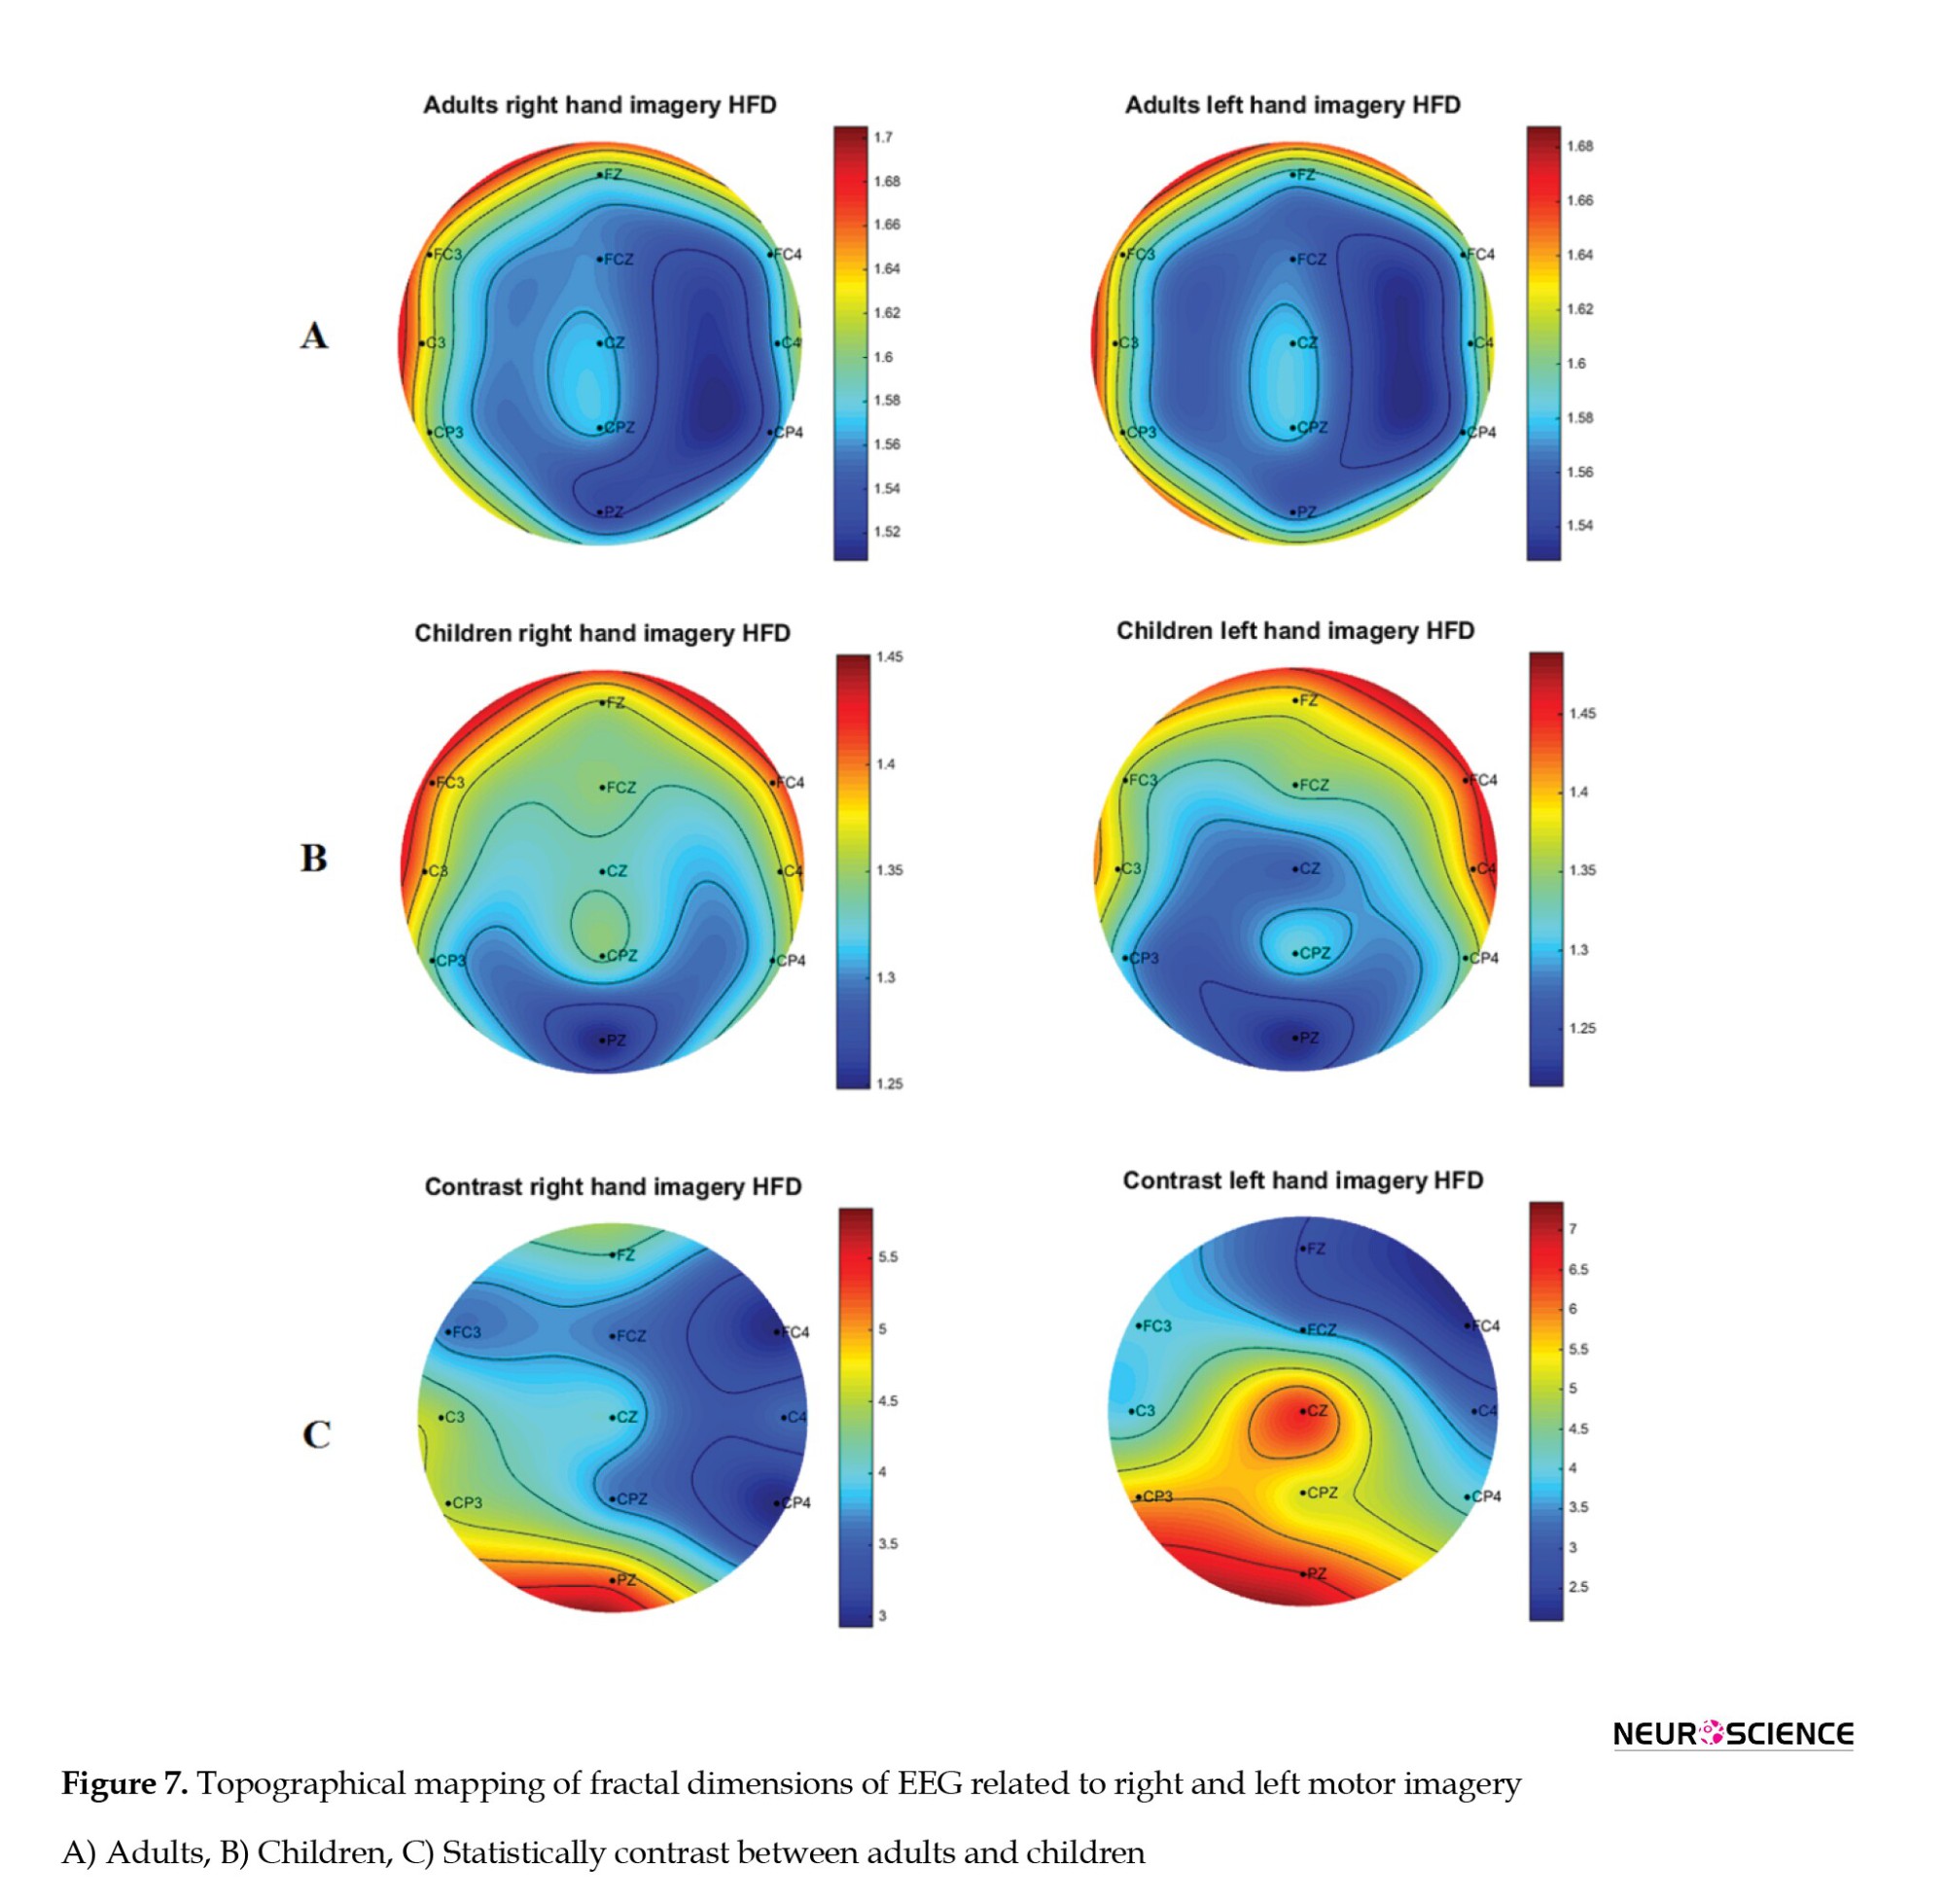
Based on the results, adults have a larger HFD than children on hand movement imagination at all electrodes. This means that adults’ imaginations are more complex than children’s. This finding suggests that patterns of information coding also develop when the child grows. This complexity change gained by learning and memory modifications in mind is discussed more in the next section.
4. Discussion
Motor imagination is one of the brain functions traced using EEG recording (Pfurtscheller, 2001b). Various EEG features could be used to estimate the neural mechanism of motor imagination (Ang et al., 2012; Ghosh, 2015; Hamedi, 2015; Aguilar, 2014; Kim et al., 2018; Liu et al., 2017; Petrovic et al., 2017; Zhao, 2013). Nevertheless, the developmental pattern of such a mechanism is still questionable. As it is known, motor movement and imagination expertise are enhanced during normal development (Spruijt et al., 2015; Yang, 2015).
Therefore, we hypothesized that the neural mechanism of motor imagery must also be expertized in a way that can handle this phenomenon. Such expertise could be estimated by measuring the complexity of information processing. This study assessed the complexity of information processing by measuring the HFD of the EEG signals. The EEG signals were recorded from two groups of healthy male children and adults during hand motor imagination.
The complexity of the brain functions as a dynamic system and has several statistical properties, including self-organization, fractal, scale-free, and self-similarity (Fingelkurts, 2013). Previous studies have shown that information processing in the brain is a power-law behavior (Fingelkurts, 2013). Therefore, the FD must present an estimate of the complexity of information processing. In this study, the Higuchi method was used to estimate the FD of EEG signals during the hand motor imagery to indicate the complexity of the process.
Our result showed higher FD of EEG signals during the hand motor imagery in adults than in children. This finding indicates that adults have more complex information processing patterns than children regarding hand-motor imagination.
5. Conclusion
We think of a compensatory mechanism enabling the brain to compress enormous amounts of information required for a more complex task. This means that the complexity of EEG signals increases when the necessary level of information processing increases. Such a reorganization could happen to evacuate the excess of information entropy and adapt to the new structure. We believe such a coexistence of self-organization and scale-free behavior improves the learning of motor actions during development. It should be noted that a more complex pattern of information processing does not mean a more accurate motor imagination, which could be investigated in future studies. Moreover, we showed that brain functionality related to hand-motor imagery has a scale-free behavior that improves during development. However, previous studies have shown that brain structure mainly follows a small-world pattern and may not follow the scale-free behavior of its functions. Overall, it is concluded that adults have a more complex pattern of EEG signals during hand-motor imagination than children. This difference is mainly related to the changes in the brain functions required for information compression. We hope these findings can help better understand changes in the brain mechanism of hand-motor imagination during development.
Ethical Considerations
Compliance with ethical guidelines
The study was performed in accordance with the Declaration of Helsinki. Participants’ parents or caregivers filled out an informed consent form before conducting the experiments.
Funding
This research did not receive any grant from funding agencies in the public, commercial, or non-profit sectors.
Authors' contributions
All authors contributed equally to the conception and design of the study, data collection and analysis, interception of the results and drafting of the manuscript. Each author approved the final version of the manuscript for submission.
Conflict of interest
The authors declared no conflict of interest.
References
Motor imagery results from brain activities related to the imagination of a motor action without actually performing the movement. It is mainly based on the modulation of sensorimotor rhythms that could be traced by recording the μ (8–13 Hz) and β (13–30 Hz) frequency bands of EEG signals (Pfurtscheller, 2001b). Studies have shown that imagination of unilateral hand movement desynchronizes the µ rhythm at the contralateral side and synchronizes the β rhythm at the ipsilateral side (Pfurtscheller, 2001a). Moreover, the brain mechanism of motor imagery has been investigated using various techniques, including functional connectivity (Ghosh, 2015; Hamedi, 2015; Petrovic et al., 2017), power spectral density (Kim et al., 2018; Zhao, 2013), filter bank common spatial pattern (Ang et al., 2012), and fractal dimension (FD) (Aguilar, 2014; Liu et al., 2017), mainly to find a suitable feature for brain-computer interface (BCI) applications. Other studies have also shown that the complexities of information processing during motor imagination of various body parts are different (Phothisonothai & Nakagawa, 2007).
Nevertheless, it is still unclear whether motor imagery mechanisms change during development. In this study, we hypothesized that the brain mechanism of motor imagination changes during development from childhood to adulthood to handle more complex tasks. We aimed to show that when children develop, the brain mechanism related to motor imagination must also get more complicated. Increased EEG complexity is necessary to compress the related information for more complex tasks. The complexity of an electroencephalography (EEG) signal could be estimated by measuring its properties, such as nonlinearity, non-stationary, and chaotic behavior (Sheng, 2011).
The chaotic property of the EEG signal shows that it is not random, and its complexity can be estimated by measuring its FD (lEE, 2005). On the other hand, the EEG signal’s FD can be estimated in frequency, phase, or time domains (Raghavendra, 2010). In this study, we decided to calculate the FD of the EEG signal in the time domain based on its fractal geometry since it does not require any transfer to other spaces and typically takes less running time than other domains (Raghavendra, 2010). Fractal geometry is a mathematical tool to describe objects in space (Figure 1) (WikipedIa, 2025), and it is helpful for the analysis of biological data, such as the fractal structure of the nervous system (Di Ieva et al., 2015). In addition to structure, biological functions such as EEG and electrocardiography (ECG) signals have also presented fractal behavior. FD of a time series is a statistical measure that presents self-similarities over a time interval.
The FD of a time series signal has a value bigger than 1 and smaller than 2 (1< FD <2). Various methods can be used to calculate the fractal geometry, including Higuchi (Fraga, 2017; Raghavendra, 2010), Katz (Fraga, 2017; Raghavendra, 2010), and box-counting (Fraga, 2017; Raghavendra, 2010). The EEG time series used in this study comprised short interval trials; therefore, the Higuchi method, which accurately estimates the FD in short-time intervals, was used (Accardo et al., 1997; Al-Nuaimi et al., 2017; Esteller R, 2001; Higuchi, 1988). Subsequently, Higuchi’s FD (HFD) of EEG signal was statistically compared during the hand-motor imagination of children and adult groups. Experimental design and research methodology are explained in the following section. Then, data analysis and HFD comparisons of children and adult groups are presented. Subsequently, results are demonstrated, and conclusions on the findings are provided.
2. Materials and Methods
Study participants
This study recorded data for children from ten boys aged 8 to 13 years old (Mean±SD: 10.70±1.83) at the Institute for Cognitive and Brain Sciences, Shahid Beheshti University, Tehran City, Iran. Data for 9 male adults was also obtained from dataset 2a of the BCI competition IV (BCI Competition IV, 2025).
Experimental setup
In this study, the subjects were seated in front of a 42-inch computer screen, and hand-motor imagery was performed in the following sequence. At the beginning of each trial (t=0 s), a short acoustic warning tone was presented, and a fixation cross appeared on the grey screen for 2 seconds. After two seconds (t=2 s), a cue in the form of an arrow pointing either to the left or right (corresponding to one of the two classes of left-hand or right-hand motor imagination) appeared and remained on the screen for 1 second. Subsequently, a green circular surface prompted the subjects 2 seconds to perform the desired motor imagery task without providing any feedback until the cue disappeared. A short break between 0.8 and 1.2 seconds was considered the inter-stimuli interval. Three rounds of 64 trials were presented to the subjects with 2.5 minutes rest between them. Figure 2 illustrates the experimental paradigm.
Data for adults were also recorded in the same paradigm from 9 adults during four different motor imagery tasks, including left hand (class 1), right hand (class 2), both feet (class 3), and the tongue (class 4) movement imagination. Only the left-hand and the right-hand data were used in our study.
Data recording and preprocessing
EEG data recording for children was performed using 32 Ag/AgCl electrodes with an EEG8 amplifier (PsychoLab, Contact Precision Instruments, UK) with a sampling frequency of 1024 Hz. Subsequently, a preprocessing pipeline was used to clean the EEG data. The preprocessing stages comprised removing linear bias, low-pass data filtering (<100 Hz), and re-referencing to the average channel. Then, to adopt the BCI competition IV study, the sampling rate was adjusted to 250 Hz, and the data of the 11 electrodes with common configurations in these two studies were chosen (Figure 3).
After that, EEG trials of 2 seconds were selected from the end of each cue. Finally, the average trials for each hand motor imagery class were used to compare adults and children.
Fractal analysis using Higuchi method
Higuchi’s FD (HFD) was used in this study to compare the motor imagination between two groups of adults and children. This method is suitable for short-time signals (Accardo et al., 1997; Al-Nuaimi et al., 2017; Esteller R, 2001; Higuchi, 1988). Since the HFD value depends on the window length and overlap size, various window lengths range from 440 to 600 ms with an overlap of 40 to 200 ms and an increasing step of 20 ms.
The HFD method converts short-term signals to new ones with different window lengths. For example, if a signal has N points. The new signals are like Equation 1.
and a=(N-m)/k, which N is the number of the points and a rounds toward the floor.
Based on the results of previous studies (Hinrikus et al., 2011; Spasic et al., 2005), the maximum delay factor kmax=8 was chosen in this study.
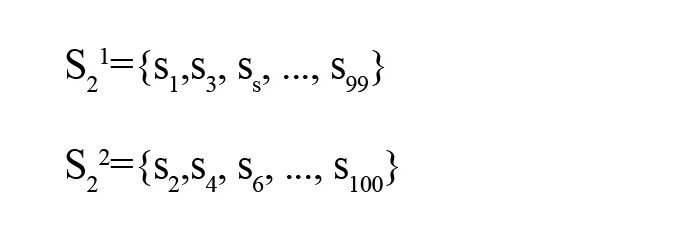
The following example presents the forming of the time series if k=2 and N=100; then, for this case, those are as follows:
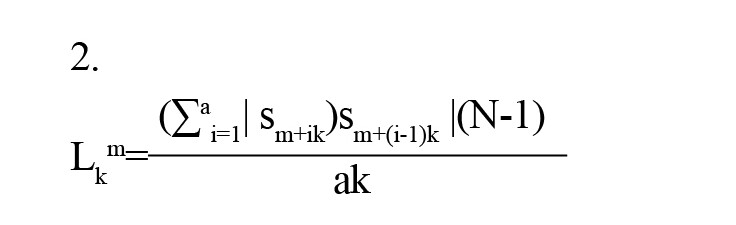
Each time series has a geometric length that is calculated by Equation 2.
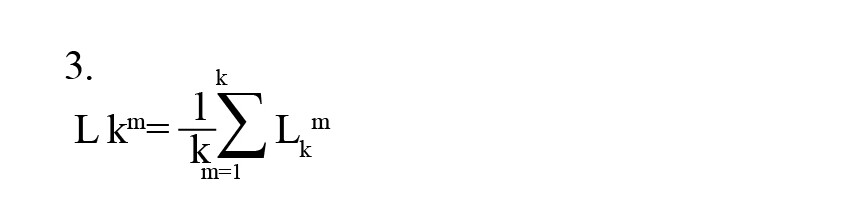
, which (N-1)/ak is a normalizing factor. Subsequently, the mean geometric length for each case is determined by Equation 3.
If L ̅k□ α k-FD then the short-term signal is a fractal with dimension FD. Therefore, the graph of log10L ̅k□ versus log101/k should approximate a straight line with a slope equal to FD. This line is determined by a linear least squares method. In this study, the average of fractal dimensions in all window trials was calculated and noted as the HFD of the EEG signal.
3. Results
The HFD of EEG signals was calculated channel-wise for all subjects. The HFD was calculated in various window lengths with similar related overlap sizes (Figure 4).
Subsequently, a group-wise average of HFDs for different window lengths with their related overlap sizes was calculated for each channel distinctly (Figure 5).
This information for left and right hands motor imagery was presented separately in Figure 5 with different curves. In the end, the average of these HFD graphs for both groups was calculated as a result of their HFD curve (Figure 6).
Finally, to determine whether the difference between the two groups is statistically significant, after the Kolmogorov-Smirnov test for normality, a two-sample t test was performed between HFDs of two groups for each channel separately. Significant results (P<0.05) are presented in Table 1, and topographical mapping of the contrast HFDs is presented in Figure 7.
Based on the results, adults have a larger HFD than children on hand movement imagination at all electrodes. This means that adults’ imaginations are more complex than children’s. This finding suggests that patterns of information coding also develop when the child grows. This complexity change gained by learning and memory modifications in mind is discussed more in the next section.
4. Discussion
Motor imagination is one of the brain functions traced using EEG recording (Pfurtscheller, 2001b). Various EEG features could be used to estimate the neural mechanism of motor imagination (Ang et al., 2012; Ghosh, 2015; Hamedi, 2015; Aguilar, 2014; Kim et al., 2018; Liu et al., 2017; Petrovic et al., 2017; Zhao, 2013). Nevertheless, the developmental pattern of such a mechanism is still questionable. As it is known, motor movement and imagination expertise are enhanced during normal development (Spruijt et al., 2015; Yang, 2015).
Therefore, we hypothesized that the neural mechanism of motor imagery must also be expertized in a way that can handle this phenomenon. Such expertise could be estimated by measuring the complexity of information processing. This study assessed the complexity of information processing by measuring the HFD of the EEG signals. The EEG signals were recorded from two groups of healthy male children and adults during hand motor imagination.
The complexity of the brain functions as a dynamic system and has several statistical properties, including self-organization, fractal, scale-free, and self-similarity (Fingelkurts, 2013). Previous studies have shown that information processing in the brain is a power-law behavior (Fingelkurts, 2013). Therefore, the FD must present an estimate of the complexity of information processing. In this study, the Higuchi method was used to estimate the FD of EEG signals during the hand motor imagery to indicate the complexity of the process.
Our result showed higher FD of EEG signals during the hand motor imagery in adults than in children. This finding indicates that adults have more complex information processing patterns than children regarding hand-motor imagination.
5. Conclusion
We think of a compensatory mechanism enabling the brain to compress enormous amounts of information required for a more complex task. This means that the complexity of EEG signals increases when the necessary level of information processing increases. Such a reorganization could happen to evacuate the excess of information entropy and adapt to the new structure. We believe such a coexistence of self-organization and scale-free behavior improves the learning of motor actions during development. It should be noted that a more complex pattern of information processing does not mean a more accurate motor imagination, which could be investigated in future studies. Moreover, we showed that brain functionality related to hand-motor imagery has a scale-free behavior that improves during development. However, previous studies have shown that brain structure mainly follows a small-world pattern and may not follow the scale-free behavior of its functions. Overall, it is concluded that adults have a more complex pattern of EEG signals during hand-motor imagination than children. This difference is mainly related to the changes in the brain functions required for information compression. We hope these findings can help better understand changes in the brain mechanism of hand-motor imagination during development.
Ethical Considerations
Compliance with ethical guidelines
The study was performed in accordance with the Declaration of Helsinki. Participants’ parents or caregivers filled out an informed consent form before conducting the experiments.
Funding
This research did not receive any grant from funding agencies in the public, commercial, or non-profit sectors.
Authors' contributions
All authors contributed equally to the conception and design of the study, data collection and analysis, interception of the results and drafting of the manuscript. Each author approved the final version of the manuscript for submission.
Conflict of interest
The authors declared no conflict of interest.
References
Accardo, A., Affinito, M., Carrozzi, M., & Bouquet, F. (1997). Use of the fractal dimension for the analysis of electroencephalographic time series. Biological Cybernetics, 77(5), 339–350. [DOI:10.1007/s004220050394] [PMID]
Al-Nuaimi, A. H., Jammeh, E., Sun, L., & Ifeachor, E. (2017). Higuchi fractal dimension of the electroencephalogram as a biomarker for early detection of Alzheimer’s disease. Annual International Conference of the IEEE Engineering in Medicine and Biology Society. IEEE Engineering in Medicine and Biology Society. Annual International Conference, 2017, 2320–2324. [DOI:10.1109/EMBC.2017.8037320] [PMID]
Ang, K. K., Chin, Z. Y., Wang, C., Guan, C., & Zhang, H. (2012). Filter bank common spatial pattern algorithm on BCI Competition IV Datasets 2a and 2b. Frontiers in Neuroscience, 6, 39. [DOI:10.3389/fnins.2012.00039]
Di Ieva, A., Esteban, F. J., Grizzi, F., Klonowski, W., & Martin-Landrove, M. (2015). Fractals in the neurosciences, Part II: Clinical applications and future perspectives. The Neuroscientist: A Review Journal Bringing Neurobiology, Neurology and Psychiatry, 21(1), 30–43. [DOI:10.1177/1073858413513928] [PMID]
Esteller R, V. G., Echauz, J., & Litt, B. (2001). A comparison of waveform fractal dimension algorithms. IEEE Transactions on Circuits and Systems I: Fundamental Theory and Applications, 48(2), 177-183. [DOI:10.1109/81.904882]
Fingelkurts, A. A.,Fingelkurts, A. A., & Neves, F. H. C. (2013). Consciousness as a phenomenon in the operational architectonics of brain organization: Criticality and self-organization considerations. Chaos Solitons & Fractals, 55, 13-31. [DOI:10.1016/j.chaos.2013.02.007]
Fraga, S. F. M., J. R. (2017). Comparison of higuchi, katz and multiresolution box-counting fractal dimension algorithms for eeg waveform signals based on event-related potentials. Revista Eia, 14(27), 73-83. [DOI:10.24050/reia.v14i27.864]
Ghosh, P., Mazumder, A., Bhattacharyya, S., Tibarewala, D. N., & Hayashibe, M. (2015). Functional connectivity analysis of motor imagery EEG signal for brain-computer interfacing application. Paper presented at: 7th International IEEE/EMBS Conference on Neural Engineering (NER), Montpellier, France, 22-24 April 2015. [DOI:10.1109/NER.2015.7146597]
Hamedi, M., Salleh, S. H., Samdin, S. B., & Noor, A. M. (2015). Motor imagery brain functional connectivity analysis via coherence. Paper presented at: 2015 IEEE International Conference on Signal and Image Processing Applications (ICSIPA), Kuala Lumpur, Malaysia, 19-21 October 2015. [Link]
Higuchi, T. (1988). Approach to an irregular time series on the basis of the fractal theory. Physica D: Nonlinear Phenomena, 31(2), 277-283. [DOI:10.1016/0167-2789(88)90081-4]
Hinrikus, H., Bachmann, M., Karai, D., Klonowski, W., Lass, J., & Stepien, P., et al. (2011). Higuchi’s fractal dimension for analysis of the effect of external periodic stressor on electrical oscillations in the brain. Medical & Biological Engineering & Computing, 49(5), 585–591.[DOI:10.1007/s11517-011-0768-5] [PMID]
Aguilar, J.M., Castillo, J., Elias, D. (2015). EEG Signals Processing Based on Fractal Dimension Features and Classified by Neural Network and Support Vector Machine in Motor Imagery for a BCI. In: Braidot, A., Hadad, A. (eds) VI Latin American Congress on Biomedical Engineering CLAIB 2014, Paraná, Argentina 29, 30 & 31 October 2014. IFMBE Proceedings, vol 49. Springer, Cham. [DOI: 10.1007/978-3-319-13117-7_157]
Kim, C., Sun, J., Liu, D., Wang, Q., & Paek, S. (2018). An effective feature extraction method by power spectral density of EEG signal for 2-class motor imagery-based BCI. Medical & Biological Engineering & Computing, 56(9), 1645–1658. [DOI:10.1007/s11517-017-1761-4] [PMID]
Lee, J. S., Kim, S. B., Yang, B. H., Spiegel, D., Choi, J. Y., & Choi, J. H., et al. (2005). Fractal Analysis of EEG during waking and hypnosis: laterality and regional differences. Psychiatry Investigation, 2(1), 53-60. [Link]
Liu, Y. H., Huang, S., & Huang, Y. D. (2017). Motor imagery EEG classification for patients with amyotrophic lateral sclerosis using fractal dimension and fisher’s criterion-based channel selection. Sensors (Basel, Switzerland), 17(7), 1557. [DOI:10.3390/s17071557] [PMID]
Petrovic, J., Milosevic, V., Zivkovic, M., Stojanov, D., Milojkovic, O., & Kalauzi, A., et al.(2017). Slower EEG alpha generation, synchronization and “flow”-possible biomarkers of cognitive impairment and neuropathology of minor stroke. PeerJ, 5, e3839. [DOI:10.7717/peerj.3839] [PMID]
Pfurtscheller, G. (2001). Functional brain imaging based on ERD/ERS. Vision Research, 41(10-11), 1257–1260. [DOI:10.1016/S0042-6989(00)00235-2] [PMID]
Pfurtscheller, G., & Neuper, C. (2001). Motor imagery and direct brain-computer communication. Proceedings of the IEEE, 89(7), 1123-1134. [DOI:10.1109/5.939829]
Phothisonothai, M., & Nakagawa, M. (2007). Fractal-based EEG data analysis of body parts movement imagery tasks. The Journal of Physiological Sciences: JPS, 57(4), 217–226. [DOI:10.2170/physiolsci.RP006307] [PMID]
Raghavendra, B. S., & Narayana Dutt, D. (2010). Computing fractal dimension of signals using multiresolution box-counting method. World Academy of Science, Engineering and Technology, 4(1), 183-198. [Link]
Sheng, H., & Chen, Y. (2011). Multifractional property analysis of human sleep EEG signals. Paper presented at: International Design Engineering Technical Conferences and Computers and Information in Engineering Conference, Washington, DC, USA, August 28-31. [DOI:10.1115/DETC2011-47878]
Spasic, S., Kalauzi, A., Grbic, G., Martac, L., & Culic, M. (2005). Fractal analysis of rat brain activity after injury. Medical & Biological Engineering & Computing, 43(3), 345–348. [DOI:10.1007/BF02345811] [PMID]
Spruijt, S., van der Kamp, J., & Steenbergen, B. (2015). Current insights in the development of children’s motor imagery ability. Front Psychol, 6, 787. [DOI:10.3389/fpsyg.2015.00787] [PMID]
Type of Study: Original |
Subject:
Cognitive Neuroscience
Received: 2023/07/25 | Accepted: 2023/09/23 | Published: 2025/03/18
Received: 2023/07/25 | Accepted: 2023/09/23 | Published: 2025/03/18
Send email to the article author
| Rights and permissions | |
 |
This work is licensed under a Creative Commons Attribution-NonCommercial 4.0 International License. |
![]()
Copyright © The Author(s);
This is an open access article distributed under the terms of the Creative Commons Attribution License (CC-By-NC), which permits use, distribution, and reproduction in any medium, provided the original work is properly cited and is not used for commercial purposes.
Contact Information
