

Volume 15, Issue 6 (November & December 2024)
BCN 2024, 15(6): 775-794 |
Back to browse issues page


Download citation:
BibTeX | RIS | EndNote | Medlars | ProCite | Reference Manager | RefWorks
Send citation to:


BibTeX | RIS | EndNote | Medlars | ProCite | Reference Manager | RefWorks
Send citation to:
Mirjebreili S M, Shalbaf R, Shalbaf A. Brain Activity Flow and Machine Learning for Predicting Drug Response in Patients With Major Depressive Disorder. BCN 2024; 15 (6) :775-794
URL: http://bcn.iums.ac.ir/article-1-2725-en.html
URL: http://bcn.iums.ac.ir/article-1-2725-en.html


1- Institute for Cognitive Science Studies, Tehran, Iran.
2- Department of Biomedical Engineering and Medical Physics, School of Medicine, Shahid Beheshti University of Medical Sciences, Tehran, Iran.
2- Department of Biomedical Engineering and Medical Physics, School of Medicine, Shahid Beheshti University of Medical Sciences, Tehran, Iran.
Keywords: Electroencephalogram (EEG), Effective connectivity, Major depressive disorder (MDD), Machine learning (ML)
Full-Text [PDF 3006 kb]
| Abstract (HTML)
Full-Text:
1. Introduction
Major depressive disorder (MDD) is the most commonly diagnosed psychiatric disorder worldwide, affecting more than 300 million individuals (Organization, 2017). Symptoms of MDD include changes in mood, interests, pleasure, cognitive functions, and vegetative symptoms. Furthermore, MDD increases the risk of developing conditions such as diabetes mellitus, heart disease, and stroke. MDD has also been associated with suicide, which is approximately the reason for half of the 800000 suicides worldwide (Otte et al., 2016).
In the present day, several antidepressants that act on neurotransmitter receptors are being used to treat depression. Almost all drugs act on two or more neurotransmitter receptors, i.e. two serotonin receptors, two noradrenergic receptors, or both. Also, several treatments are being investigated, including estrogen replacement therapy, mifepristone (RU-486 or C-1073), as well as antagonists, such as corticotropin-releasing factor, neurokinins, and injectable pentapeptides (Sambunaris et al., 1997; Stahl & Grady, 2003). MDD is a highly heterogeneous disorder, meaning that only a few people find antidepressants effective. Several pretreatment variables have been found to moderate the treatment response, including depression severity and neuroticism, older age, less impairment in cognitive control, and employment (Cohen & DeRubeis, 2018; Webb et al., 2019).
In general, 40% of people suffering from MDD have treatment-resistant depression (TRD) since treatment of MDD requires a trial-and-error sequential treatment strategy, and first-line therapies do not meet their needs (Arteaga-Henríquez et al., 2019; Berlim et al., 2008; Leuchter et al., 2009). Often, MDD patients suffer from delayed treatment response, functional impairment, increased suicide risk, and high medical costs due to the inability to predict which treatment will work. Consequently, more effective treatment strategies for patients with MDD are urgently needed (Bremer et al., 2018; Goldman et al., 1999; Schwartz et al., 2021).
Because of advances in neuroimaging techniques, biomarkers from neuroimaging studies are of great value for achieving precision medicine for many psychiatric disorders (Kang & Cho, 2020). In recent years, neuroimaging studies have been published utilizing a variety of methods, including electroencephalogram (EEG), brain volumetric magnetic resonance imaging (MRI), functional magnetic resonance imaging (fMRI), and diffusion tensor imaging to identify biomarkers for treatment response to antidepressants (Kemp et al., 2008). EEGs can be an effective and relatively inexpensive method for studying developmental changes in brain-behavior relationships, and their high temporal resolution makes them particularly useful for examining neural activity flow in the nervous system (Bell & Cuevas, 2012; Smit et al., 2008).
Recently, many studies have focused on EEG to predict how a patient will respond to antidepressant medication (de la Salle et al., 2020; Jaworska et al., 2019; Khodayari-Rostamabad et al., 2013; Shahabi & Shalbaf, 2022). For example, patients who respond to treatment demonstrate improved absolute alpha power at baseline, which can be used as a biomarker to predict treatment response (Baskaran et al., 2018). Also, the interhemispheric neural activity flow in the temporal lobe exhibits 99.61% classification capability using only four EEG channels (Zhang et al., 2022). A study conducted by Mumtaz et al. (2017) involved extracting time-frequency features from different frequency bands of EEG signals and classifying them by using three time-frequency decomposition techniques, including wavelet transforms, short-time Fourier transforms, and empirical modes of decompositions, to predict treatment-outcome for MDD patients. Combining the best features from the decomposition methods described above provides a classification accuracy of 91.6% (Mumtaz et al., 2017). Likewise, Jaworska et al. utilized demographical features with EEG data to improve the classification results (Jaworska et al., 2019). As demonstrated by Salle et al., changes in theta cordance of the prefrontal and midline right frontal in the first week of treatment can provide a predictive indicator of the response to antidepressants (de la Salle et al., 2020). Additionally, Kautzky et al. used a random forest approach to correctly identify 25% of patients with TRD based on clinical variables and three polymorphisms (Kautzky et al., 2015). Moreover, Patel et al. predicted an 89% treatment response using various biometrics, including demographic information and structural and functional imaging features (Patel et al., 2015).
This research significantly contributes to predicting treatment outcomes in MDD through the innovative use of neural activity flow based on the direct directed transfer function (dDTF). Firstly, we demonstrate that neural activity flow features, particularly those derived from the dDTF, can accurately predict antidepressant response in MDD patients. It provides insight into differentiating between individuals who positively respond to selective serotonin reuptake inhibitors (SSRIs) and those who do not. Secondly, our work achieves new state-of-the-art accuracy in EEG-based prediction for MDD treatment by incorporating neural activity flow as a feature in machine learning (ML) models, including support vector machines (SVMs), linear discriminant analysis (LDA), decision trees (DT), and random forests (RF), surpassing existing benchmarks and enhancing the potential clinical applicability of our findings. Lastly, our analysis identifies specific brain regions and networks that indicate treatment failure in MDD, enriching our understanding of the neural underpinnings of treatment outcomes and offering critical insights for developing targeted interventions. In summary, our work presents a novel and comprehensive approach to predicting treatment outcomes in MDD, leveraging neural activity flow and ML models. Our contributions include the accurate prediction of antidepressant response, achieving state-of-the-art accuracy in EEG-based prediction, and identifying specific neural correlates of treatment failure, collectively representing a significant step forward in the field and providing valuable insights and tools for advancing personalized treatment strategies for individuals with MDD.
2. Materials and Methods
Dataset
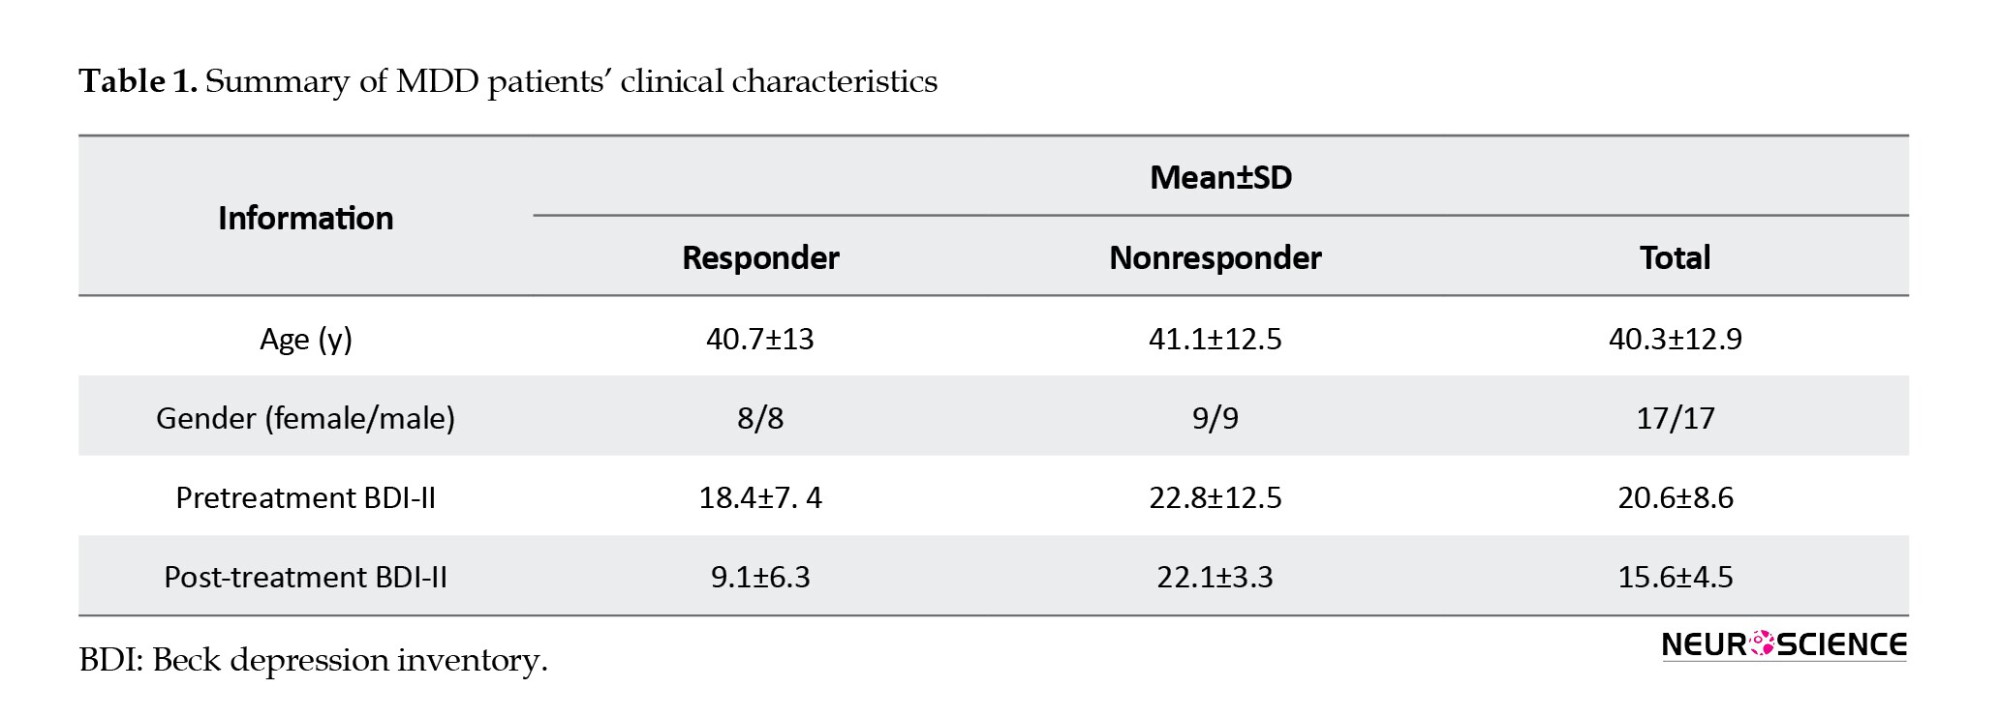
The EEG signal dataset used in this study was provided by Mumtaz et al. (2017). The data sets included 34 MDD patients and 30 healthy individuals. Among the 34 MDD patients, 17 men and 17 women have a mean age of 40.3±12.9 years. For the eyes closed condition, only 30 EEG segments, of 19 channels each, were available, which were used in this study. MDD patients were diagnosed using the diagnostic and statistical manual of mental disorders, fourth edition (DSM-IV) criteria (GUZE, 1995). An MDD patient was treated for four weeks with SSRI antidepressants. If there is a 50% improvement from pre- to post-treatment, the MDD patient is considered a responder; otherwise, the subject is considered a nonresponder. Based on the Beck depression inventory (BDI), 12 patients responded to treatment, while 18 patients showed no significant improvement (Table 1).
The 10-20 electrode placement system records the EEG for 5 minutes using a 19-electrode EEG cap with linked-ear references. Five different brain regions are represented by electrodes: The frontal lobe containing Fp1, F3, F7, Fz, Fp2, F4, and F8; the parietal lobe containing P3, Pz, and P4; the occipital lobe containing O1 and O2; the left and right temporal lobe containing T3, T4, T5, T6 electrodes; and finally the central lobe with C3, C4, and Cz electrodes.
EEG preprocessing
To prevent erroneous subsequent analysis and ensure that the underlying neuronal activity is accurately reflected in the data, the preprocessing steps have been carried out using the EEGLAB open-source toolbox. To remove baseline drift, a 1-Hz high-pass filter is first applied. Then, the CleanLine open-source plugin is used to remove line noise. Lastly, 3 minutes of data are used for further analysis.
Effective connectivity
The concept of effective connectivity or neural activity flow refers to the influence a node has over another based on a model of neuronal integration, which identifies neuronal coupling mechanisms (Liu et al., 2017). Among the first models used to establish causality between two time series is Granger causality, which was introduced in economics. As explained by Granger causality, a time series of X1 causes a time series X2, if knowledge of X1 helps to make predictions of X2 more accurate (Granger, 1969). A measure of brain activity associated with Granger causality is the DTF. This function represents a linear combination of causal influences along all causal pathways, direct and indirect, beginning at one site and ending at another (Korzeniewska et al., 2008). To distinguish direct from indirect flows, a dDTF is proposed (Korzeniewska et al., 2003). The dDTF method determines the strength and direction of the direct flow of neural activity using DTF combined with partial coherence. To calculate the dDTF, the source information flow toolbox (SIFT) is used (Delorme et al., 2011; Mullen, 2014). Through SIFT, each subject’s EEG data was divided into 18 segments, each lasting 10 seconds. A multivariate autoregressive (MVAR) model of order 20 was then fitted to the data, satisfying two criteria of stability and consistency. This process indicates that the model produces data with the same correlation structure as the actual EEG data and is stable/stationary. This step is crucial in ensuring the accuracy and reliability of subsequent analyses. Then, dDTF values were calculated for each data segment across all frequency ranges, and since we had 19 electrodes, a matrix with the shape of 19*19* frequency was obtained. At the end of the process, the delta (1-4 Hz), theta (4-8 Hz), alpha (8-13 Hz), beta (13-30 Hz), and gamma (30-45 Hz) bands were extracted.
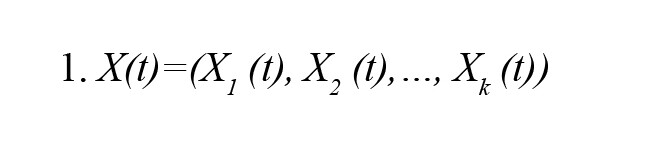
To provide an overview of the dDTF method, the EEG signal is first fitted with an MVAR model. Then, to model a k-channel process, X(t) is modeled as follows (Equation 1):
This equation would lead to the following expression for the MVAR model:
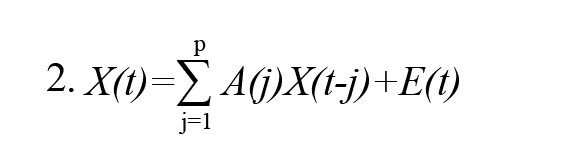
In the above Equation, X(t) represents the data vector in time t, E(t) represents the white noise vector, A(i) represents the model coefficients, and p represents the order of the model. After that, as a result of converting the model Equation into a frequency domain, we obtain:
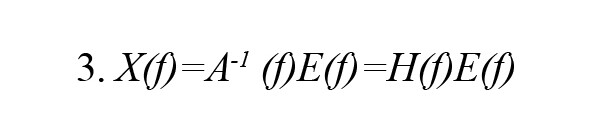
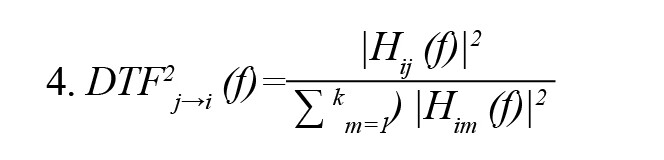
In the above Equation, X(f) is the input signal, E(f) is white noise, and the H(f) matrix is referred to as the transfer matrix of the system, in which f denotes the frequency of the input signal. The DTF can be defined as follows in accordance with the transfer function of MVAR:
For the dDTF formula, the DTF must be modified with partial coherence as follows:
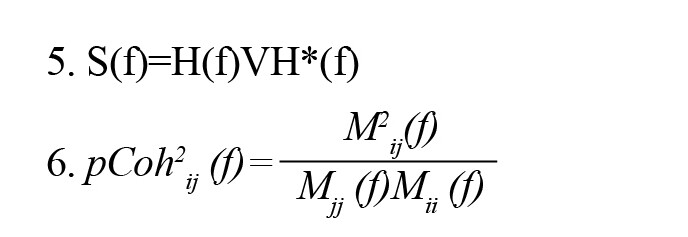
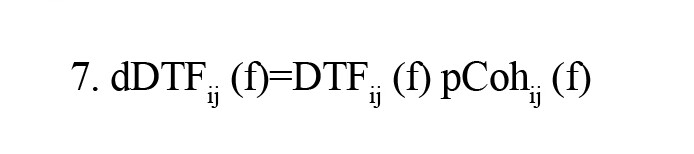
where S(f) is power spectra, V is the variance of the noise E(f) and Mij is spectral matrix S by removing the ith row and jth column. Finally, dDTF is defined by the given formula:
Feature selection
To select the best features for discriminating between responder and nonresponder groups, one-seventh of the data was set aside for testing, and then LDA was used to calculate the area under a curve (AUC) of every neural activity flow in each band. This study uses the AUC since the area under the receiver operating characteristic curve (AUC-ROC) is equivalent to the Mann–Whitney U statistic (Mason & Graham, 2002). ROC curves were calculated by comparing the model’s false-positive rate against its true-positive rate across a range of thresholds. AUC-ROC value was obtained based on the mean values of all CV sets. The mean AUCs are a valid measure of the model’s performance in a generalized setting in which the model was trained, given that each of the analyzed learners received a unique training set and a unique model-external validation dataset during training. Next, the top 30 connections from each band with the highest AUC are selected; then, the feature selection algorithms are applied.
This paper uses three feature selection methods. The first is based on the area AUC-ROC. In this method, a subset of features is assessed empirically by measuring the prediction accuracy of the feature subset selected by our method. In other words, the forward selection is an iterative process in which we start without any features in the model. We continue to add new features to our model in each iteration, and then we select the subset of features with the highest accuracy out of all the others (Mamitsuka, 2006). Second, the minimum-redundancy maximum-relevance (mRMR) algorithm has been used to rank features to minimize redundancy while maximizing relevance. The mRMR algorithm uses mutual information to compute similarity scores between features and labels of a subset, aiming to minimize the mean mutual information between two features and to maximize the mean mutual information between each feature and the specific label (Amini et al., 2023; Ding & Peng, 2005; Şen et al., 2014). As for the last method, ReliefF is used. Like k-nearest neighbors, ReliefF assigns weights to each feature based on its ability to separate class labels. If the squared Euclidean distance between a feature and its nearest instances of the same class is greater than the distance between the two instances of the other class, the weight of the feature decreases. Based on the Manhattan distance, ReliefF calculates both negative and positive weights for each feature (Al-Nafjan, 2022; Peker et al., 2015).
Classification
In artificial intelligence, supervised learning refers to a subcategory of ML that uses labeled datasets to train algorithms capable of classifying data or predicting outcomes. SVMs are supervised learning algorithms used to classify two data groups. The algorithms draw lines (hyperplanes) to separate groups based on their patterns. An SVM builds a learning model that assigns new examples to one group or another. As a result of these functions, SVMs are called non-probabilistic binary linear classifiers. This paper also uses a random forest composed of many individual decision trees. Trees in the forest generate a class prediction, and the class with the most votes determines the class prediction for our model. In addition, the LDA classifier is used to classify two groups using a linear combination of features.
Statistical analysis
The AUC value was calculated for each neural activity flow to evaluate the importance of each neural activity flow. Afterward, the 30 top connections with the highest value were selected. Also, to evaluate any ML model’s performance, we need to test it on some unseen data. Based on the model’s performance on unseen data, we could say whether our model is under-fitting, over-fitting, or well-generalized. A cross-validation (CV) procedure is used to assess the effectiveness of ML models; it can also be used to evaluate a model if we have insufficient data. For a CV to be performed, some training data must be kept aside for evaluation later. In this paper, the k-fold method was used for CV. During k-fold cross-validation, the original sample is divided into k subsamples of equal size. A single subsample of the k subsamples was retained as the validation data for testing the model, while the remaining k-1 subsamples were used as training data for training the model. In the process of trial and error, it was determined that 7 is the optimal value for k. Further analysis was conducted based on the results of the 7-fold CV.
Overview of the proposed method
Figure 1 illustrates the proposed method. In the first step, raw EEG data were preprocessed using EEG-Lab, an open-source toolbox. A high-pass filter with a 1-Hz frequency and CleanLine noise were applied as part of the preprocessing steps. Afterward, the signals were divided into 18 segments, each lasting 10 seconds. The neural activity flow was calculated from each segment, and a matrix of 19-channels * 19-channels * 45-frequency steps was obtained. Then, the delta, theta, alpha, beta, and gamma bands are extracted by averaging over the frequency ranges of 1-4 Hz, 4-8 Hz, 8-13 Hz, 13-30 Hz, and 30-45 Hz. Following this, AUC-ROC forward feature selection, mRMR, and Relief-F algorithms were used to find the best features from all frequency bands. The selected features trained SVM, LDA, RF, and DT classifiers.

3. Results
Topographic maps
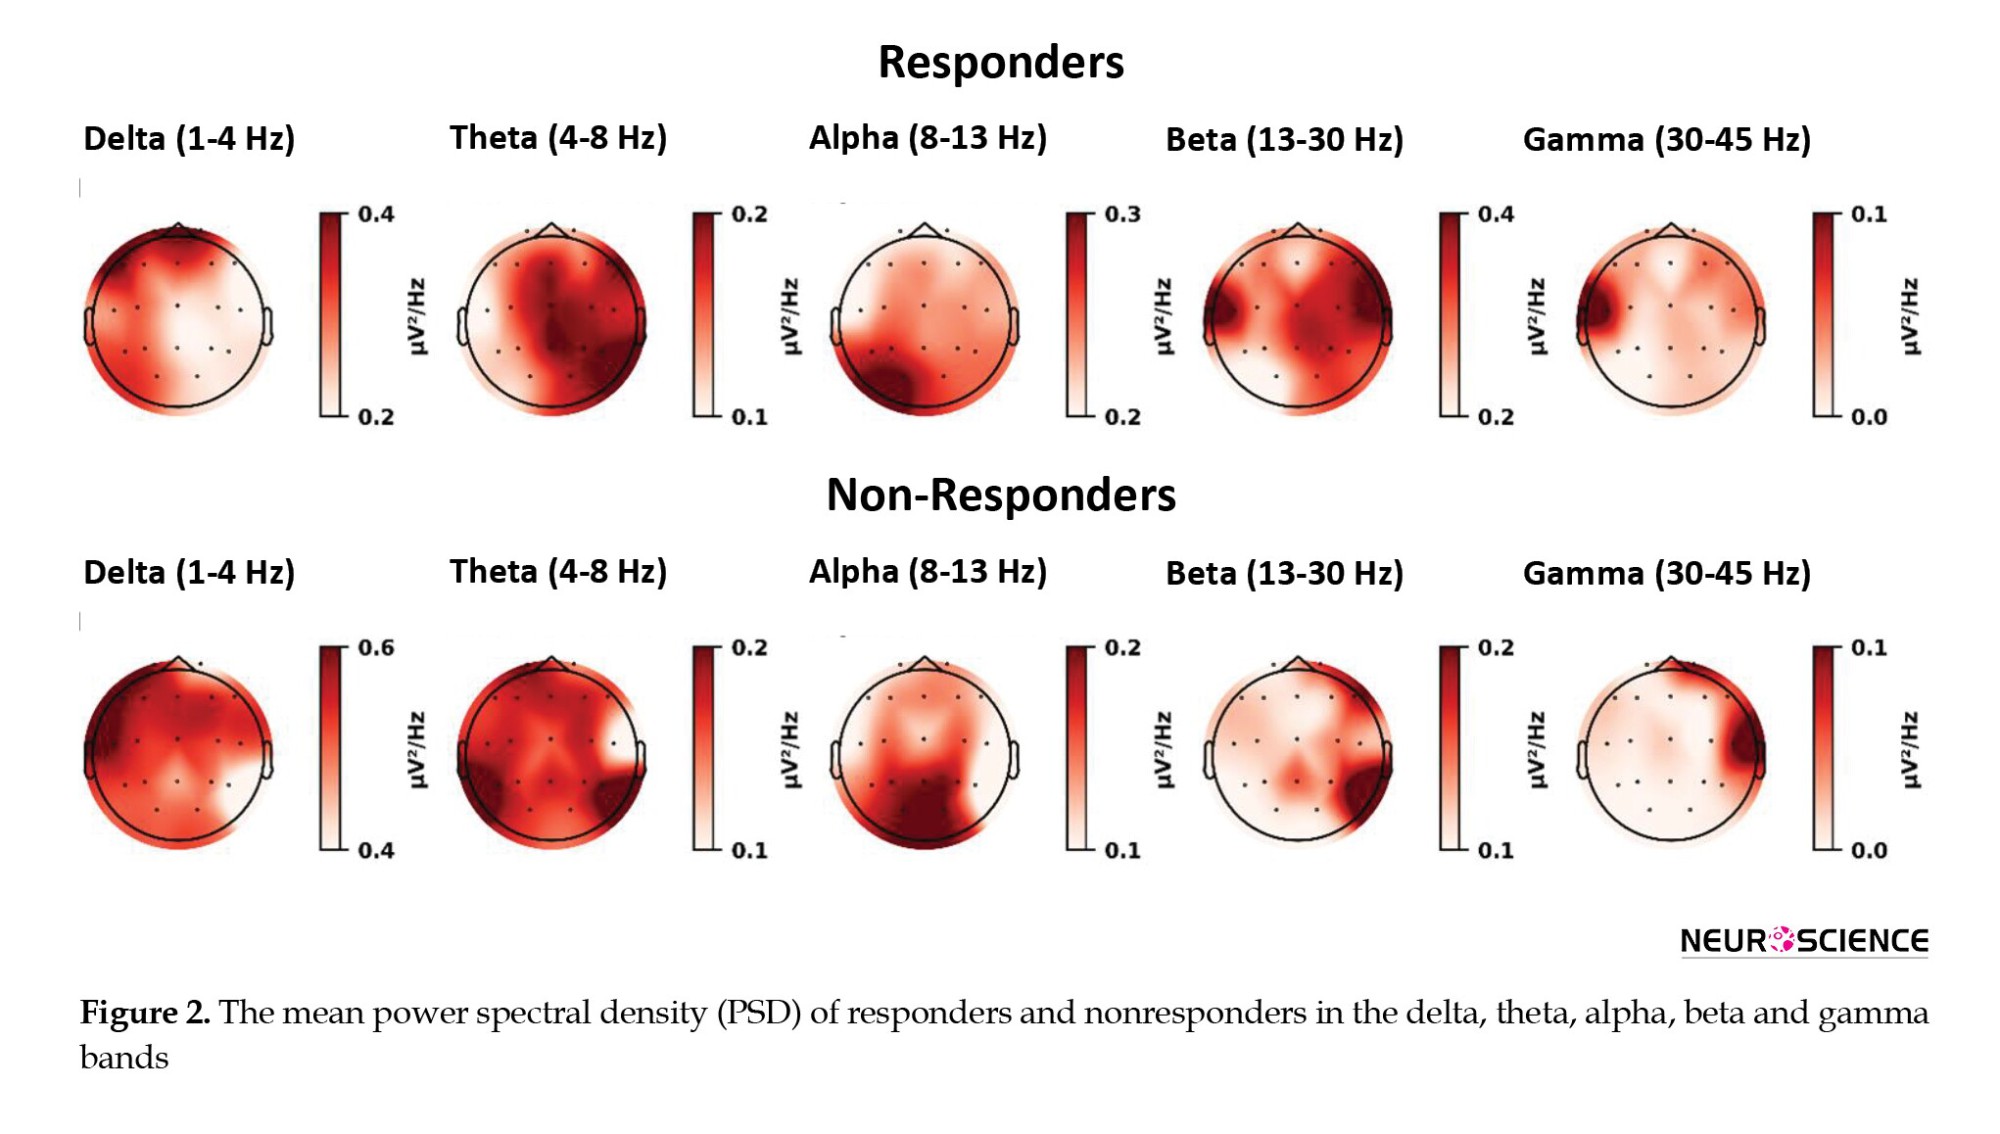
Figure 2 shows topographic maps for MDD patients in the five frequency ranges of delta, theta, alpha, beta, and gamma. It is clear from this figure that the responder group shows lower delta power compared to the nonresponder group, whereas the responders show higher beta power. In the theta band, the most significant difference is observed in the left temporoparietal lobe, whereas in the alpha band, the most significant difference is observed in the central areas. As can be observed in the beta band, respondents generally showed higher power, particularly in the left temporal lobe, which is also observed in gamma.
Regional differences in responders versus nonresponders
After calculating each segment’s neural activity flow matrix, the mean values in responders and nonresponder groups were calculated (Figure 3).

Then, based on the dDTF values corresponding to each directed connection, the AUC values were calculated for each independently. Afterward, they were ranked according to their top 30 AUC values (Table 2 and Figure 4).
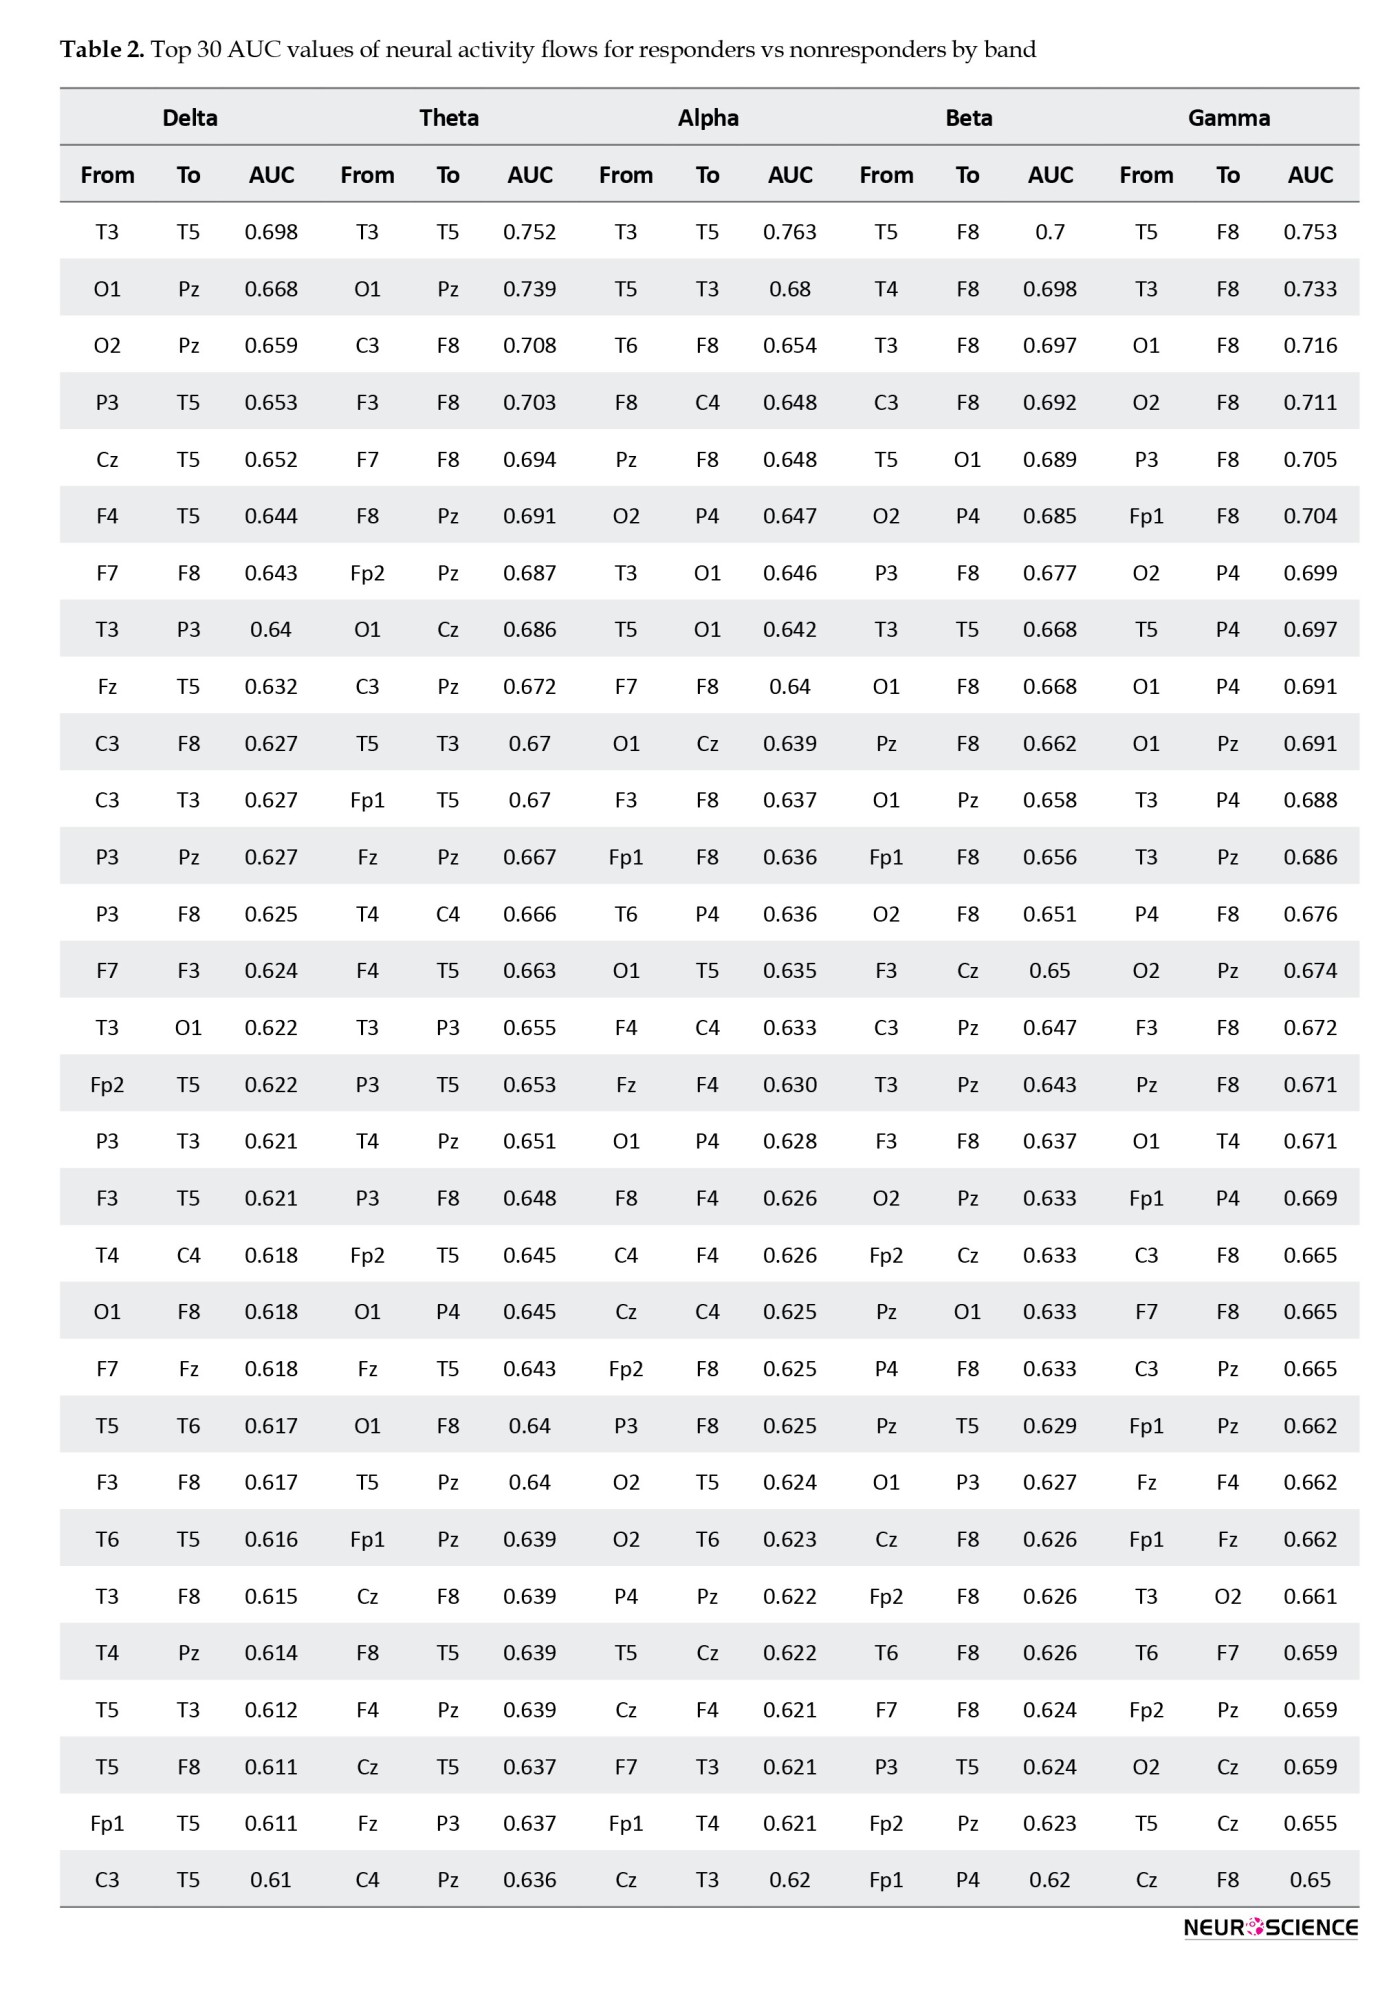
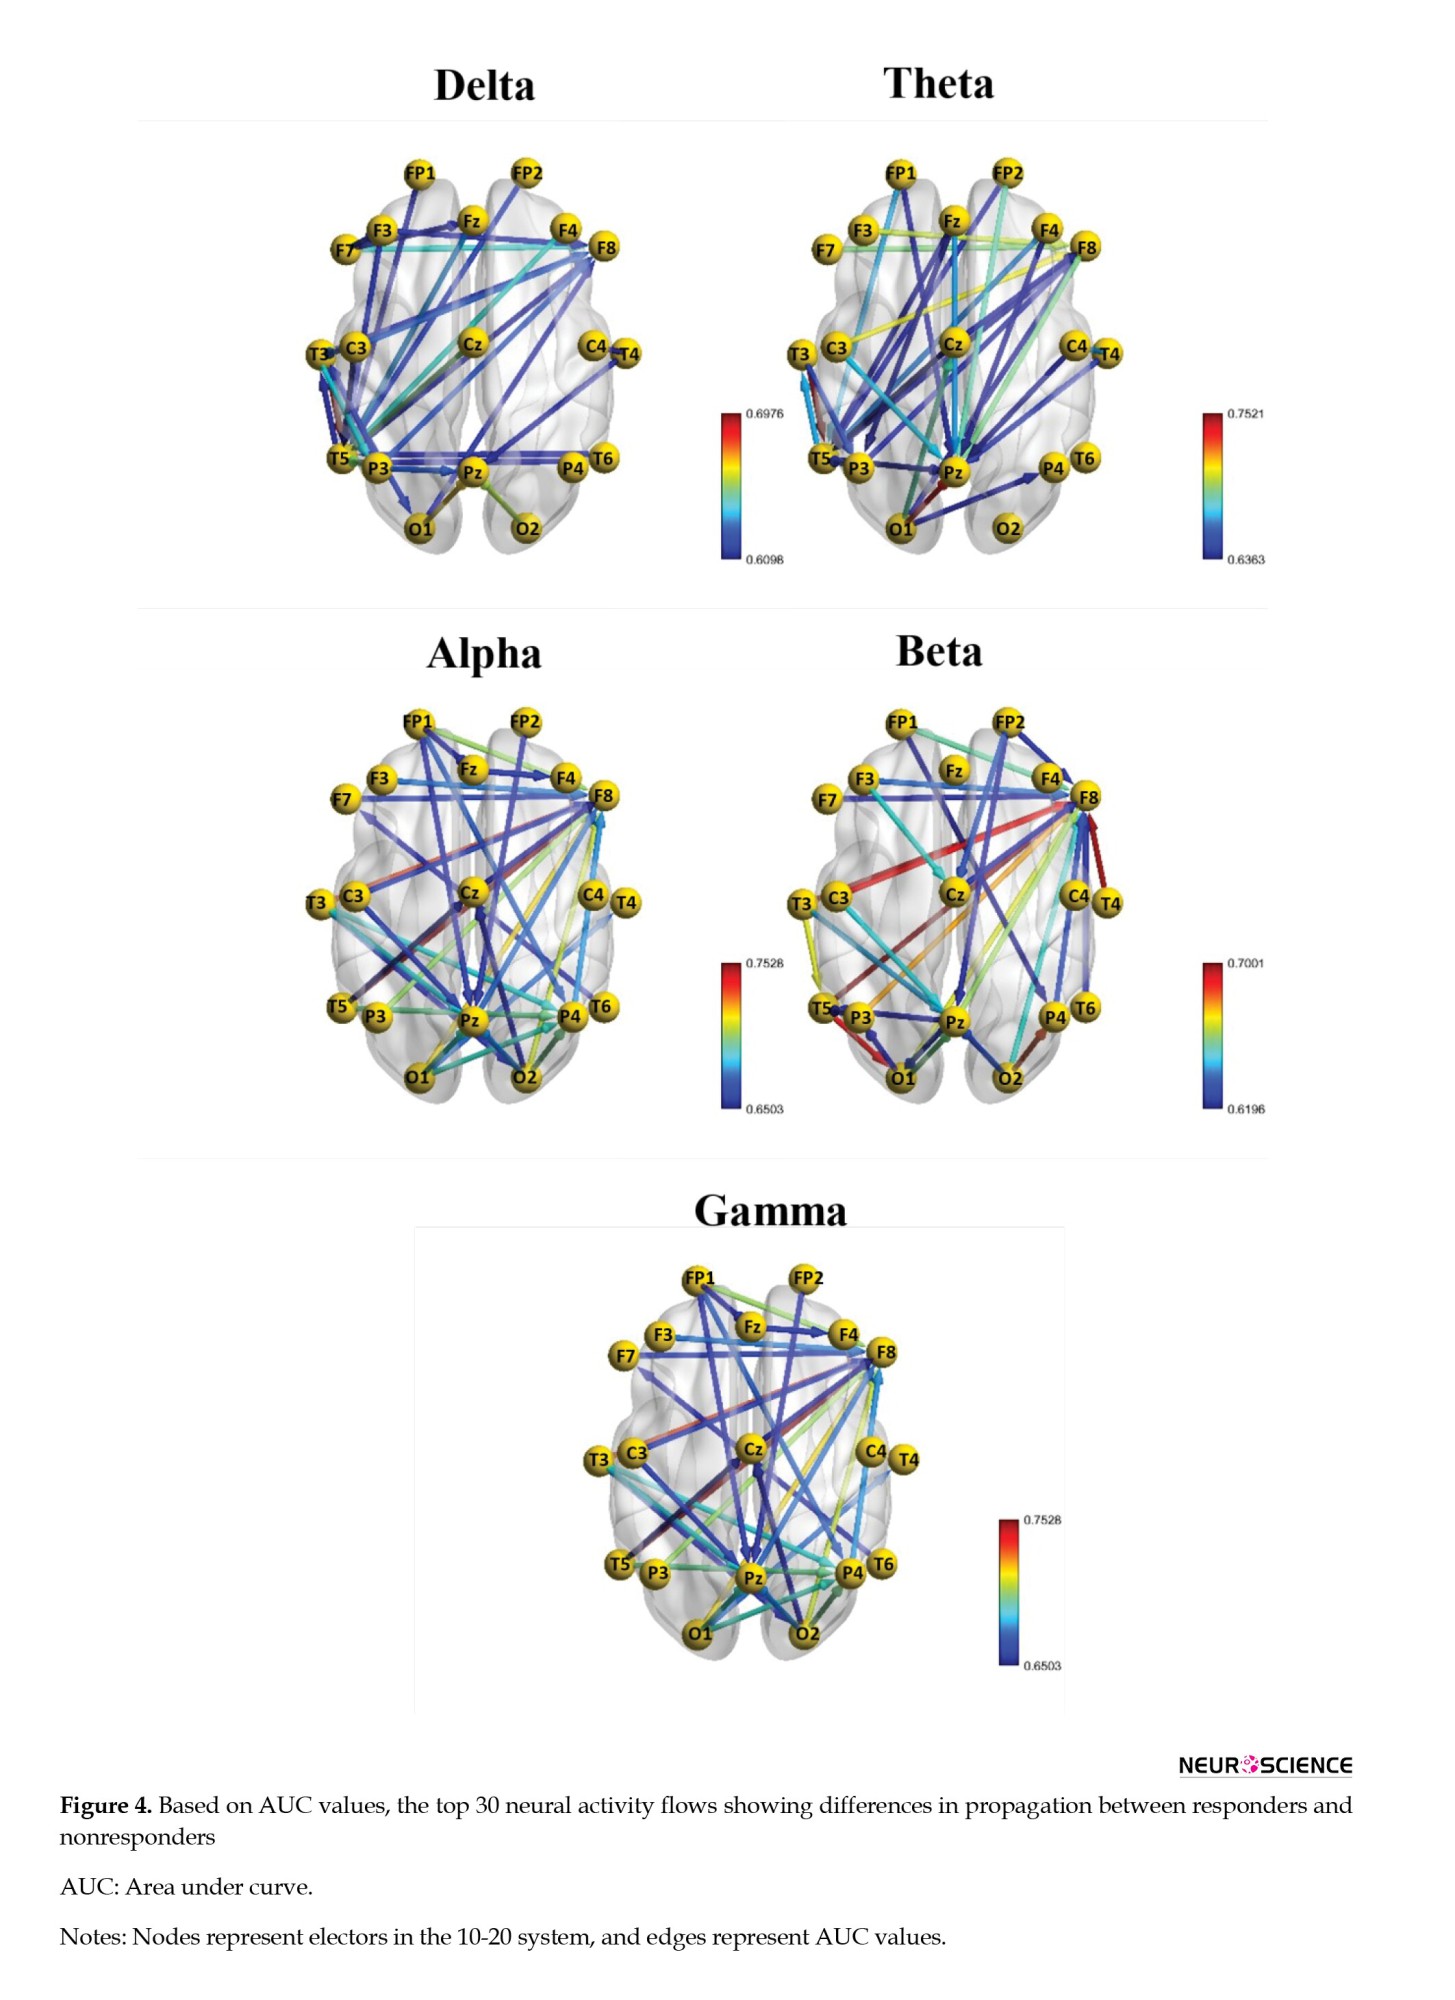
Table 3 summarizes each region in terms of frequency to identify the most critical regions. According to this Table, the frontal lobe has the highest number of neural activity flows, followed by the temporal and parietal lobes.

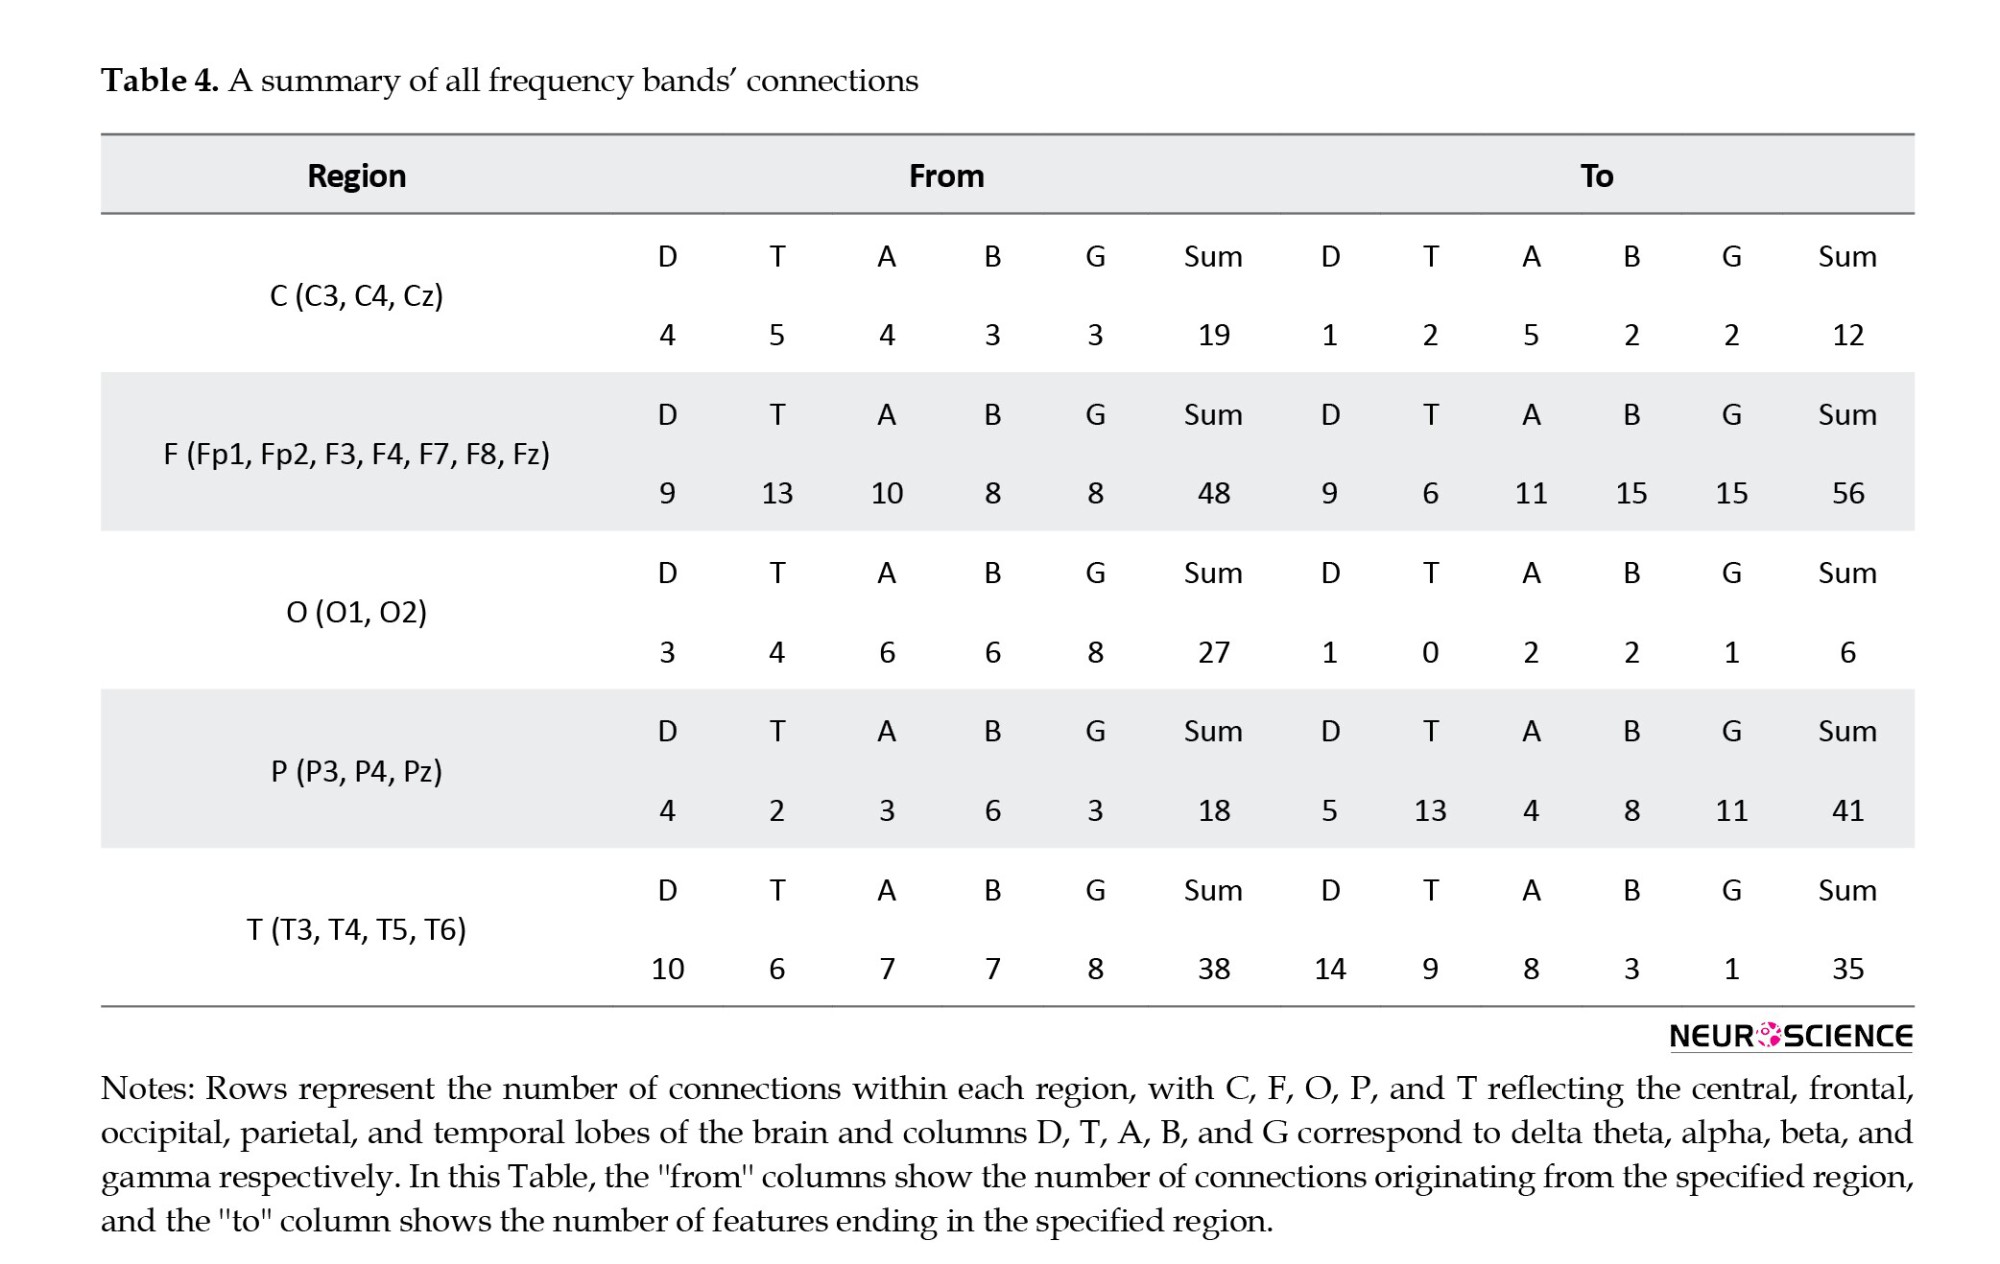
As a result, the frontal and parietal lobes were the dominant regions for most connections. Moreover, an overview of all electrodes from the top 30 bands shows that most connections end in specific regions, particularly in the electrodes F8, Pz, T5, and P4 (Table 4).
Classification responder based on the neural activity flow
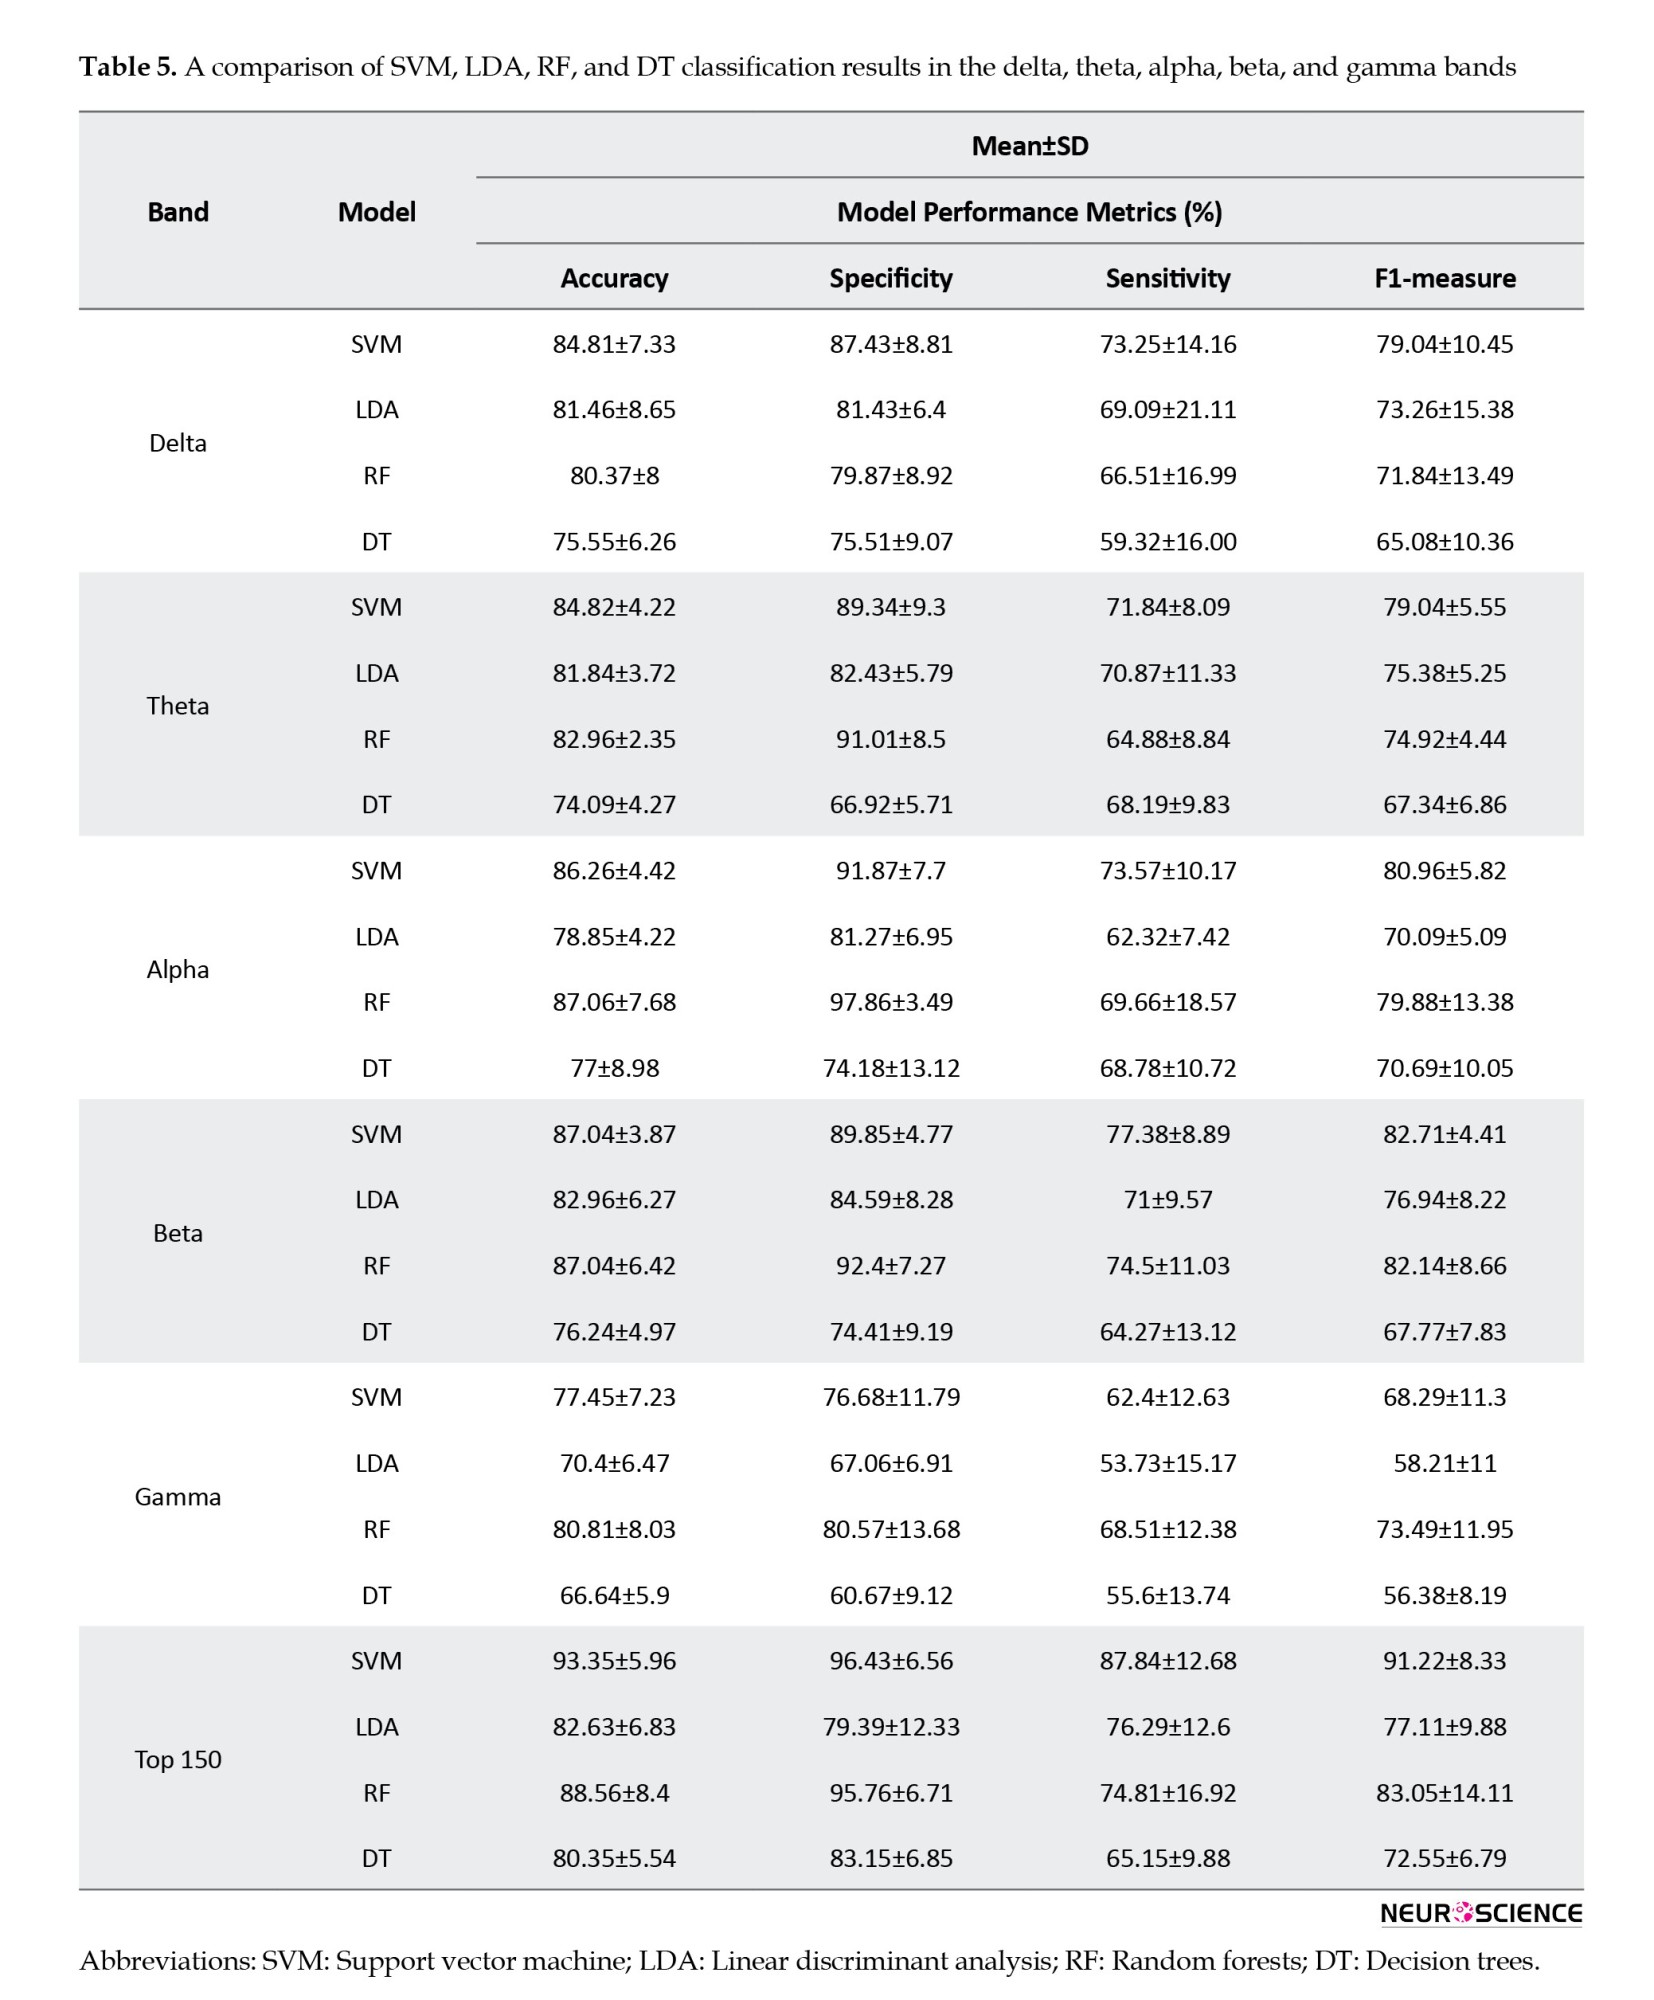
Table 5 presents the classification results of ML models for each frequency band and a combination of features from all bands, consisting of 150 connections (30 connections from each band). The top 150 features had the highest accuracy, specificity, sensitivity, and F1-measure in every model. Following that, the beta and alpha bands yielded the highest results. As seen, most models had a higher specificity than sensitivity, indicating that the models were more capable of correctly identifying patients who would respond to the treatment.
One of the main problems with ML models is the curse of dimensionality, which means that the error becomes larger as the number of features increases. To overcome this problem, different feature selection algorithms have been used, including mRMR, ReliefF, and forward feature selection algorithms. Based on Table 6, forward feature selection achieved the highest accuracy.
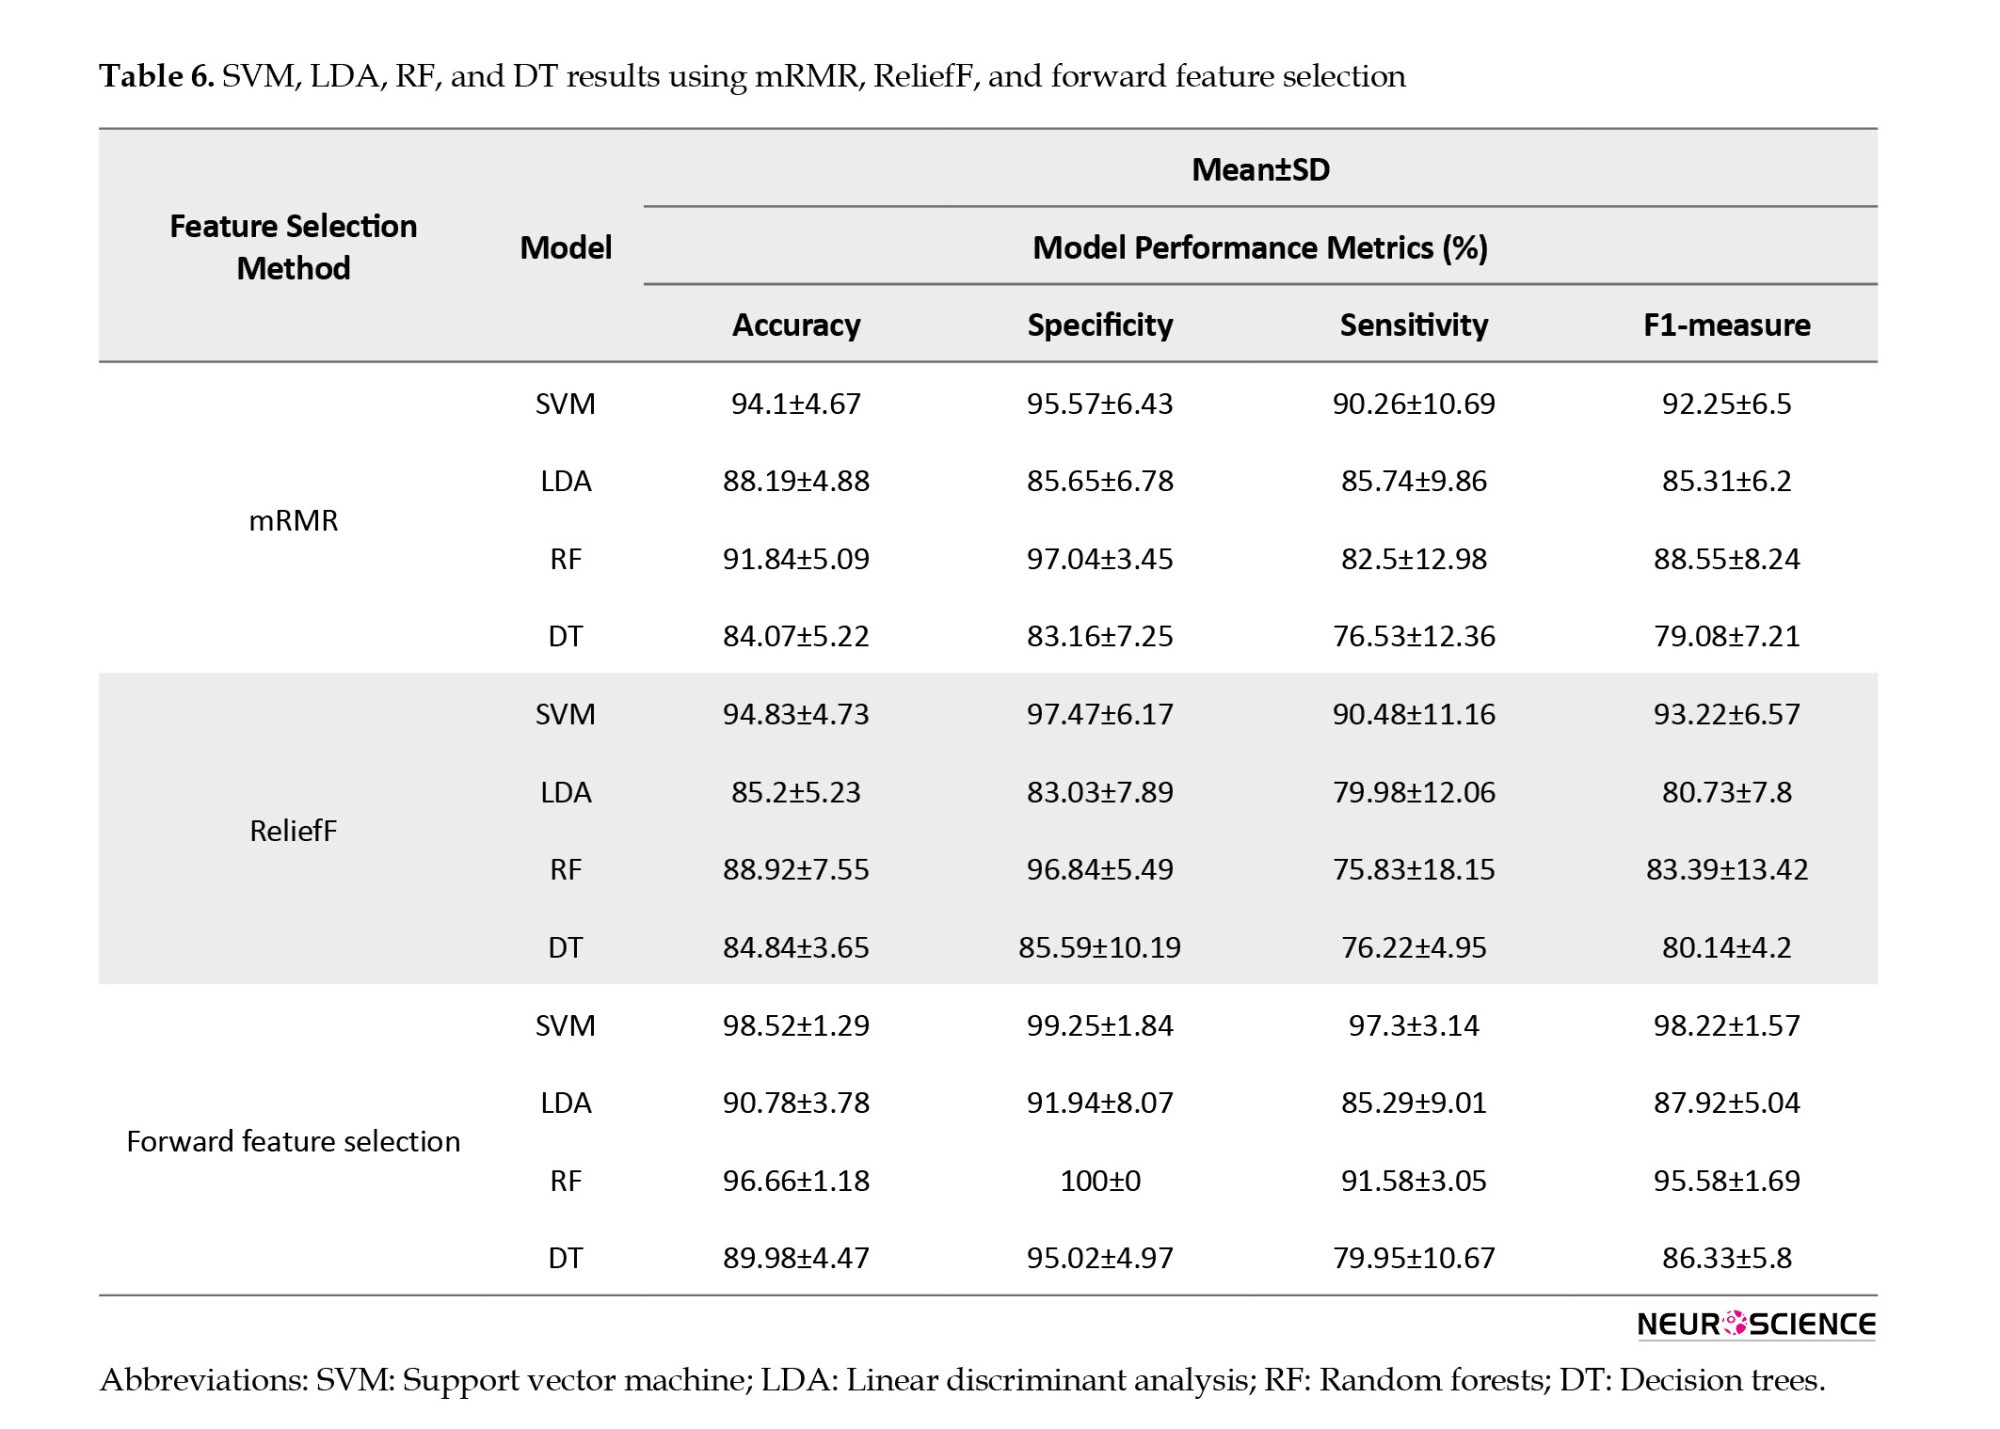
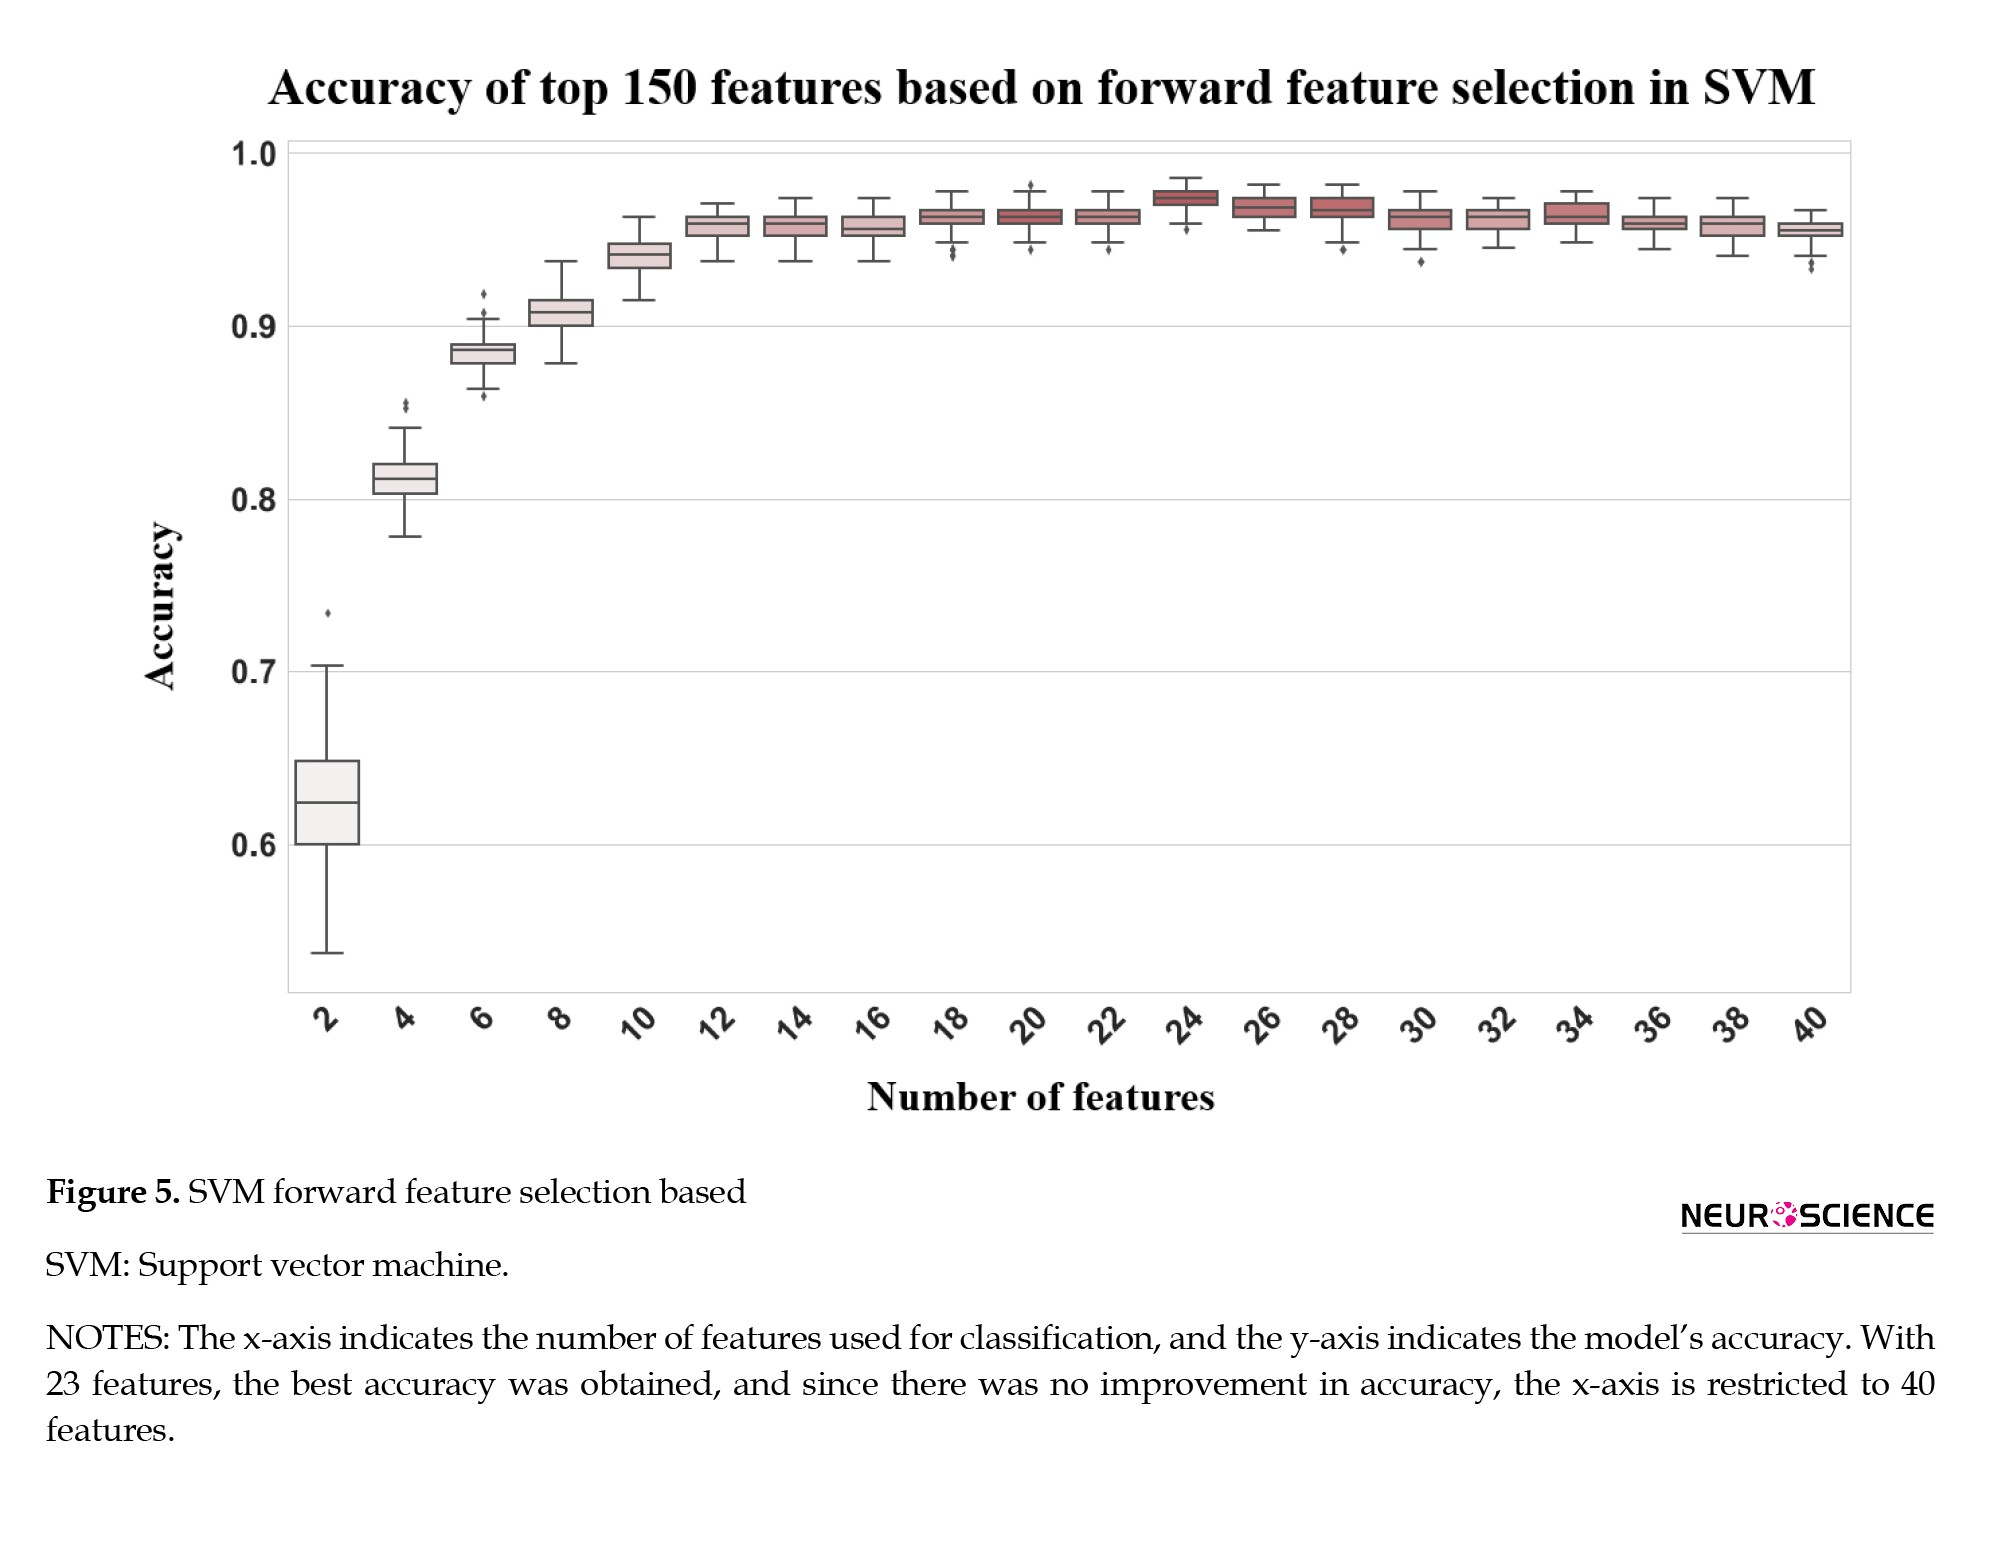
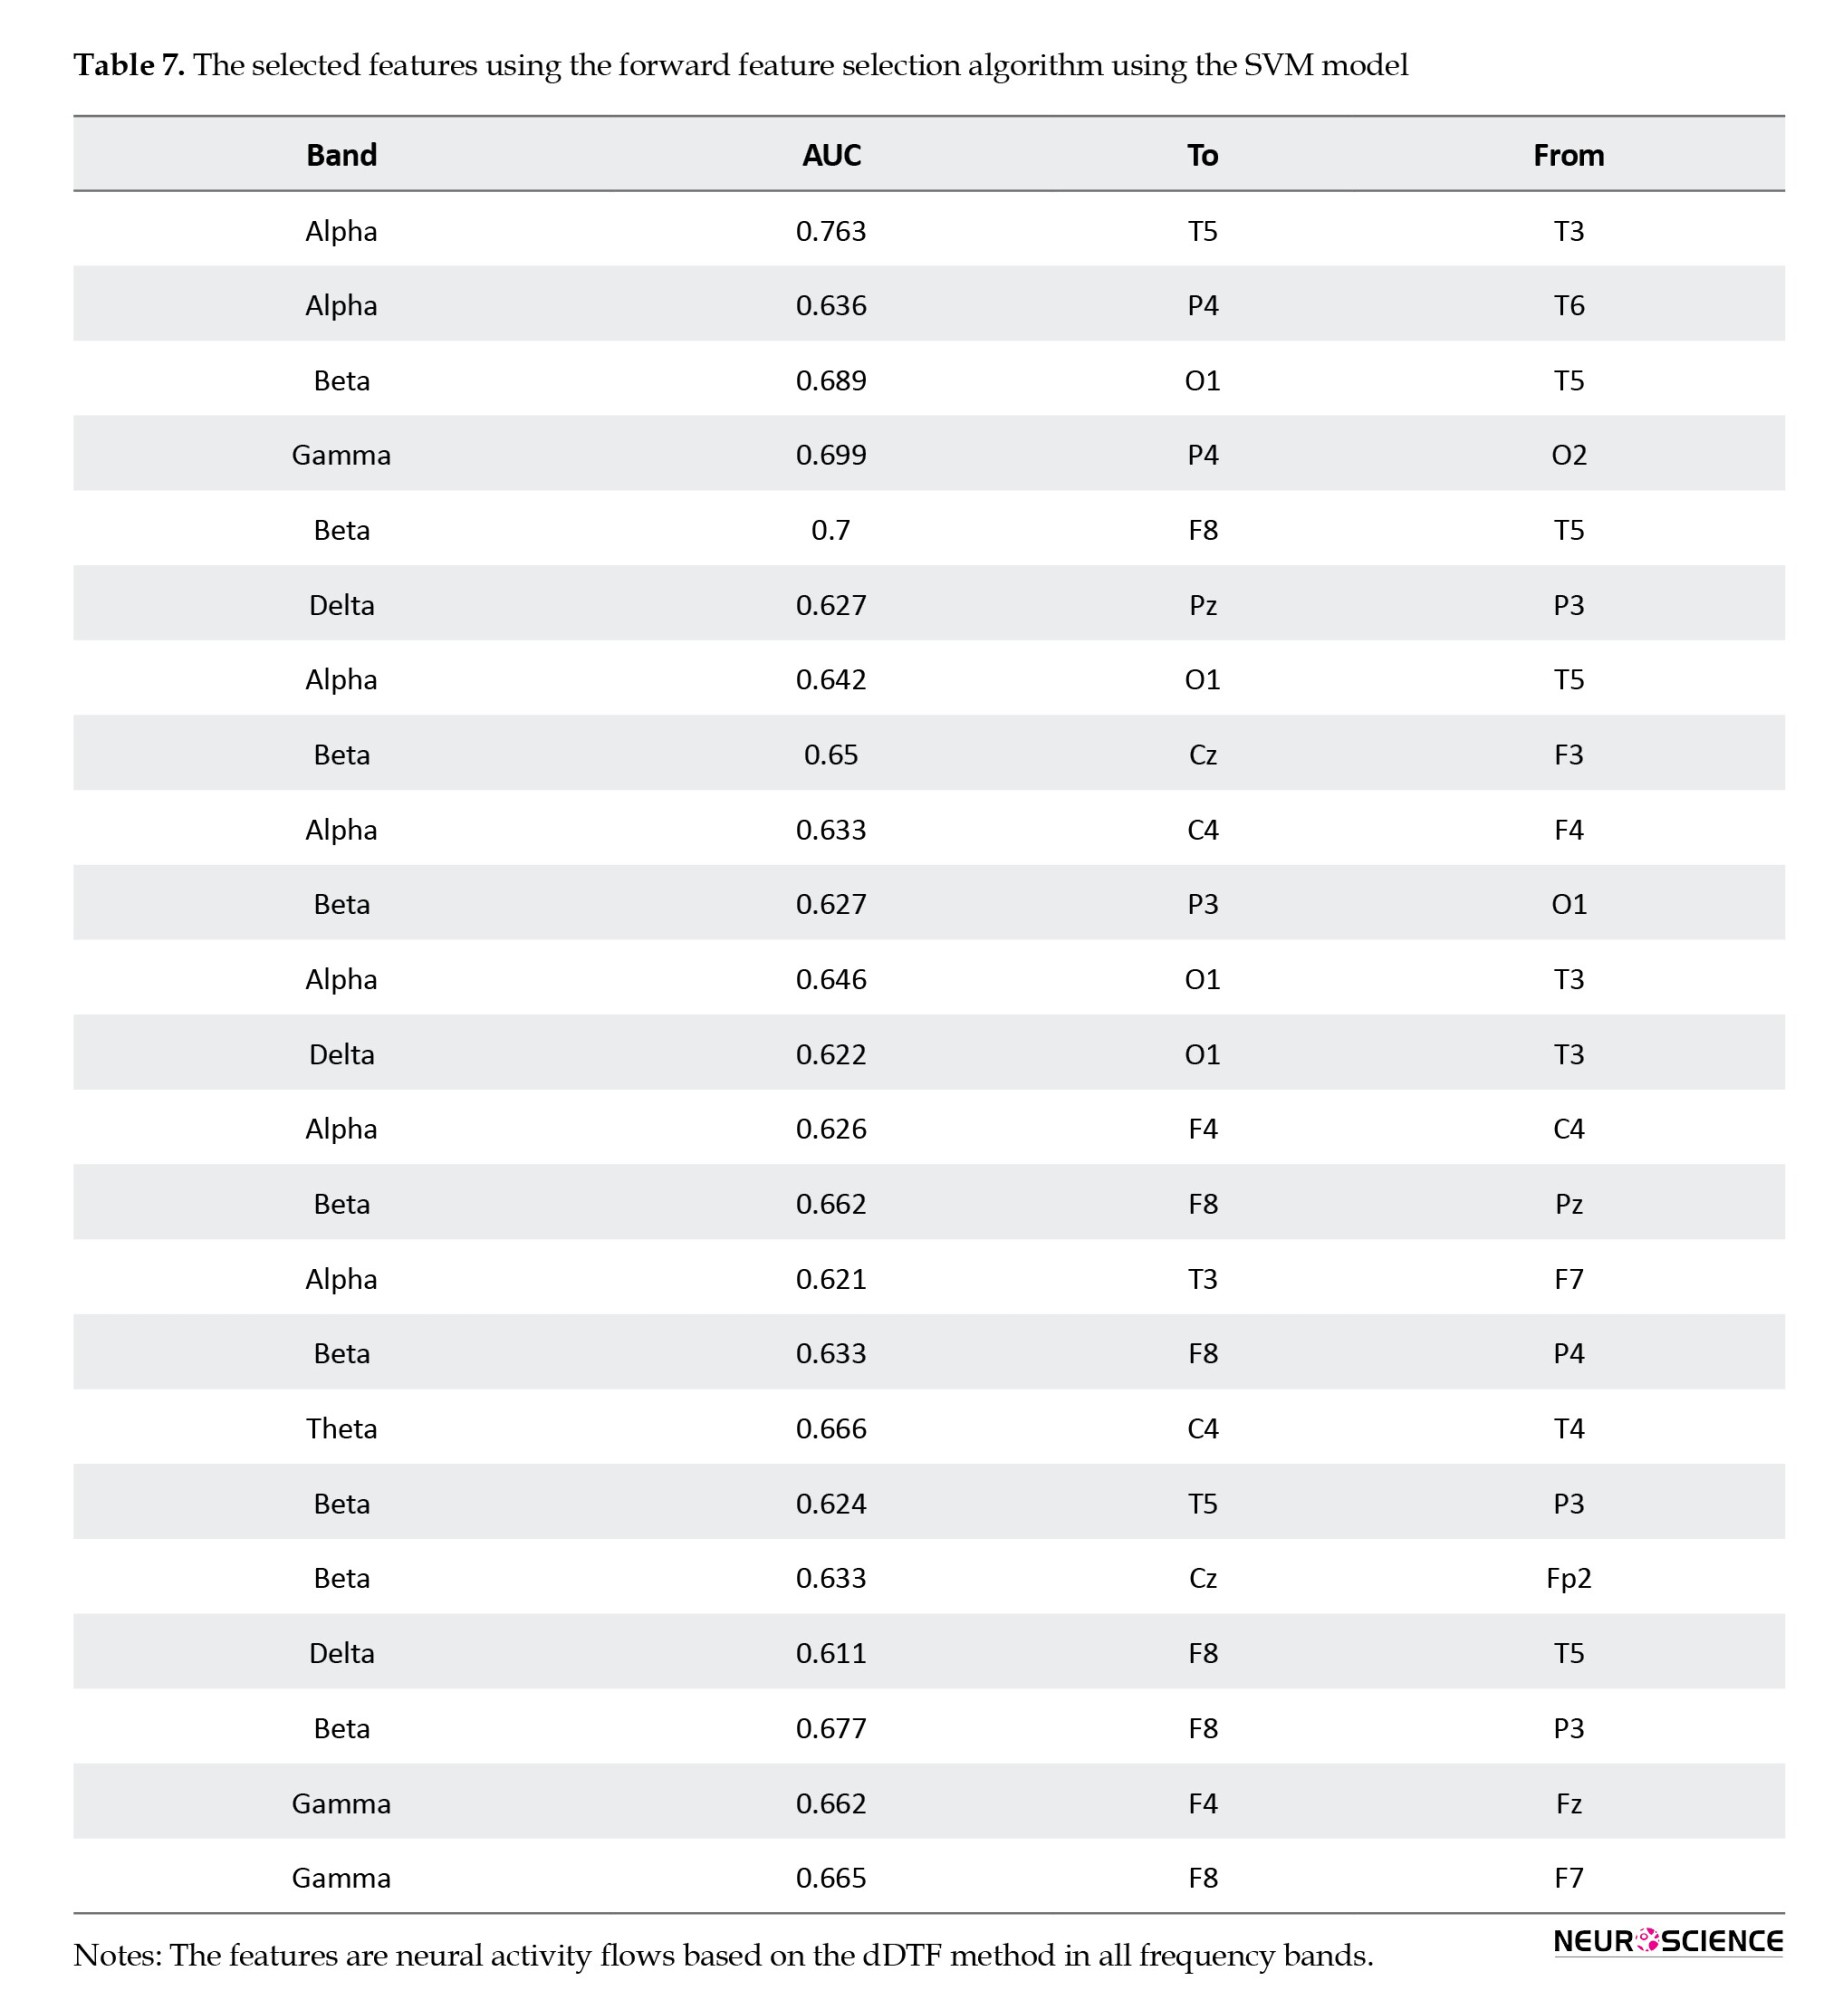
Figure 5 shows how the highest performance can be obtained using only 23 features, and that accuracy decreases afterward, and the selected features are shown in Table 7. Thus, forward feature selection based on the ROC-AUC algorithm improved classification accuracy when using the best subset of features.
4. Discussion
In this study, we demonstrated an ML approach using EEG-derived neural activity flows that accurately predict antidepressant response and provide neuroscientific insights into mechanisms of treatment outcomes. Precisely, we extracted dDTF effective connectivity biomarkers in MDD patients to capture differences between treatment responders and nonresponders across brain regions and frequencies. Our findings indicate that frontoparietal network (FPN) connectivity at alpha and beta bands underlies response failures, aligning with cognitive theories implicating this circuitry. By combining dDTF neural activity flow features with SVM classifiers, our model significantly improved predictive performance over previous state-of-the-art EEG methods, achieving over 98% accuracy. This method establishes functional connectivity as an informative biomarker for guiding antidepressant selection while elucidating network deficits linked to treatment resistance.
Based on the findings in Table 3, F8, Pz, T5, and P4 are the most important regions that differ between respondents and nonresponders. Further, neural activity flows were used to predict treatment outcomes and different feature selection algorithms were applied to improve classification results. As a result, by using forward feature selection across all frequency bands, the best accuracy of 98.52% was achieved by SMV (Table 6). Although SVMs perform better in very high-dimensional spaces and SVM models have generalizability in practice, the risk of overfitting is lower in SVMs. Also, for its parameters, a unique global optimum can be easily determined (Garcia et al., 2003; Subasi & Gursoy, 2010). Additionally, SVM is based on its kernel, and selecting the appropriate kernel function can resolve any complex problem. In this study, the best result was achieved by using the radial basic function. Also, there have recently been some studies that have criticized the reproducibility of AI methods because the evaluation methods may be incorrect, and many of them may suffer from data leakage or overfitting (Gibney, 2022). As discussed, we have used CV to train and evaluate the model on the entire dataset to overcome these problems. By fitting the model in every step and estimating its performance independently in each fold of the CV procedure, we can identify problems such as overfitting or selection bias and learn how the model will generalize to an independent dataset since it gives an almost unbiased performance. Overfitting was also overcome by using different feature selection methods.
Table 3 outlines the starting and ending points of the top 30 activity flows across all frequency bands; only a few areas have the greatest impact on treatment outcomes. First and foremost, the frontal lobe region, especially the F8, is dominant for most neural activity flows. Following that, the parietal (Pz and P4) and temporal (T5) lobes were the dominant regions. Additionally, the findings indicated that this pattern represents a valuable brain biomarker that could be used to assess the treatment response of MDD patients before they begin their treatments, thereby reducing costs and reducing the time spent on patients and medical centers. For example, F8 also has a high classification capability (Hasanzadeh et al., 2021). Also, it may be possible to predict the efficacy of SSRIs by analyzing frontal EEG recordings collected during the first week of treatment (Iosifescu et al., 2009).
Table 7 illustrates the SVM-selected features for obtaining the best accuracy. With only 23 features, 98.5% accuracy has been achieved, and most of the features were selected from beta and alpha bands. Further, beta and alpha bands produced the best results when each frequency was used separately to predict treatment outcomes. Whether we use the neural activity flows of each frequency band separately or combine all features in all frequency bands, the beta and alpha bands are better discriminators for predicting a person’s response to treatment.
A flexible and coordinated modulation of cognitive and emotional processes is enabled by the FPN, composed of lateral prefrontal and posterior parietal cortices (Martens et al., 2021). It has been shown that the FPN is activated during externally focused attention and goal-oriented task performance. A defining characteristic of MDD is the deficiency in concentration, and cognitive theories suggest that impaired top-down regulation of aberrant emotional processing perpetuates a bias toward negative effects (Fischer et al., 2016). It has been shown that depression symptoms are associated with decreased neural activity flows between the FPN and other parts of the brain (Schultz et al., 2018). The study results show that the most significant difference between these groups can be traced to the frontal and parietal lobes (Table 4). Study results supporting our findings suggest that the beta frequency of default mode network-FPN might serve as a neural marker for reoccurring illness (Pizzagalli, 2011; Whitton et al., 2018). Further studies have shown that EEG beta power correlates with cortisol secretion and attentional processing, as seen in Figure 2, where higher beta power is observed in the responding group, mainly in regions related to FPN. Moreover, Baskarana et al. reported that changes in beta asymmetry observed at 2 weeks post-treatment in the responding group may reflect differences in arousal induced by antidepressants (Baskaran et al., 2018). Finally, our findings suggest that treatment failure results from alpha and beta-frequency frontoparietal networks at the network level.
Although this simple approach to dDTF analysis enabled the classification of the treatment responses with 98% accuracy, it might not allow inference about the neural activity flow of particular frequency bands (delta, theta, alpha, beta, gamma, etc.) within the neural system. To ensure a good representation of low-amplitude (higher-frequency) rhythms in MVAR modeling, the analysis should be done step by step by filtering out high-amplitude (low-frequency) rhythm(s) (by high-pass filter with a gentle slope, not steep) and by fitting a separate MVAR model to the filtered signals.
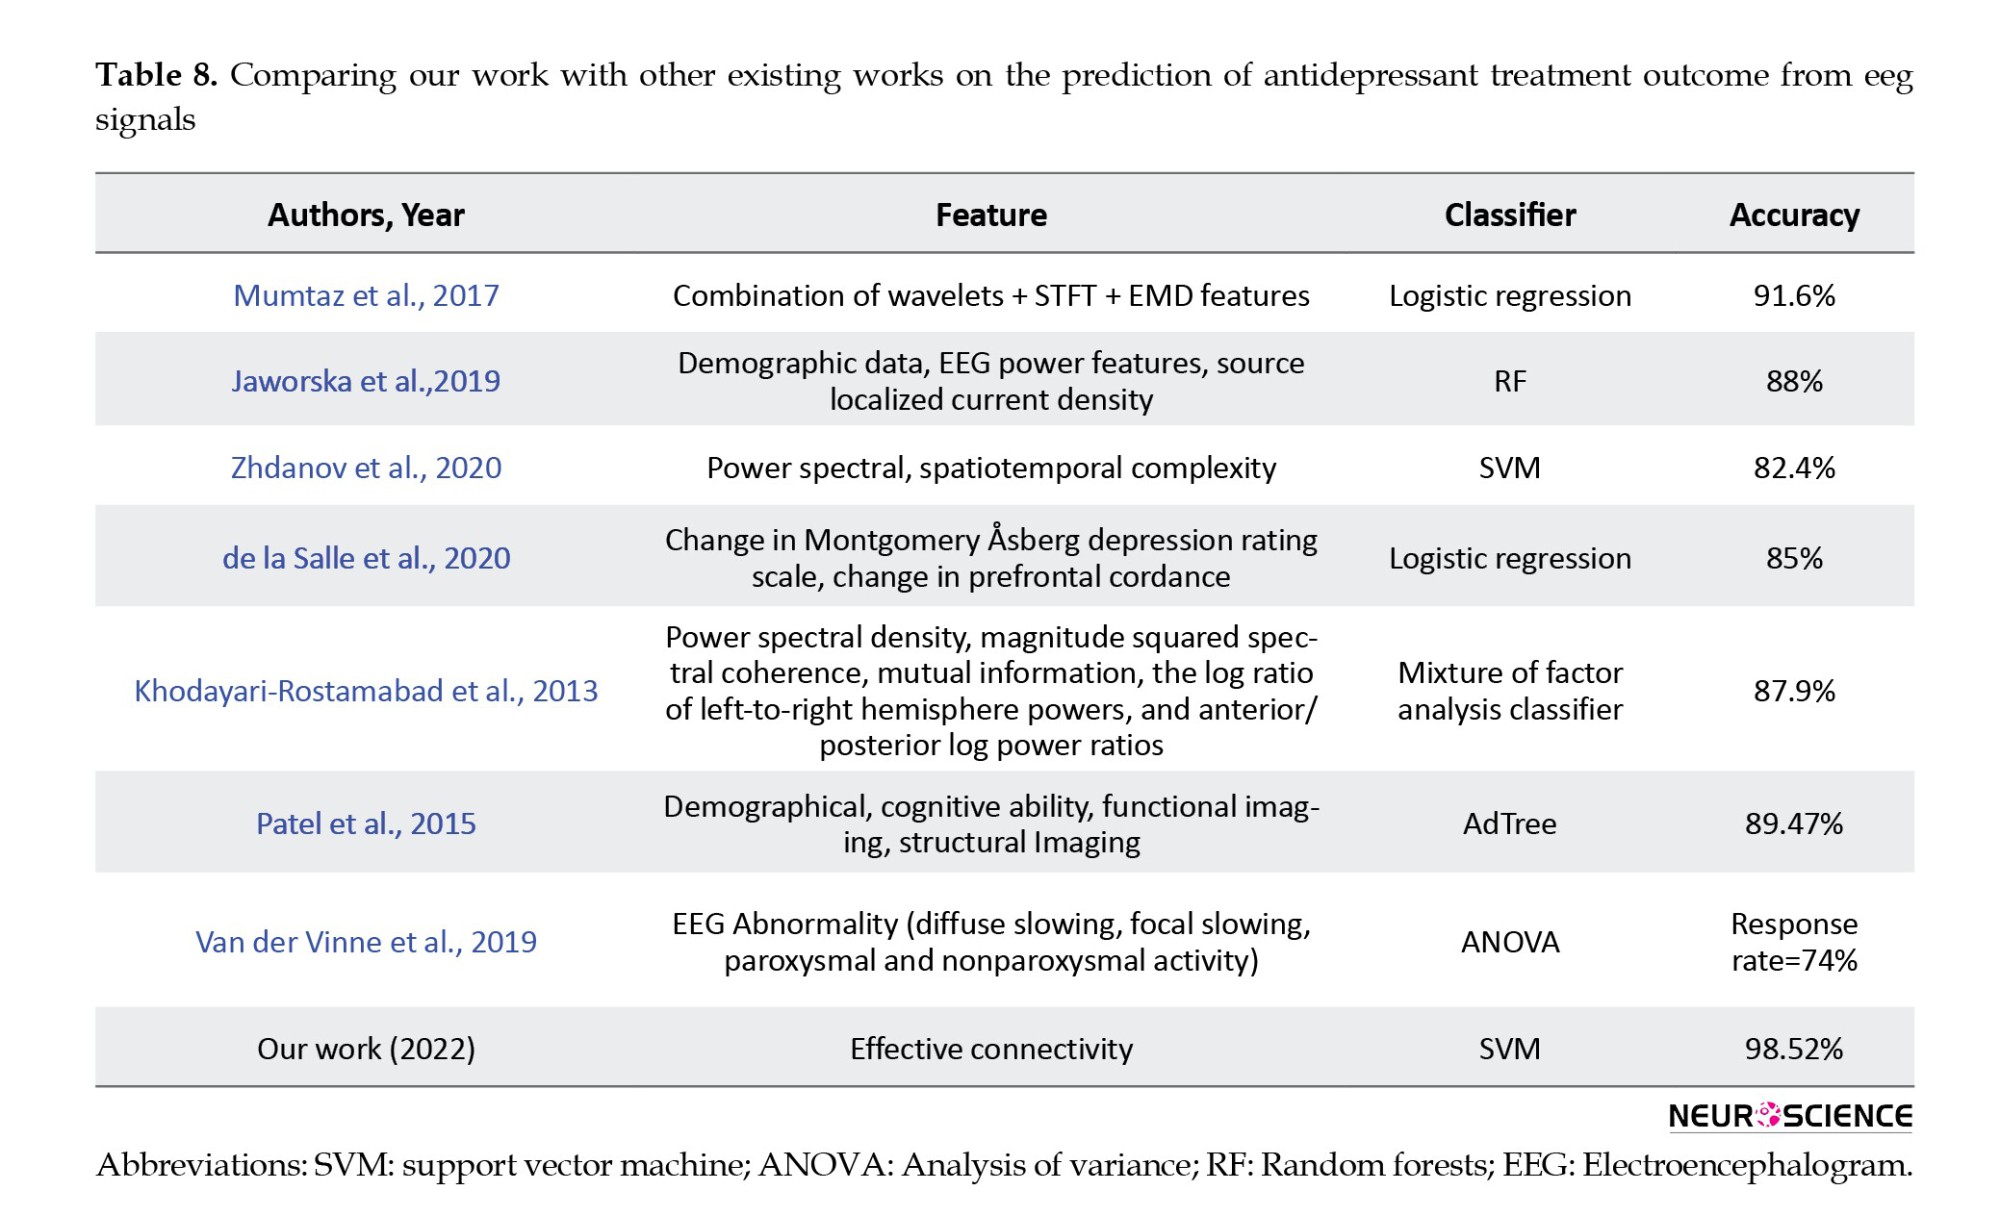
The proposed model achieved higher accuracy than other studies in predicting antidepressant treatment outcomes based on EEG signals by combining neural activity flow and forward feature selection (Table 8). This result indicates that, in addition to showing causality and assisting in understanding the leading cause of treatment outcomes, it can also improve classification results. Also, several limitations should be considered, including the small number of patients from one location that may affect the generalizability of our findings. Moreover, this study used only neural activity flow on channels, but future work may calculate neural activity flow on the brain source localization or combine different types of features. Also, our paper has only used ML models. However, with the advancements in deep learning models, it would be beneficial to use them to improve prediction results.
5. Conclusion
This study investigated a novel method for classifying treatment responses in MDD patients based on neural activity flows. Using neural activity flows, altered brain activity can be identified as causing TRD. Based on the findings of this study, it was demonstrated that the most important neural flows that differ between responders and nonresponders are related to the frontal and parietal lobes at beta frequency, suggesting that the FPN is mainly involved in treatment response. Also, using this kind of neural flow as an input feature in an SVM model and forward feature selection alongside, we could classify responders and nonresponders accurately with an accuracy of 98%. The results of this study suggest that ML models can help predict an individual’s response to antidepressants at the beginning of a treatment program.
Ethical Considerations
Compliance with ethical guidelines
This study was approved by the Human Ethics Committee of Shahid Beheshti University of Medical Sciences, Tehran, Iran (Code:IR.SBMU.MSP.REC.1403.141).
Funding
This research was financially supported by Shahid Beheshti University of Medical Sciences, Tehran, Iran (Grant No.: 43009626).
Authors' contributions
Conceptualization, supervision, funding acquisition and resources: Ahmad shalbaf and Reza Shalbaf; Methodology: Ahmad shalbaf; Data collection: Morteza Mirjebreili and Ahmad shalbaf; Data analysis: Seyed Morteza Mirjebreili and Ahmad shalbaf; Investigation, and writing: All authors.
Conflict of interest
The authors declared no conflict of interest.
Acknowledgments
The authors thank Shahid Beheshti University of Medical Sciences, Tehran, Iran, for financial support.
References
Major depressive disorder (MDD) is the most commonly diagnosed psychiatric disorder worldwide, affecting more than 300 million individuals (Organization, 2017). Symptoms of MDD include changes in mood, interests, pleasure, cognitive functions, and vegetative symptoms. Furthermore, MDD increases the risk of developing conditions such as diabetes mellitus, heart disease, and stroke. MDD has also been associated with suicide, which is approximately the reason for half of the 800000 suicides worldwide (Otte et al., 2016).
In the present day, several antidepressants that act on neurotransmitter receptors are being used to treat depression. Almost all drugs act on two or more neurotransmitter receptors, i.e. two serotonin receptors, two noradrenergic receptors, or both. Also, several treatments are being investigated, including estrogen replacement therapy, mifepristone (RU-486 or C-1073), as well as antagonists, such as corticotropin-releasing factor, neurokinins, and injectable pentapeptides (Sambunaris et al., 1997; Stahl & Grady, 2003). MDD is a highly heterogeneous disorder, meaning that only a few people find antidepressants effective. Several pretreatment variables have been found to moderate the treatment response, including depression severity and neuroticism, older age, less impairment in cognitive control, and employment (Cohen & DeRubeis, 2018; Webb et al., 2019).
In general, 40% of people suffering from MDD have treatment-resistant depression (TRD) since treatment of MDD requires a trial-and-error sequential treatment strategy, and first-line therapies do not meet their needs (Arteaga-Henríquez et al., 2019; Berlim et al., 2008; Leuchter et al., 2009). Often, MDD patients suffer from delayed treatment response, functional impairment, increased suicide risk, and high medical costs due to the inability to predict which treatment will work. Consequently, more effective treatment strategies for patients with MDD are urgently needed (Bremer et al., 2018; Goldman et al., 1999; Schwartz et al., 2021).
Because of advances in neuroimaging techniques, biomarkers from neuroimaging studies are of great value for achieving precision medicine for many psychiatric disorders (Kang & Cho, 2020). In recent years, neuroimaging studies have been published utilizing a variety of methods, including electroencephalogram (EEG), brain volumetric magnetic resonance imaging (MRI), functional magnetic resonance imaging (fMRI), and diffusion tensor imaging to identify biomarkers for treatment response to antidepressants (Kemp et al., 2008). EEGs can be an effective and relatively inexpensive method for studying developmental changes in brain-behavior relationships, and their high temporal resolution makes them particularly useful for examining neural activity flow in the nervous system (Bell & Cuevas, 2012; Smit et al., 2008).
Recently, many studies have focused on EEG to predict how a patient will respond to antidepressant medication (de la Salle et al., 2020; Jaworska et al., 2019; Khodayari-Rostamabad et al., 2013; Shahabi & Shalbaf, 2022). For example, patients who respond to treatment demonstrate improved absolute alpha power at baseline, which can be used as a biomarker to predict treatment response (Baskaran et al., 2018). Also, the interhemispheric neural activity flow in the temporal lobe exhibits 99.61% classification capability using only four EEG channels (Zhang et al., 2022). A study conducted by Mumtaz et al. (2017) involved extracting time-frequency features from different frequency bands of EEG signals and classifying them by using three time-frequency decomposition techniques, including wavelet transforms, short-time Fourier transforms, and empirical modes of decompositions, to predict treatment-outcome for MDD patients. Combining the best features from the decomposition methods described above provides a classification accuracy of 91.6% (Mumtaz et al., 2017). Likewise, Jaworska et al. utilized demographical features with EEG data to improve the classification results (Jaworska et al., 2019). As demonstrated by Salle et al., changes in theta cordance of the prefrontal and midline right frontal in the first week of treatment can provide a predictive indicator of the response to antidepressants (de la Salle et al., 2020). Additionally, Kautzky et al. used a random forest approach to correctly identify 25% of patients with TRD based on clinical variables and three polymorphisms (Kautzky et al., 2015). Moreover, Patel et al. predicted an 89% treatment response using various biometrics, including demographic information and structural and functional imaging features (Patel et al., 2015).
This research significantly contributes to predicting treatment outcomes in MDD through the innovative use of neural activity flow based on the direct directed transfer function (dDTF). Firstly, we demonstrate that neural activity flow features, particularly those derived from the dDTF, can accurately predict antidepressant response in MDD patients. It provides insight into differentiating between individuals who positively respond to selective serotonin reuptake inhibitors (SSRIs) and those who do not. Secondly, our work achieves new state-of-the-art accuracy in EEG-based prediction for MDD treatment by incorporating neural activity flow as a feature in machine learning (ML) models, including support vector machines (SVMs), linear discriminant analysis (LDA), decision trees (DT), and random forests (RF), surpassing existing benchmarks and enhancing the potential clinical applicability of our findings. Lastly, our analysis identifies specific brain regions and networks that indicate treatment failure in MDD, enriching our understanding of the neural underpinnings of treatment outcomes and offering critical insights for developing targeted interventions. In summary, our work presents a novel and comprehensive approach to predicting treatment outcomes in MDD, leveraging neural activity flow and ML models. Our contributions include the accurate prediction of antidepressant response, achieving state-of-the-art accuracy in EEG-based prediction, and identifying specific neural correlates of treatment failure, collectively representing a significant step forward in the field and providing valuable insights and tools for advancing personalized treatment strategies for individuals with MDD.
2. Materials and Methods
Dataset
The EEG signal dataset used in this study was provided by Mumtaz et al. (2017). The data sets included 34 MDD patients and 30 healthy individuals. Among the 34 MDD patients, 17 men and 17 women have a mean age of 40.3±12.9 years. For the eyes closed condition, only 30 EEG segments, of 19 channels each, were available, which were used in this study. MDD patients were diagnosed using the diagnostic and statistical manual of mental disorders, fourth edition (DSM-IV) criteria (GUZE, 1995). An MDD patient was treated for four weeks with SSRI antidepressants. If there is a 50% improvement from pre- to post-treatment, the MDD patient is considered a responder; otherwise, the subject is considered a nonresponder. Based on the Beck depression inventory (BDI), 12 patients responded to treatment, while 18 patients showed no significant improvement (Table 1).
The 10-20 electrode placement system records the EEG for 5 minutes using a 19-electrode EEG cap with linked-ear references. Five different brain regions are represented by electrodes: The frontal lobe containing Fp1, F3, F7, Fz, Fp2, F4, and F8; the parietal lobe containing P3, Pz, and P4; the occipital lobe containing O1 and O2; the left and right temporal lobe containing T3, T4, T5, T6 electrodes; and finally the central lobe with C3, C4, and Cz electrodes.
EEG preprocessing
To prevent erroneous subsequent analysis and ensure that the underlying neuronal activity is accurately reflected in the data, the preprocessing steps have been carried out using the EEGLAB open-source toolbox. To remove baseline drift, a 1-Hz high-pass filter is first applied. Then, the CleanLine open-source plugin is used to remove line noise. Lastly, 3 minutes of data are used for further analysis.
Effective connectivity
The concept of effective connectivity or neural activity flow refers to the influence a node has over another based on a model of neuronal integration, which identifies neuronal coupling mechanisms (Liu et al., 2017). Among the first models used to establish causality between two time series is Granger causality, which was introduced in economics. As explained by Granger causality, a time series of X1 causes a time series X2, if knowledge of X1 helps to make predictions of X2 more accurate (Granger, 1969). A measure of brain activity associated with Granger causality is the DTF. This function represents a linear combination of causal influences along all causal pathways, direct and indirect, beginning at one site and ending at another (Korzeniewska et al., 2008). To distinguish direct from indirect flows, a dDTF is proposed (Korzeniewska et al., 2003). The dDTF method determines the strength and direction of the direct flow of neural activity using DTF combined with partial coherence. To calculate the dDTF, the source information flow toolbox (SIFT) is used (Delorme et al., 2011; Mullen, 2014). Through SIFT, each subject’s EEG data was divided into 18 segments, each lasting 10 seconds. A multivariate autoregressive (MVAR) model of order 20 was then fitted to the data, satisfying two criteria of stability and consistency. This process indicates that the model produces data with the same correlation structure as the actual EEG data and is stable/stationary. This step is crucial in ensuring the accuracy and reliability of subsequent analyses. Then, dDTF values were calculated for each data segment across all frequency ranges, and since we had 19 electrodes, a matrix with the shape of 19*19* frequency was obtained. At the end of the process, the delta (1-4 Hz), theta (4-8 Hz), alpha (8-13 Hz), beta (13-30 Hz), and gamma (30-45 Hz) bands were extracted.
To provide an overview of the dDTF method, the EEG signal is first fitted with an MVAR model. Then, to model a k-channel process, X(t) is modeled as follows (Equation 1):
This equation would lead to the following expression for the MVAR model:
In the above Equation, X(t) represents the data vector in time t, E(t) represents the white noise vector, A(i) represents the model coefficients, and p represents the order of the model. After that, as a result of converting the model Equation into a frequency domain, we obtain:
In the above Equation, X(f) is the input signal, E(f) is white noise, and the H(f) matrix is referred to as the transfer matrix of the system, in which f denotes the frequency of the input signal. The DTF can be defined as follows in accordance with the transfer function of MVAR:
For the dDTF formula, the DTF must be modified with partial coherence as follows:
where S(f) is power spectra, V is the variance of the noise E(f) and Mij is spectral matrix S by removing the ith row and jth column. Finally, dDTF is defined by the given formula:
Feature selection
To select the best features for discriminating between responder and nonresponder groups, one-seventh of the data was set aside for testing, and then LDA was used to calculate the area under a curve (AUC) of every neural activity flow in each band. This study uses the AUC since the area under the receiver operating characteristic curve (AUC-ROC) is equivalent to the Mann–Whitney U statistic (Mason & Graham, 2002). ROC curves were calculated by comparing the model’s false-positive rate against its true-positive rate across a range of thresholds. AUC-ROC value was obtained based on the mean values of all CV sets. The mean AUCs are a valid measure of the model’s performance in a generalized setting in which the model was trained, given that each of the analyzed learners received a unique training set and a unique model-external validation dataset during training. Next, the top 30 connections from each band with the highest AUC are selected; then, the feature selection algorithms are applied.
This paper uses three feature selection methods. The first is based on the area AUC-ROC. In this method, a subset of features is assessed empirically by measuring the prediction accuracy of the feature subset selected by our method. In other words, the forward selection is an iterative process in which we start without any features in the model. We continue to add new features to our model in each iteration, and then we select the subset of features with the highest accuracy out of all the others (Mamitsuka, 2006). Second, the minimum-redundancy maximum-relevance (mRMR) algorithm has been used to rank features to minimize redundancy while maximizing relevance. The mRMR algorithm uses mutual information to compute similarity scores between features and labels of a subset, aiming to minimize the mean mutual information between two features and to maximize the mean mutual information between each feature and the specific label (Amini et al., 2023; Ding & Peng, 2005; Şen et al., 2014). As for the last method, ReliefF is used. Like k-nearest neighbors, ReliefF assigns weights to each feature based on its ability to separate class labels. If the squared Euclidean distance between a feature and its nearest instances of the same class is greater than the distance between the two instances of the other class, the weight of the feature decreases. Based on the Manhattan distance, ReliefF calculates both negative and positive weights for each feature (Al-Nafjan, 2022; Peker et al., 2015).
Classification
In artificial intelligence, supervised learning refers to a subcategory of ML that uses labeled datasets to train algorithms capable of classifying data or predicting outcomes. SVMs are supervised learning algorithms used to classify two data groups. The algorithms draw lines (hyperplanes) to separate groups based on their patterns. An SVM builds a learning model that assigns new examples to one group or another. As a result of these functions, SVMs are called non-probabilistic binary linear classifiers. This paper also uses a random forest composed of many individual decision trees. Trees in the forest generate a class prediction, and the class with the most votes determines the class prediction for our model. In addition, the LDA classifier is used to classify two groups using a linear combination of features.
Statistical analysis
The AUC value was calculated for each neural activity flow to evaluate the importance of each neural activity flow. Afterward, the 30 top connections with the highest value were selected. Also, to evaluate any ML model’s performance, we need to test it on some unseen data. Based on the model’s performance on unseen data, we could say whether our model is under-fitting, over-fitting, or well-generalized. A cross-validation (CV) procedure is used to assess the effectiveness of ML models; it can also be used to evaluate a model if we have insufficient data. For a CV to be performed, some training data must be kept aside for evaluation later. In this paper, the k-fold method was used for CV. During k-fold cross-validation, the original sample is divided into k subsamples of equal size. A single subsample of the k subsamples was retained as the validation data for testing the model, while the remaining k-1 subsamples were used as training data for training the model. In the process of trial and error, it was determined that 7 is the optimal value for k. Further analysis was conducted based on the results of the 7-fold CV.
Overview of the proposed method
Figure 1 illustrates the proposed method. In the first step, raw EEG data were preprocessed using EEG-Lab, an open-source toolbox. A high-pass filter with a 1-Hz frequency and CleanLine noise were applied as part of the preprocessing steps. Afterward, the signals were divided into 18 segments, each lasting 10 seconds. The neural activity flow was calculated from each segment, and a matrix of 19-channels * 19-channels * 45-frequency steps was obtained. Then, the delta, theta, alpha, beta, and gamma bands are extracted by averaging over the frequency ranges of 1-4 Hz, 4-8 Hz, 8-13 Hz, 13-30 Hz, and 30-45 Hz. Following this, AUC-ROC forward feature selection, mRMR, and Relief-F algorithms were used to find the best features from all frequency bands. The selected features trained SVM, LDA, RF, and DT classifiers.
3. Results
Topographic maps
Figure 2 shows topographic maps for MDD patients in the five frequency ranges of delta, theta, alpha, beta, and gamma. It is clear from this figure that the responder group shows lower delta power compared to the nonresponder group, whereas the responders show higher beta power. In the theta band, the most significant difference is observed in the left temporoparietal lobe, whereas in the alpha band, the most significant difference is observed in the central areas. As can be observed in the beta band, respondents generally showed higher power, particularly in the left temporal lobe, which is also observed in gamma.
Regional differences in responders versus nonresponders
After calculating each segment’s neural activity flow matrix, the mean values in responders and nonresponder groups were calculated (Figure 3).
Then, based on the dDTF values corresponding to each directed connection, the AUC values were calculated for each independently. Afterward, they were ranked according to their top 30 AUC values (Table 2 and Figure 4).
Table 3 summarizes each region in terms of frequency to identify the most critical regions. According to this Table, the frontal lobe has the highest number of neural activity flows, followed by the temporal and parietal lobes.
As a result, the frontal and parietal lobes were the dominant regions for most connections. Moreover, an overview of all electrodes from the top 30 bands shows that most connections end in specific regions, particularly in the electrodes F8, Pz, T5, and P4 (Table 4).
Classification responder based on the neural activity flow
Table 5 presents the classification results of ML models for each frequency band and a combination of features from all bands, consisting of 150 connections (30 connections from each band). The top 150 features had the highest accuracy, specificity, sensitivity, and F1-measure in every model. Following that, the beta and alpha bands yielded the highest results. As seen, most models had a higher specificity than sensitivity, indicating that the models were more capable of correctly identifying patients who would respond to the treatment.
One of the main problems with ML models is the curse of dimensionality, which means that the error becomes larger as the number of features increases. To overcome this problem, different feature selection algorithms have been used, including mRMR, ReliefF, and forward feature selection algorithms. Based on Table 6, forward feature selection achieved the highest accuracy.
Figure 5 shows how the highest performance can be obtained using only 23 features, and that accuracy decreases afterward, and the selected features are shown in Table 7. Thus, forward feature selection based on the ROC-AUC algorithm improved classification accuracy when using the best subset of features.
4. Discussion
In this study, we demonstrated an ML approach using EEG-derived neural activity flows that accurately predict antidepressant response and provide neuroscientific insights into mechanisms of treatment outcomes. Precisely, we extracted dDTF effective connectivity biomarkers in MDD patients to capture differences between treatment responders and nonresponders across brain regions and frequencies. Our findings indicate that frontoparietal network (FPN) connectivity at alpha and beta bands underlies response failures, aligning with cognitive theories implicating this circuitry. By combining dDTF neural activity flow features with SVM classifiers, our model significantly improved predictive performance over previous state-of-the-art EEG methods, achieving over 98% accuracy. This method establishes functional connectivity as an informative biomarker for guiding antidepressant selection while elucidating network deficits linked to treatment resistance.
Based on the findings in Table 3, F8, Pz, T5, and P4 are the most important regions that differ between respondents and nonresponders. Further, neural activity flows were used to predict treatment outcomes and different feature selection algorithms were applied to improve classification results. As a result, by using forward feature selection across all frequency bands, the best accuracy of 98.52% was achieved by SMV (Table 6). Although SVMs perform better in very high-dimensional spaces and SVM models have generalizability in practice, the risk of overfitting is lower in SVMs. Also, for its parameters, a unique global optimum can be easily determined (Garcia et al., 2003; Subasi & Gursoy, 2010). Additionally, SVM is based on its kernel, and selecting the appropriate kernel function can resolve any complex problem. In this study, the best result was achieved by using the radial basic function. Also, there have recently been some studies that have criticized the reproducibility of AI methods because the evaluation methods may be incorrect, and many of them may suffer from data leakage or overfitting (Gibney, 2022). As discussed, we have used CV to train and evaluate the model on the entire dataset to overcome these problems. By fitting the model in every step and estimating its performance independently in each fold of the CV procedure, we can identify problems such as overfitting or selection bias and learn how the model will generalize to an independent dataset since it gives an almost unbiased performance. Overfitting was also overcome by using different feature selection methods.
Table 3 outlines the starting and ending points of the top 30 activity flows across all frequency bands; only a few areas have the greatest impact on treatment outcomes. First and foremost, the frontal lobe region, especially the F8, is dominant for most neural activity flows. Following that, the parietal (Pz and P4) and temporal (T5) lobes were the dominant regions. Additionally, the findings indicated that this pattern represents a valuable brain biomarker that could be used to assess the treatment response of MDD patients before they begin their treatments, thereby reducing costs and reducing the time spent on patients and medical centers. For example, F8 also has a high classification capability (Hasanzadeh et al., 2021). Also, it may be possible to predict the efficacy of SSRIs by analyzing frontal EEG recordings collected during the first week of treatment (Iosifescu et al., 2009).
Table 7 illustrates the SVM-selected features for obtaining the best accuracy. With only 23 features, 98.5% accuracy has been achieved, and most of the features were selected from beta and alpha bands. Further, beta and alpha bands produced the best results when each frequency was used separately to predict treatment outcomes. Whether we use the neural activity flows of each frequency band separately or combine all features in all frequency bands, the beta and alpha bands are better discriminators for predicting a person’s response to treatment.
A flexible and coordinated modulation of cognitive and emotional processes is enabled by the FPN, composed of lateral prefrontal and posterior parietal cortices (Martens et al., 2021). It has been shown that the FPN is activated during externally focused attention and goal-oriented task performance. A defining characteristic of MDD is the deficiency in concentration, and cognitive theories suggest that impaired top-down regulation of aberrant emotional processing perpetuates a bias toward negative effects (Fischer et al., 2016). It has been shown that depression symptoms are associated with decreased neural activity flows between the FPN and other parts of the brain (Schultz et al., 2018). The study results show that the most significant difference between these groups can be traced to the frontal and parietal lobes (Table 4). Study results supporting our findings suggest that the beta frequency of default mode network-FPN might serve as a neural marker for reoccurring illness (Pizzagalli, 2011; Whitton et al., 2018). Further studies have shown that EEG beta power correlates with cortisol secretion and attentional processing, as seen in Figure 2, where higher beta power is observed in the responding group, mainly in regions related to FPN. Moreover, Baskarana et al. reported that changes in beta asymmetry observed at 2 weeks post-treatment in the responding group may reflect differences in arousal induced by antidepressants (Baskaran et al., 2018). Finally, our findings suggest that treatment failure results from alpha and beta-frequency frontoparietal networks at the network level.
Although this simple approach to dDTF analysis enabled the classification of the treatment responses with 98% accuracy, it might not allow inference about the neural activity flow of particular frequency bands (delta, theta, alpha, beta, gamma, etc.) within the neural system. To ensure a good representation of low-amplitude (higher-frequency) rhythms in MVAR modeling, the analysis should be done step by step by filtering out high-amplitude (low-frequency) rhythm(s) (by high-pass filter with a gentle slope, not steep) and by fitting a separate MVAR model to the filtered signals.
The proposed model achieved higher accuracy than other studies in predicting antidepressant treatment outcomes based on EEG signals by combining neural activity flow and forward feature selection (Table 8). This result indicates that, in addition to showing causality and assisting in understanding the leading cause of treatment outcomes, it can also improve classification results. Also, several limitations should be considered, including the small number of patients from one location that may affect the generalizability of our findings. Moreover, this study used only neural activity flow on channels, but future work may calculate neural activity flow on the brain source localization or combine different types of features. Also, our paper has only used ML models. However, with the advancements in deep learning models, it would be beneficial to use them to improve prediction results.
5. Conclusion
This study investigated a novel method for classifying treatment responses in MDD patients based on neural activity flows. Using neural activity flows, altered brain activity can be identified as causing TRD. Based on the findings of this study, it was demonstrated that the most important neural flows that differ between responders and nonresponders are related to the frontal and parietal lobes at beta frequency, suggesting that the FPN is mainly involved in treatment response. Also, using this kind of neural flow as an input feature in an SVM model and forward feature selection alongside, we could classify responders and nonresponders accurately with an accuracy of 98%. The results of this study suggest that ML models can help predict an individual’s response to antidepressants at the beginning of a treatment program.
Ethical Considerations
Compliance with ethical guidelines
This study was approved by the Human Ethics Committee of Shahid Beheshti University of Medical Sciences, Tehran, Iran (Code:IR.SBMU.MSP.REC.1403.141).
Funding
This research was financially supported by Shahid Beheshti University of Medical Sciences, Tehran, Iran (Grant No.: 43009626).
Authors' contributions
Conceptualization, supervision, funding acquisition and resources: Ahmad shalbaf and Reza Shalbaf; Methodology: Ahmad shalbaf; Data collection: Morteza Mirjebreili and Ahmad shalbaf; Data analysis: Seyed Morteza Mirjebreili and Ahmad shalbaf; Investigation, and writing: All authors.
Conflict of interest
The authors declared no conflict of interest.
Acknowledgments
The authors thank Shahid Beheshti University of Medical Sciences, Tehran, Iran, for financial support.
References
Al-Nafjan, A. (2022). Feature selection of EEG signals in neuromarketing. PeerJ Computer Science, 8, e944. [DOI:10.7717/PEERJ-CS.944] [PMID]
Amini, N., Mahdavi, M., Choubdar, H., Abedini, A., Shalbaf, A., & Lashgari, R. (2023). Automated prediction of COVID-19 mortality outcome using clinical and laboratory data based on hierarchical feature selection and random forest classifier. Computer Methods in Biomechanics and Biomedical Engineering, 26(2), 160-173. [DOI:10.1080/10255842.2022.2050906] [PMID]
Arteaga-Henríquez, G., Simon, M. S., Burger, B., Weidinger, E., Wijkhuijs, A., & Arolt, V., et al. (2019). Low-grade inflammation as a predictor of antidepressant and anti-inflammatory therapy response in MDD patients: A systematic review of the literature in combination with an analysis of experimental data collected in the EU-MOODINFLAME Consortium. Frontiers in Psychiatry, 10, 458. [DOI:10.3389/fpsyt.2019.00458] [PMID]
Baskaran, A., Farzan, F., Milev, R., Brenner, C. A., Alturi, S., & Pat McAndrews, M., et al. (2018). The comparative effectiveness of electroencephalographic indices in predicting response to escitalopram therapy in depression: A pilot study. Journal of Affective Disorders, 227, 542-549. [DOI:10.1016/J.JAD.2017.10.028] [PMID]
Bell, M. A., & Cuevas, K. (2012). Using EEG to study cognitive development: Issues and practices. Journal of Cognition and Development, 13(3), 281-294. [DOI:10.1080/15248372.2012.691143] [PMID]
Berlim, M. T., Fleck, M. P., & Turecki, G. (2008). Current trends in the assessment and somatic treatment of resistant/refractory major depression: An overview. Annals of Medicine, 40(2), 149-159. [DOI:10.1080/07853890701769728] [PMID]
Bremer, V., Becker, D., Kolovos, S., Funk, B., van Breda, W., & Hoogendoorn, M., et al. (2018). Predicting therapy success and costs for personalized treatment recommendations using baseline characteristics: Data-driven analysis. Journal of Medical Internet Research, 20(8), e10275. [DOI:10.2196/10275] [PMID]
Cohen, Z. D., & DeRubeis, R. J. (2018). Treatment selection in depression. Annual Review of Clinical Psychology, 14, 209–236. [DOI:10.1146/annurev-clinpsy-050817-084746] [PMID]
de la Salle, S., Jaworska, N., Blier, P., Smith, D., & Knott, V. (2020). Using prefrontal and midline right frontal EEG-derived theta cordance and depressive symptoms to predict the differential response or remission to antidepressant treatment in major depressive disorder. Psychiatry Research. Neuroimaging, 302, 111109. [DOI:10.1016/J.PSCYCHRESNS.2020.111109] [PMID]
Delorme, A., Mullen, T., Kothe, C., Akalin Acar, Z., Bigdely-Shamlo, N., & Vankov, A., et al. (2011). EEGLAB, SIFT, NFT, BCILAB, and ERICA: New tools for advanced EEG processing. Computational Intelligence and Neuroscience, 2011, 130714.[DOI:10.1155/2011/130714] [PMID]
Ding, C., & Peng, H. (2005). Minimum redundancy feature selection from microarray gene expression data. Journal of Bioinformatics and Computational Biology, 3(2), 185-205. [DOI:10.1142/S0219720005001004] [PMID]
Fischer, A. S., Keller, C. J., & Etkin, A. (2016). The clinical applicability of functional connectivity in depression: Pathways toward more targeted intervention. Biological Psychiatry. Cognitive Neuroscience and Neuroimaging, 1(3), 262–270.[DOI:10.1016/j.bpsc.2016.02.004] [PMID]
Garcia, G. N., Ebrahimi, T., & Vesin, J. M. (2003). Support vector EEG classification in the Fourier and time-frequency correlation domains. Paper presented at: First International IEEE EMBS Conference on Neural Engineering, 2003. Conference Proceedings, Capri, Italy, 20-22 March 2003. [DOI:10.1109/CNE.2003.1196897]
Gibney, E. (2022). Could machine learning fuel a reproducibility crisis in science? Nature, 608(7922), 250–251. [DOI:10.1038/d41586-022-02035-w] [PMID]
Goldman, L. S., Nielsen, N. H., & Champion, H. C. (1999). Awareness, diagnosis, and treatment of depression. Journal of General Internal Medicine, 14(9), 569-580. [DOI:10.1046/j.1525-1497.1999.03478.x] [PMID]
Granger, C. W. J. (1969). Investigating causal relations by econometric models and cross-spectral methods. Econometrica, 37(3), 424-438. [DOI:10.2307/1912791]
Guze, S. B. (1995). Diagnostic and statistical manual of mental disorders, 4th ed. (DSM-IV). American Journal of Psychiatry, 152(8), 1228-1228. [DOI:10.1176/ajp.152.8.1228]
Hasanzadeh, F., Mohebbi, M., & Rostami, R. (2021). Single channel EEG classification: A case study on prediction of major depressive disorder treatment outcome. IEEE Access, 9, 3417-3427. [DOI:10.1109/ACCESS.2020.3046993]
Iosifescu, D. V., Greenwald, S., Devlin, P., Mischoulon, D., Denninger, J. W., & Alpert, J. E., et al. (2009). Frontal EEG predictors of treatment outcome in major depressive disorder. European Neuropsychopharmacology, 19(11), 772-777. [DOI:10.1016/j.euroneuro.2009.06.001] [PMID]
Jaworska, N., de la Salle, S., Ibrahim, M. H., Blier, P., & Knott, V. (2019). Leveraging machine learning approaches for predicting antidepressant treatment response using electroencephalography (EEG) and clinical data. Frontiers in Psychiatry, 9, 768. [DOI:10.3389/FPSYT.2018.00768] [PMID]
Kang, S. G., & Cho, S. E. (2020). Neuroimaging biomarkers for predicting treatment response and recurrence of major depressive disorder. International Journal of Molecular Sciences, 21(6), 2148. [DOI:10.3390/ijms21062148] [PMID]
Kautzky, A., Baldinger, P., Souery, D., Montgomery, S., Mendlewicz, J., & Zohar, J., et al. (2015). The combined effect of genetic polymorphisms and clinical parameters on treatment outcome in treatment-resistant depression. European Neuropsychopharmacology, 25(4), 441-453. [DOI:10.1016/J.EURONEURO.2015.01.001] [PMID]
Kemp, A. H., Gordon, E., Rush, A. J., & Williams, L. M. (2008). Improving the prediction of treatment response in depression: Integration of clinical, cognitive, psychophysiological, neuroimaging, and genetic measures. CNS spectrums, 13(12), 1066–1088. [DOI:10.1017/S1092852900017120] [PMID]
Khodayari-Rostamabad, A., Reilly, J. P., Hasey, G. M., de Bruin, H., & Maccrimmon, D. J. (2013). A machine learning approach using EEG data to predict response to SSRI treatment for major depressive disorder. Clinical Neurophysiology, 124(10), 1975-1985. [DOI:10.1016/j.clinph.2013.04.010] [PMID]
Korzeniewska, A., Crainiceanu, C. M., Kuś, R., Franaszczuk, P. J., & Crone, N. E. (2008). Dynamics of event-related causality in brain electrical activity. Human Brain Mapping, 29(10), 1170–1192. [DOI:10.1002/hbm.20458] [PMID]
Korzeniewska, A., Mańczak, M., Kamiński, M., Blinowska, K. J., & Kasicki, S. (2003). Determination of information flow direction among brain structures by a modified directed transfer function (dDTF) method. Journal of Neuroscience Methods, 125(1-2), 195-207. [DOI:10.1016/S0165-0270(03)00052-9] [PMID]
Leuchter, A. F., Cook, I. A., Hunter, A. M., & Korb, A. S. (2009). A new paradigm for the prediction of antidepressant treatment response. Dialogues in Clinical Neuroscience, 11(4), 435–446. [DOI:10.31887/DCNS.2009.11.4/afleuchter] [PMID]
Liu, Z., Zhang, M., Xu, G., Huo, C., Tan, Q., & Li, Z., et al. (2017). Effective connectivity analysis of the brain network in drivers during actual driving using near-infrared spectroscopy. Frontiers in Behavioral Neuroscience, 11, 211. [DOI:10.3389/fnbeh.2017.00211] [PMID]
Mamitsuka, H. (2006). Selecting features in microarray classification using ROC curves. Pattern Recognition, 39(12), 2393-2404. [DOI:10.1016/J.PATCOG.2006.07.010]
Martens, M. A. G., Filippini, N., Harmer, C. J., & Godlewska, B. R. (2022). Resting state functional connectivity patterns as biomarkers of treatment response to escitalopram in patients with major depressive disorder. Psychopharmacology, 239(11), 3447–3460. [DOI:10.1007/s00213-021-05915-7] [PMID]
Mason, S. J., & Graham, N. E. (2002). Areas beneath the relative operating characteristics (ROC) and relative operating levels (ROL) curves: Statistical significance and interpretation. Quarterly Journal of the Royal Meteorological Society, 128(584), 2145-2166. [DOI:10.1256/003590002320603584]
Mullen, T. R. (2014). The dynamic brain: Modeling neural dynamics and interactions from human electrophysiological recordings [PhD dissertation]. San Diego: University of California. [Link]
Mumtaz, W., Xia, L., Mohd Yasin, M. A., Azhar Ali, S. S., & Malik, A. S. (2017). A wavelet-based technique to predict treatment outcome for Major Depressive Disorder. Plos One, 12(2), e0171409. [DOI:10.1371/journal.pone.0171409] [PMID]
Otte, C., Gold, S. M., Penninx, B. W., Pariante, C. M., Etkin, A., Fava, M., & Mohr, D. C., et al. (2016). Major depressive disorder. Nature reviews. Disease Primers, 2, 16065. [DOI:10.1038/nrdp.2016.65] [PMID]
Patel, M. J., Andreescu, C., Price, J. C., Edelman, K. L., Reynolds, C. F., 3rd, & Aizenstein, H. J. (2015). Machine learning approaches for integrating clinical and imaging features in late-life depression classification and response prediction. International Journal of Geriatric Psychiatry, 30(10), 1056-1067. [DOI:10.1002/GPS.4262] [PMID]
Peker, M., Arslan, A., Sen, B., Celebi, F. V., & But, A. (2015). A novel hybrid method for determining the depth of anesthesia level: Combining ReliefF feature selection and random forest algorithm (ReliefF+RF). Paper presented at: 2015 International Symposium on Innovations in Intelligent SysTems and Applications (INISTA), Madrid, Spain, 02-04 September 2015. [DOI:10.1109/INISTA.2015.7276737]
Pizzagalli, D. A. (2011). Frontocingulate dysfunction in depression: Toward biomarkers of treatment response. Neuropsychopharmacology : Official Publication of the American College of Neuropsychopharmacology, 36(1), 183-206. [DOI:10.1038/NPP.2010.166] [PMID]
Sambunaris, A., Hesselink, J. K., Pinder, R., Panagides, J., & Stahl, S. M. (1997). Development of new antidepressants. The Journal of Clinical Psychiatry, 58 (Suppl 6), 40–53. [PMID]
Schultz, D. H., Ito, T., Solomyak, L. I., Chen, R. H., Mill, R. D., & Anticevic, A., et al. (2018). Global connectivity of the fronto-parietal cognitive control network is related to depression symptoms in the general population. Network Neuroscience, 3(1), 107-123. [DOI:10.1162/NETN_A_00056] [PMID]
Schwartz, B., Cohen, Z. D., Rubel, J. A., Zimmermann, D., Wittmann, W. W., & Lutz, W. (2021). Personalized treatment selection in routine care: Integrating machine learning and statistical algorithms to recommend cognitive behavioral or psychodynamic therapy. Psychotherapy Research, 31(1), 33-51. [DOI:10.1080/10503307.2020.1769219] [PMID]
Şen, B., Peker, M., Çavuşoğlu, A., & Çelebi, F. V. (2014). A comparative study on classification of sleep stage based on eeg signals using feature selection and classification algorithms. Journal of Medical Systems, 38(3), 18. [DOI:10.1007/S10916-014-0018-0] [PMID]
Shahabi, M. S., & Shalbaf, A. (2022). Prediction of treatment outcome in major depressive disorder using ensemble of hybrid transfer learning and long short term memory based on EEG Signal. IEEE Transactions on Cognitive and Developmental Systems, 15(3), 1279 - 1288. [DOI:10.1109/TCDS.2022.3207350]
Smit, D. J., Stam, C. J., Posthuma, D., Boomsma, D. I., & de Geus, E. J. (2008). Heritability of “small-world” networks in the brain: A graph theoretical analysis of resting-state EEG functional connectivity. Human Brain Mapping, 29(12), 1368-1378. [DOI:10.1002/hbm.20468] [PMID]
Stahl, S. M., & Grady, M. M. (2003). Differences in mechanism of action between current and future antidepressants. The Journal of Clinical Psychiatry, 64 (Suppl 13), 13–17. [PMID]
Subasi, A., & Gursoy, M. I. (2010). EEG signal classification using PCA, ICA, LDA and support vector machines. Expert Systems with Applications, 37(12), 8659-8666. [DOI:10.1016/J.ESWA.2010.06.065]
van der Vinne, N., Vollebregt, M. A., Boutros, N. N., Fallahpour, K., van Putten, M. J. A. M., & Arns, M. (2019). Normalization of EEG in depression after antidepressant treatment with sertraline? A preliminary report. Journal of Affective Disorders, 259, 67-72. [DOI:10.1016/J.JAD.2019.08.016] [PMID]
Webb, C. A., Trivedi, M. H., Cohen, Z. D., Dillon, D. G., Fournier, J. C., & Goer, F., et al. (2019). Personalized prediction of antidepressant v. placebo response: Evidence from the EMBARC study. Psychological Medicine, 49(07), 1118-1127. [DOI:10.1017/S0033291718001708] [PMID]
Whitton, A. E., Deccy, S., Ironside, M. L., Kumar, P., Beltzer, M., & Pizzagalli, D. A. (2018). Electroencephalography source functional connectivity reveals abnormal high-frequency communication among large-scale functional networks in depression. Biological Psychiatry: Cognitive Neuroscience and Neuroimaging, 3(1), 50-58. [DOI:10.1016/j.bpsc.2017.07.001] [PMID]
WHO. (2017). Depression and other common mental disorders: Global health estimates. Geneva: World Health Organization. [Link]
Zhang, Y., Wang, K., Wei, Y., Guo, X., Wen, J., & Luo, Y. (2022).Minimal EEG channel selection for depression detection with connectivity features during sleep. Computers in Biology and Medicine, 147, 105690. [DOI:10.1016/j.compbiomed.2022.105690] [PMID]
Zhdanov, A., Atluri, S., Wong, W., Vaghei, Y., Daskalakis, Z. J., & Blumberger, D. M., et al. (2020). Use of machine learning for predicting escitalopram treatment outcome from electroencephalography recordings in adult patients with depression. JAMA Network Open, 3(1), e1918377.[DOI:10.1001/JAMANETWORKOPEN.2019.18377] [PMID]
Type of Study: Original |
Subject:
Cognitive Neuroscience
Received: 2024/04/20 | Accepted: 2024/10/26 | Published: 2024/11/1
Received: 2024/04/20 | Accepted: 2024/10/26 | Published: 2024/11/1
Send email to the article author
| Rights and permissions | |
 |
This work is licensed under a Creative Commons Attribution-NonCommercial 4.0 International License. |
![]()
Copyright © The Author(s);
This is an open access article distributed under the terms of the Creative Commons Attribution License (CC-By-NC), which permits use, distribution, and reproduction in any medium, provided the original work is properly cited and is not used for commercial purposes.
Contact Information
