

Volume 15, Issue 3 (May & Jun 2024)
BCN 2024, 15(3): 403-420 |
Back to browse issues page


Download citation:
BibTeX | RIS | EndNote | Medlars | ProCite | Reference Manager | RefWorks
Send citation to:


BibTeX | RIS | EndNote | Medlars | ProCite | Reference Manager | RefWorks
Send citation to:
Tehrani-Safa A, Ghaderi R, Herasat M, Sarabi-Jamab A. Peer-mediated Social Signals Alter Risk Tolerance in Teenage Boys Depending on their Peers. BCN 2024; 15 (3) :403-420
URL: http://bcn.iums.ac.ir/article-1-2669-en.html
URL: http://bcn.iums.ac.ir/article-1-2669-en.html


1- Institute for Cognitive and Brain Sciences, Shahid Beheshti University, Tehran, Iran.
2- Department of Psychology, Faculty of Psychology and Educational Sciences, University of Tehran, Tehran, Iran.
3- School of Cognitive Sciences, Institute for Research in Fundamental Sciences (IPM), Tehran, Iran.
2- Department of Psychology, Faculty of Psychology and Educational Sciences, University of Tehran, Tehran, Iran.
3- School of Cognitive Sciences, Institute for Research in Fundamental Sciences (IPM), Tehran, Iran.
Full-Text [PDF 1652 kb]
| Abstract (HTML)
Supplementary material
Supplemental information on the task and the experimental procedure
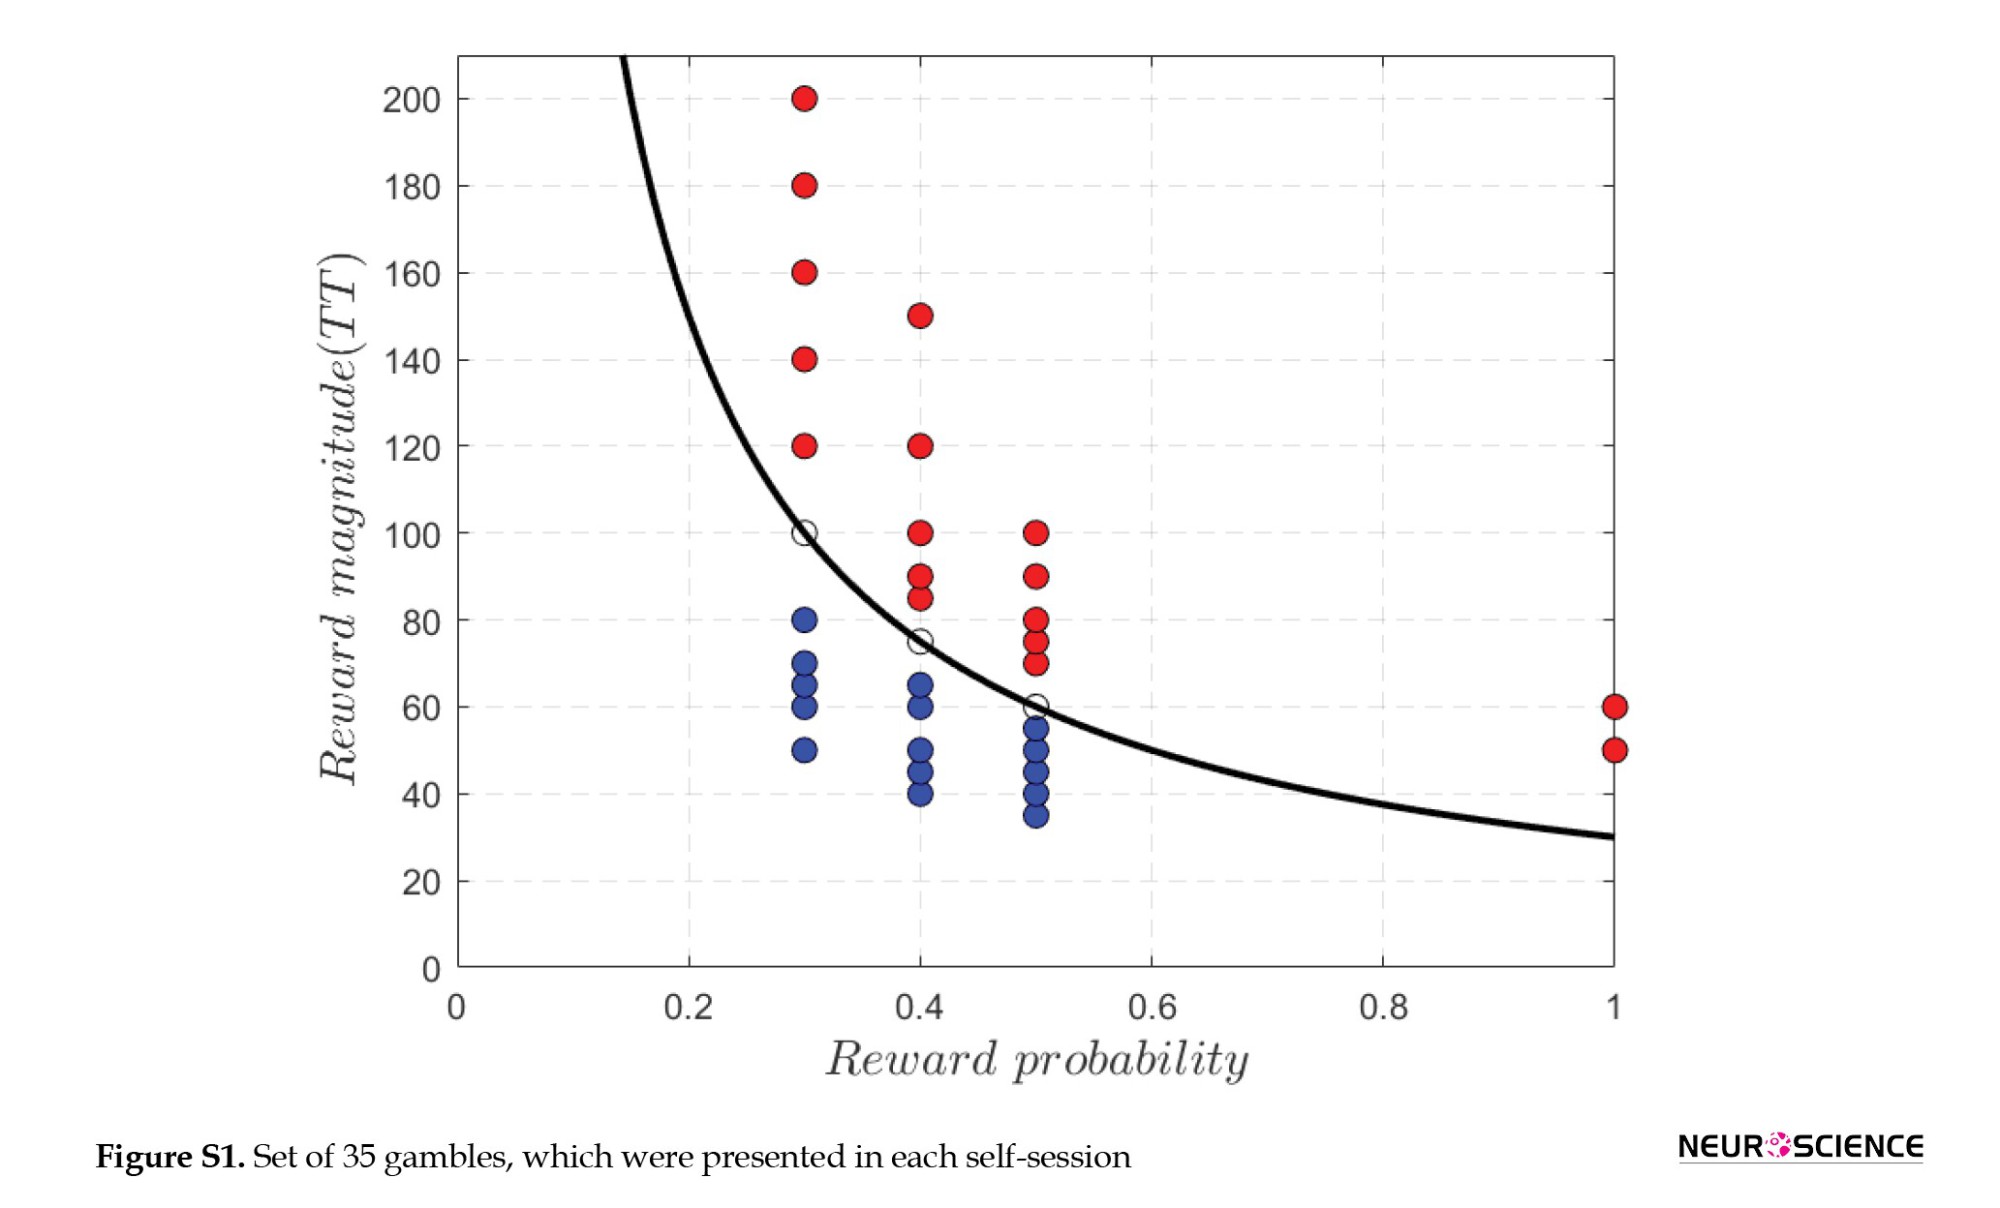
The gambles are represented by two parameters ρ and r, where ρ is the probability of receiving the reward and r is the amount of that reward. Reward probabilities (ρ) were 0.3, 0.4, and 0.5. T is important to highlight that we do not consider small probabilities (ρ<0.3), thereby minimizing the impact of subjective probability distortion as suggested in prospect theory (Tversky & Kahneman, 1992). Also, ρ and r are systematically varied to decouple the expected value of the reward from its mathematical variance. The sure payoff had a fixed value of 30TT. We set the gambles such that the risk-neutral participants chose gambling in nearly half of the trials (Figure S.1).
Computational model of decision-making under risk
In our study, participants’ attitudes toward risk were estimated through the widely used computational framework (Blankenstein et al., 2016; Braams et al., 2021; Levy et al., 2010; Tymula et al., 2012). The power utility function (Bernoulli, 1954) is used to model the subjective value of a risky option (Equation S.1):

p represents the risk attitude of the participants and is less and greater than 1 if he is a risk-averse and risk-taker, respectively. Also, ρ=1 indicates risk neutrality. The following Softmax function was employed to model the probabilistic nature of choice in the model of behavior in Equation S.2. Based on the difference between the expected utility of the two options, the Softmax function calculates the probability that a decision-maker will choose the gambling option (Ciranka & van den Bos, 2019).
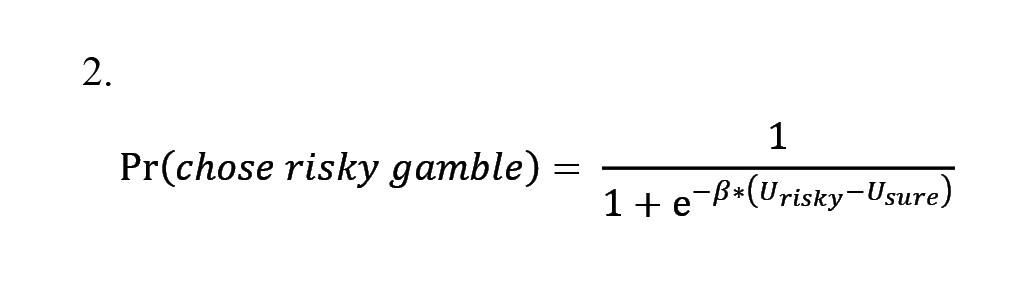
In Equation S.2, β is a non-negative free parameter that models the degree, to which the choice probability relates to the utility difference. As β becomes smaller, choices become more random. It should be noted that this risk attitude estimation method is highly consistent with other commonly used model-based and model-free methods (Suzuki et al., 2016).
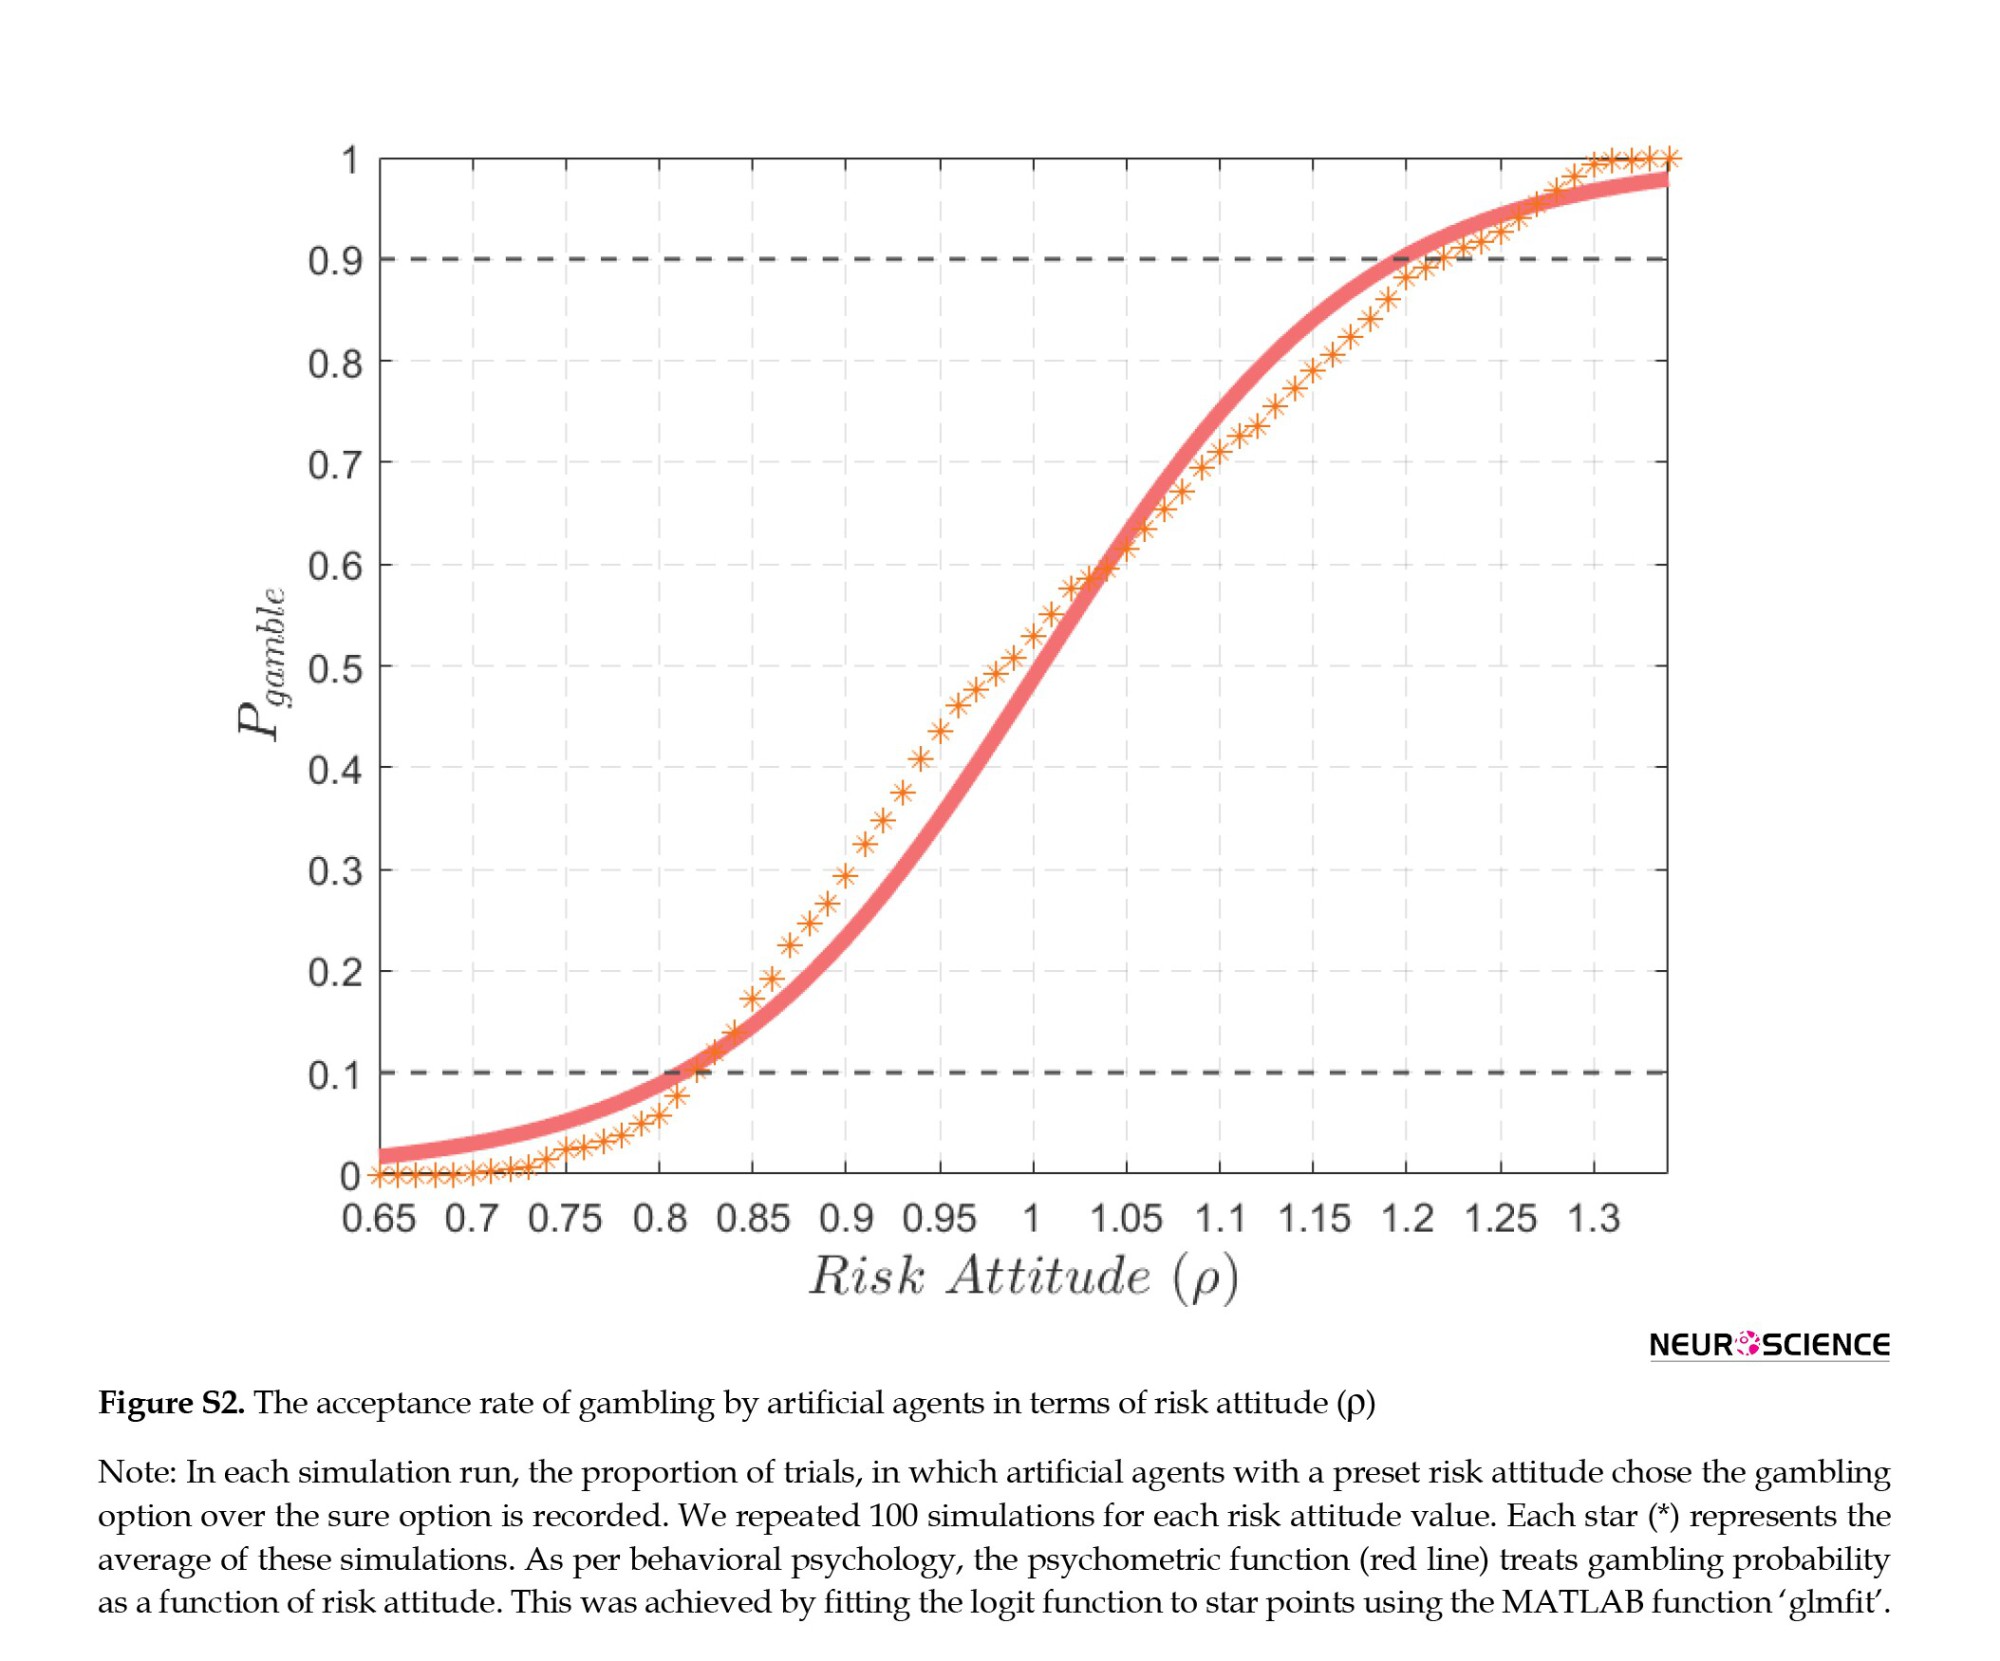
We set lower and upper bounds on the risk attitude ρ such that the estimated risk attitude always falls between 0.8 and 1.2. This range was found based on a computer simulation procedure. We simulated subjects with a variety of risk attitude characteristics and 100 simulations were run for each value of ρ. For all simulations, β is set to 5. Figure S.2 illustrates the probability of accepting the gamble for various values of ρ. Based on the simulations, subjects with a risk attitude of less than 0.8 rejected gambling, and subjects with a risk attitude greater than 1.2 chose gambles in over 90% of the trials. Therefore, risk attitudes greater than 1.2 and smaller than 0.8 result in a low variation in choice patterns. After fixing this range, we feed the behavioral data into the optimization algorithm.
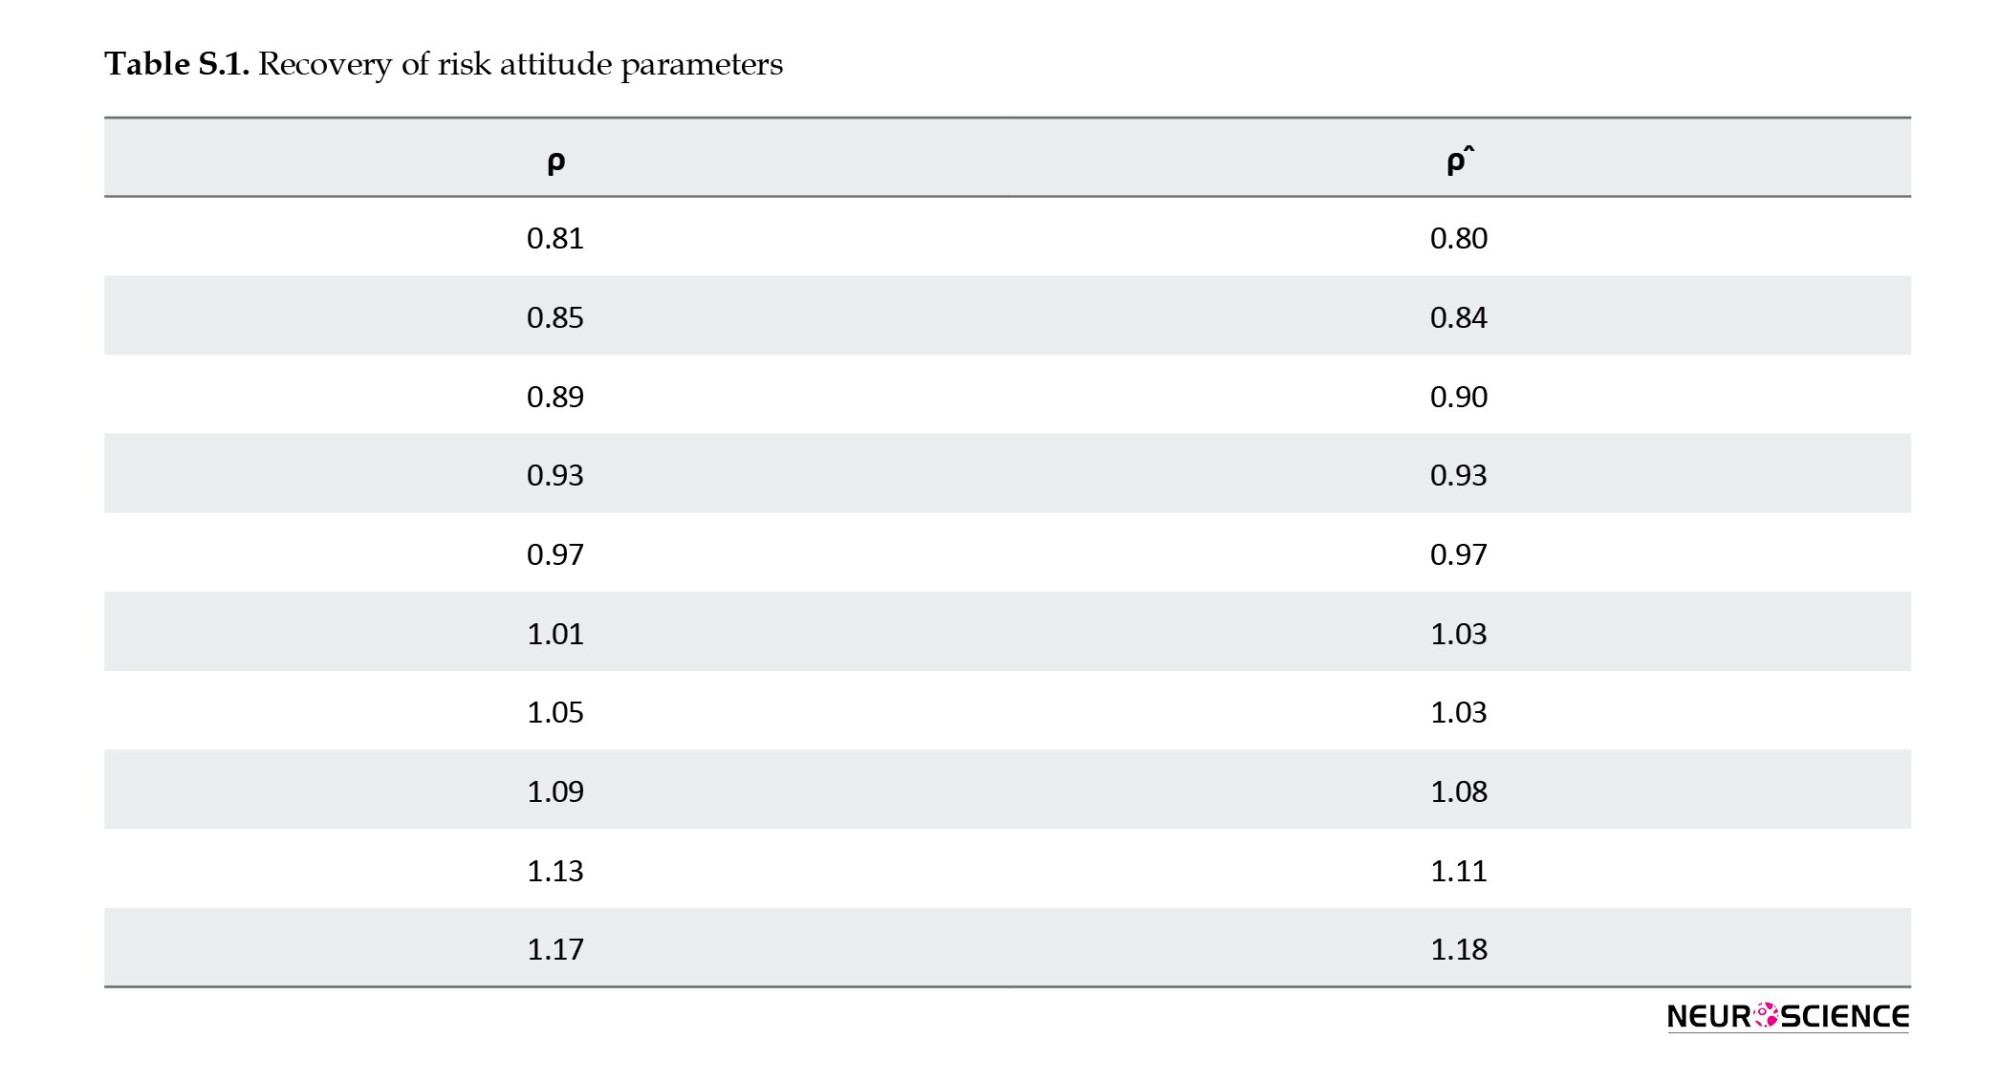
To ensure the reliability of estimation, we simulated choices under different risk attitudes. We used the same set of gambling options and the same number of trials as in the original experiment. These choices were re-fitted based on our computational model. The recovery procedure appears to be highly accurate as can be seen in Table S.1
Data availability
All data and code supporting the findings of this study are available from the public repository, accessible at https://github.com/ahtehranisafa/adolescents-social-weight.
Full-Text:
1. Introduction
Risk-taking behaviors can be observed in various contexts, from extreme sports and gambling to drug use and unprotected sex. Teenage years are associated with increased risk-taking behavior (Steinberg, 2008). For instance, when it comes to financial matters, teenagers may venture into risky investments in the stock market or cryptocurrency without proper guidance. Another example is spending money on expensive electronics, such as smartphones and gaming consoles. Peer influence is a powerful force in the lives of teenagers, particularly in the digital age when they are exposed to social media (Valkenburg et al., 2022). These influences play a crucial role in their decision-making processes. Teenagers frequently look to their peers for guidance on clothing, music preferences, and behavior. Peer influence can have both positive and negative impacts (Molleman et al., 2022). Positive peer influence can encourage teenagers to make good choices, such as abstaining from drugs and alcohol, while negative peer influence can lead them to engage in risky behaviors, such as smoking or skipping school.
Smoking and drinking alcohol are more prevalent among adolescents when they are in the company of peers, and having friends who smoke and drink is a predictor of their substance use (Andrews et al., 2002; Loke & Mak, 2013). Laboratory studies have demonstrated that adolescents engage in riskier behaviors when interacting with peers compared to when they are alone (Albert et al., 2013; Blankenstein et al., 2016; Gardner & Steinberg, 2005).
Some studies have found that contextual factors affect whether and how peer presence influences decision-making. Teenagers may engage in risky behaviors in the presence of peers if they believe it will enhance, protect, or reinforce their social relationships (Somerville et al., 2019). Evidence from humans and animals suggests that the presence of others may increase the value of non-social rewards (Foulkes & Blakemore, 2016). Adolescents are more susceptible to peer influence and are more prone to risky behavior, so peer presence theoretically has a greater impact on risky behavior among adolescents than among adults (Gardner & Steinberg, 2005). Although adolescents can evaluate the risks and consequences of their behavior, being with peers can prompt them to exhibit risk-taking behaviors (Smith et al., 2014).
Observing and learning from others’ risk-related decisions can also influence individuals to change their risk preferences, a phenomenon known as risk contagion (Reiter et al., 2019; Suzuki et al., 2016). When a participant mimics the decision of their peer, the degree of contagion is positive. For instance, if a colleague takes a risky investment, the participant is likely to follow the same manner. Conversely, if the partner chooses a risk-averse option, the participant is inclined to do the same.
Recent studies have shown the effect of contagion when we have information about others’ risk-related choices (Suzuki et al., 2016). Similar to adults, this kind of social stimulus affects adolescents as well (Braams et al., 2021; Reiter et al., 2019). Adolescents tend to adjust their behavior to align with that of their peers. They utilize peers as a source of information and can adapt their behavior through peer-to-peer observations (Reiter et al., 2019). In adolescents, observing peers’ gambling choices changes the subjective value of those gambles (Blankenstein et al., 2016). In a recent study on adolescents (Braams et al., 2021), participants observed the gambling choices of peers in some experimental trials. It was observed that this observation influenced adolescents’ subjective values of peer-selected choices. This change is better characterized by a shift in risk attitude rather than a simple social bias towards or against the utility of gambling choices (Suzuki et al., 2016).
We designed an experiment to examine how social learning influences risk attitudes in early adolescents. Our experimental design was as follows: In the first session (self-phase), participants made choices between a sure option and a risky variable option. This was followed by the second session (prediction session), where they predicted the choices of a hypothetical participant and immediately received feedback on the accuracy of their predictions. Participants performed the self-evaluation phase for a second time in the final session (session three) after the prediction session.
Our analysis comprises two main steps: Firstly, we examined whether attitudes toward risk shift after early adolescents learn about their peers’ risk attitudes (measuring the contagion effect). The second step involved formulating participants’ risk attitudes after learning about their peers as a function of their baseline risk attitudes and those of their peers. We calculated the relative distance between participants and their peers and represented participants’ risk attitudes after seeing their peers as a weighted average of their baseline risk attitude and their peers to determine how much social information is weighted by the adolescents. Using this method, we can quantify how individuals integrate their personal risk attitudes with their peers’ attitudes in a weighted average model. This method, which has recently been applied in studies involving perceptual decision-making tasks (Molleman et al., 2019b; Molleman et al., 2020, Molleman et al., 2022), allows participants to revise their initial estimates after seeing what another person estimates.
2. Materials and Methods
Sample
To determine the appropriate sample size, we conducted a power analysis. Using the effect size of the contagion in risk attitude from a recent study (effect size: d=0.58) (Suzuki et al., 2016), and considering a significance level α=0.05, the power analysis indicated that a total sample size of N=27 would ensure a power >0.90. We recruited 38 middle school male students aged 12-15 years (Mean±SD age 13.18±0.48, median age=13). Data collection was restricted to male participants, consistent with previous research (Reiter et al., 2019), due to differences in pubertal development trajectories between female and male adolescents, as well as evidence of baseline gender differences in risk preferences (Byrnes et al., 1999).
Before the experiment, participants completed a demographic form, which included questions about recent psychiatric disorders. According to their self-reported responses, none of them had received a recent psychiatric diagnosis.
Participants and their parents signed an informed consent form. The research was approved by the SCS Research Ethics Committee of the Institute for Research in Fundamental Sciences (IPM).
Procedure and task
The experiment consisted of three sessions, with each session presenting 35 trials to each participant. The first and third sessions aimed to evaluate the participants’ level of risk attitude. Termed the “self-phase,” these sessions required participants to choose between accepting or rejecting a gambling offer in each trial. Participants were informed that if they rejected the offer, they could receive a guaranteed amount of money (30 TT; Thousand Iranian Tomans, at the time of the experiment, 1$ was equal to 4.2 TT). However, if they accepted the offer, they could enter the gamble at the end of the game. The amount of money involved in the gambling offer for all trials exceeded 30 TT to ensure participants would not choose it if it were lower than the guaranteed money (30 TT).
To prevent potential influences of reward feedback on their decision-making process, the outcome of the gamble was not revealed to participants in each trial. At the end of the experiment, one choice was randomly chosen and implemented as part of the payment procedure (refer to payment procedure for further details). Given that participants did not know which trial would be selected, all trials were treated equally, as if they were the only ones.
Consistent with recent developmental studies (Blankenstein et al., 2016; L van Leijenhorst, 2006; Shad, 2011; Van Den Bos & Hertwig, 2017), we used wheels of fortune to visualize gambles. For each gambling offer, the chances of winning and the amount of money the participants could earn were shown on a pie chart, and they were asked to accept or reject the offer using the right and left arrow keys on the keyboard. The pie chart shown to the participants consisted of a blue area showing the probability of winning, and inside the blue area, they could see the amount of gambling money (Supplemental information on the task and the experimental procedure and Figure S.1).
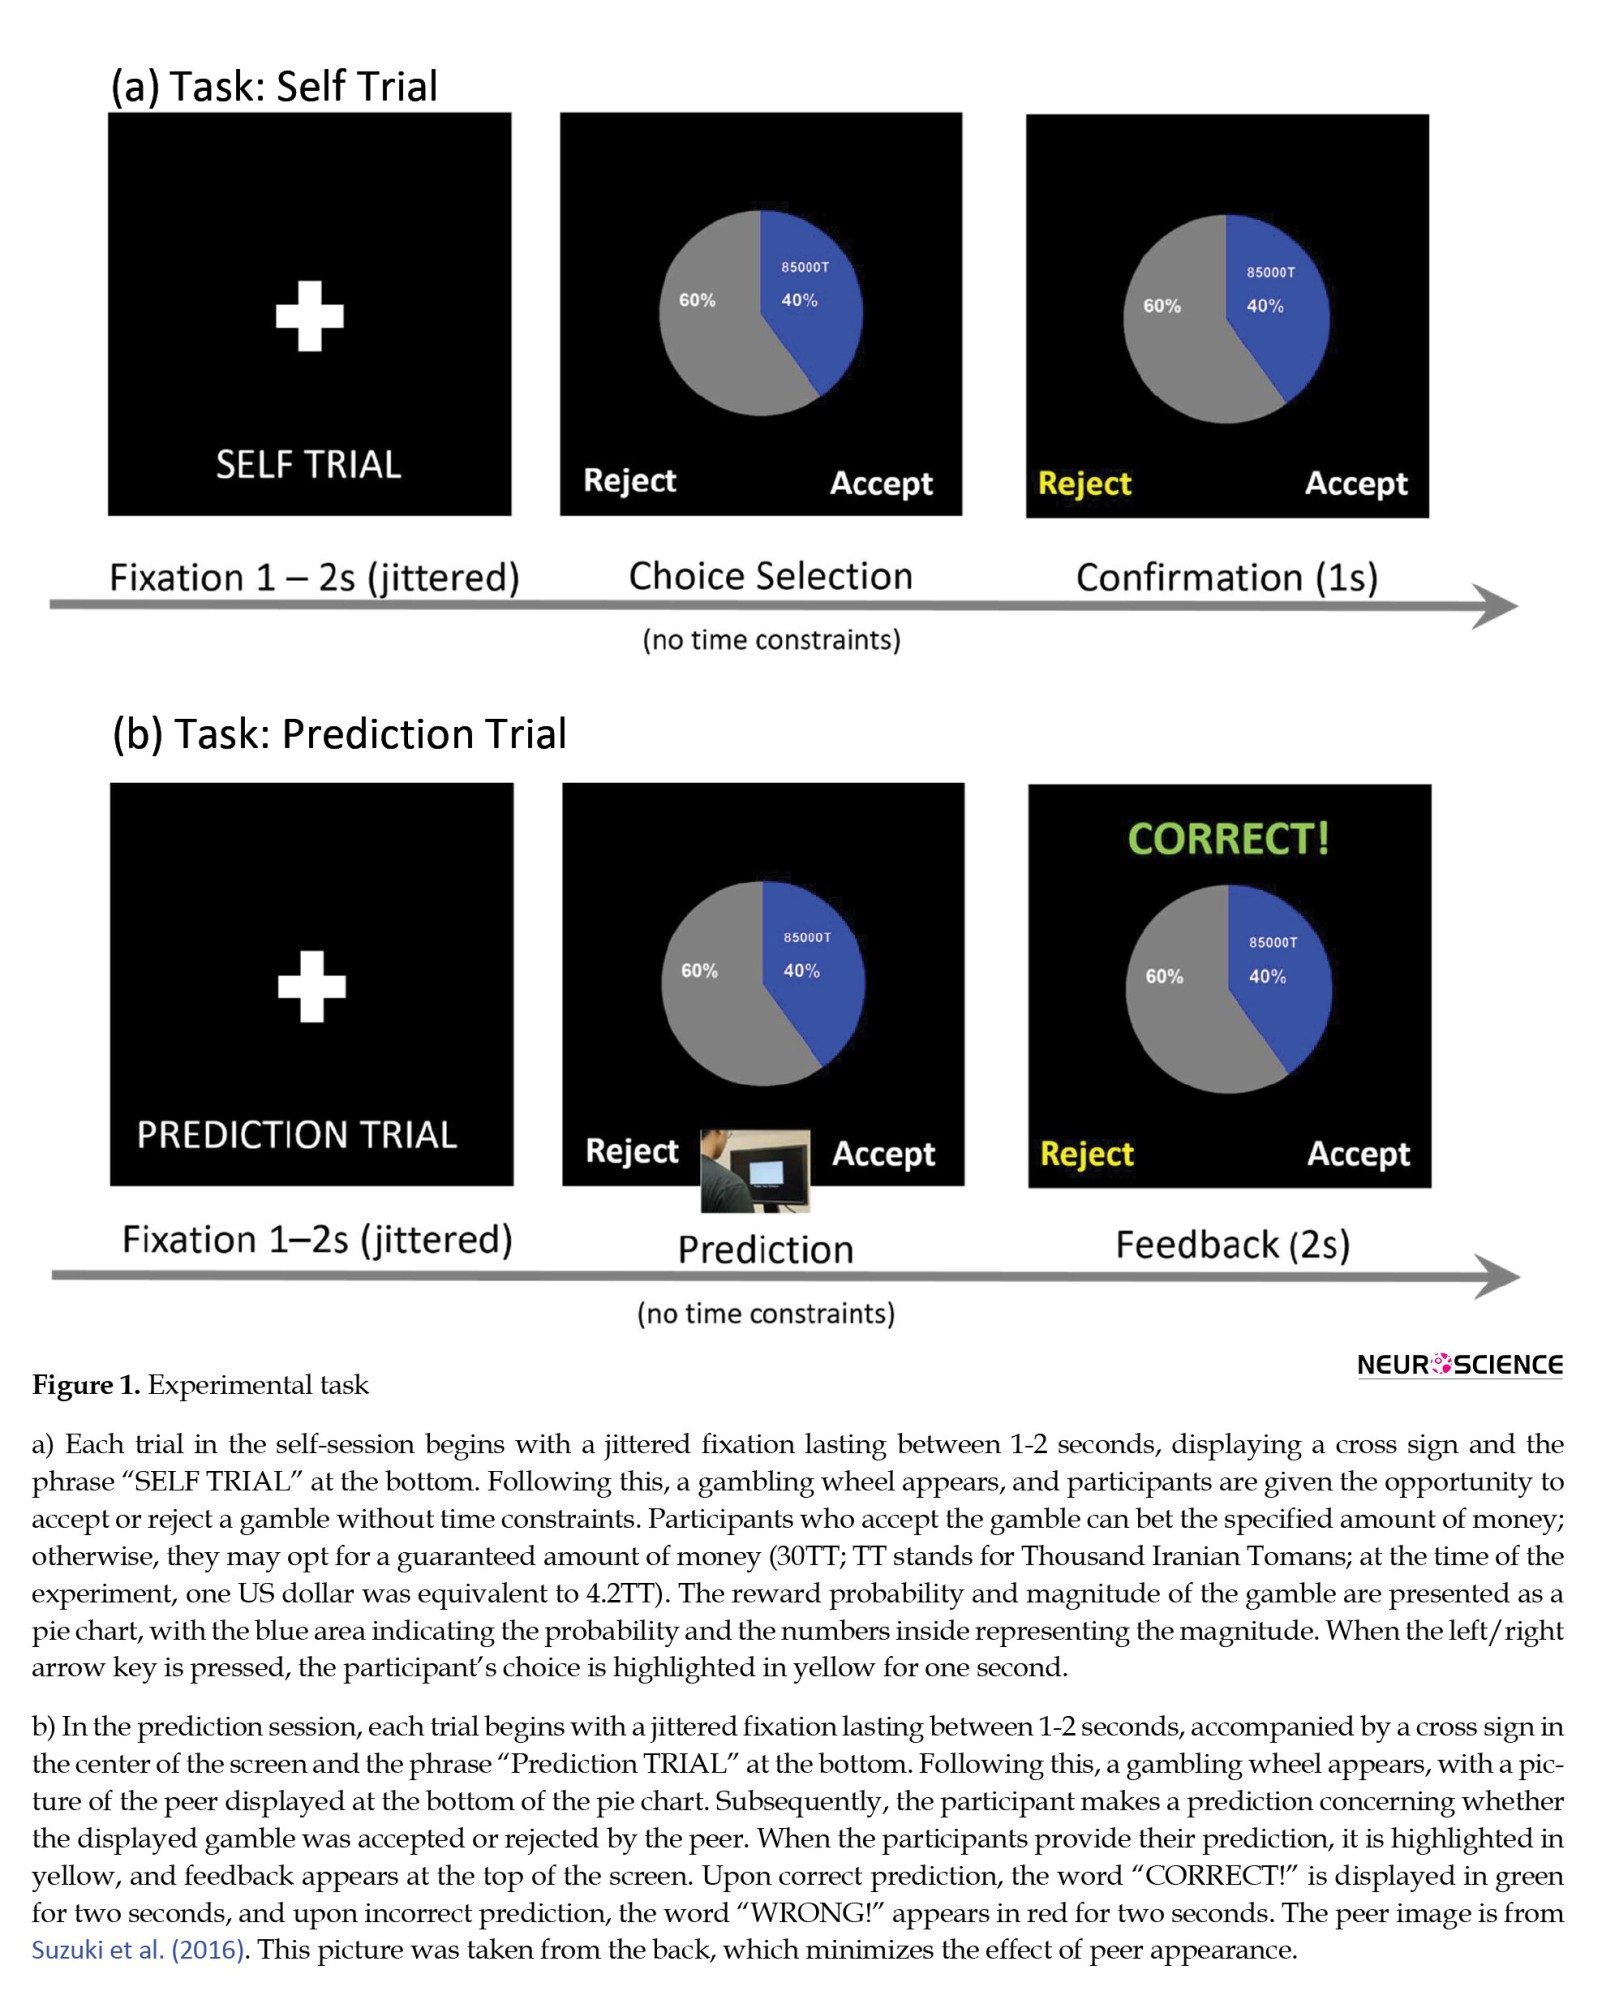
This type of stimulus is frequently used in developmental research to illustrate probability to adolescents who have recently begun to grasp the concept of probability (Figure 1a).
To identify the misleading data of inattentive participants, two trials were included in each self-session with a 100% chance of winning. The amount of reward offered by risk-free gambles is higher than the sure payoff. Accordingly, economic rationality dictates that participants should always prefer the risk-free gamble to the sure option regardless of their risk attitude. If a participant rejected both trials, that data was considered invalid. In the second session, known as the “prediction phase,” the second round of 35 trials was conducted. During this session, the participants were asked to predict the choices made by their peers, and then, the computer would give them feedback on the correctness of their predictions (Figure 1b). Throughout the instruction, they were informed that one of their peers had played the game before, and their data were recorded. In reality, the data shown to the participants were generated by a computer algorithm (Supplementary material: Computational model of decision-making under risk section for details of the algorithm) and exhibited two patterns of risk-taking or risk-averse behavior. Each participant was randomly assigned to one of these patterns, assuming that it was the data from their peers, and trying to guess the pattern and predict their answer. During the experiment, none of the participants doubted that the peer choices were real. The simulated risk-seeker peers chose gambles in 80±3% of trials (ranged 77–86%), whereas the simulated risk-averse peers chose gambles in 19±2.5% of trials (ranged 14–23%).
Before starting the actual experiment, the participants went through a training phase where they experienced three trials similar to the self-phase of the experiment and three trials similar to the prediction phase. Then, they proceeded to the actual experiment. To avoid tiredness and its possible effects on participants’ choices, the participants were allowed to rest a while between the sessions and then continue the game by pressing a random key. This was reminded to them after they finished each session.
Payment procedure
The reward calculation process consisted of two parts: one for self-trials and one for prediction trials. The payment process for self-sessions was as follows: The computer randomly selected one trial from sessions 1 and 3 and displayed it along with the participant’s choice. Participants who accepted the offer on that trial were required to provide a number between 1 and 100. Depending on the chances of winning in that gambling offer, a given percent of these numbers were marked as “win,” and the rest were labeled “lose.” If the bet numbers given by participants were labeled as “win,” they won the offer and received their reward. Participants who chose not to accept the offer on the selected trial were also given a certain amount of 30 TT.
The computer also randomly selected one of the trials for the prediction session. An additional 30TT was awarded if the participant’s prediction on that trial was correct. Based on the protocols for an experiment involving early adolescents, we are unable to pay cash directly to the participants. Accordingly, we summed up each participant’s scores over the course of the experiment and awarded them a prize equal to the sum of those scores.
Statistical analyses
Two different measures were used to assess risk attitude (model-based and model-free methods). To derive a parameter representing the participant’s risk attitude based on our model-based method, we fitted an exponential utility function to the participants’ choices. Detailed information on exponential utility functions and model fitting can be found in the Supplementary material: Computational model of decision-making under risk. A model-free measure of participants’ risk preferences is the proportion of gambles accepted compared to the (hypothetical) proportion acceptable to a risk-neutral agent (Reiter et al., 2019; Suzuki et al., 2016). A risk-neutral agent chooses whether or not to gamble by comparing the expected reward of the gamble (the probability times the magnitude of the reward) with the value of a safe option.
In the prediction trials, participants predicted the choices that the peer made and immediately received feedback on the correctness of their predictions. The performance in prediction could be interpreted as a way to assess how well participants had learned about their peers’ behaviors. We measured the percentage of correct guesses as participants’ performance in the prediction phase.
We divided the prediction session, which consisted of 35 trials into four parts: Train trials, early trials, middle trials, and late trials. This allowed us to gain a deeper understanding of participants’ prediction behavior. The first five trials constitute the train part, and the remaining parts each consist of 10 trials. We assumed performance at prediction as being significantly free of chance if the proportion of correct predictions is larger than the specified threshold.
To calculate this threshold, we employed the method introduced by Steffens et al. (2020), which involved retaining the first five trials (train trials) and calculating the threshold based on the subsequent 30 trials. Thus, in this context, if the observed performance exceeded 63.3%, it could be reasonably assumed that the performance was significantly above chance levels (Steffens et al., 2020).
From the initial 38 participants, seven were excluded from the final analysis. One participant was eliminated due to providing an incorrect response during the risk-free trials, indicating a lack of attention to the task procedure. Two further participants were excluded due to their prediction performance falling below the chance threshold in the prediction session, suggesting that they did not learn their peers’ choices efficiently. Additionally, following a model-based analysis, it was determined that four participants made the majority of their decisions randomly, and thus, their data were removed from further analysis. Ultimately, the data from the remaining 31 participants were used for analysis.
Data analysis was conducted using MATLAB software (2017; The Mathworks, Natick, MA). Common statistical analyses, such as Pearson’s linear correlation and t-tests, were performed using the “statistics and machine learning toolbox functions.” Linear models were constructed using the “fitglm” and “lsqlin” functions. Risk attitudes were extracted using the maximum likelihood method, wherein choices from each self-session were fitted using the “fmincon” function with the SQP search algorithm. To determine the sample size for the current study, we conducted power analysis in G*Power software, version 3.1 (Faul et al., 2007).
3. Results
We assessed the participants’ risk attitudes at baseline, reflecting their attitudes toward risk before exposure to social influence (Figure 1). This was achieved by fitting a computational model of decision-making under risk to the choice data collected from each participant in the first session (Supplementary material: Computational model of decision-making under risk).
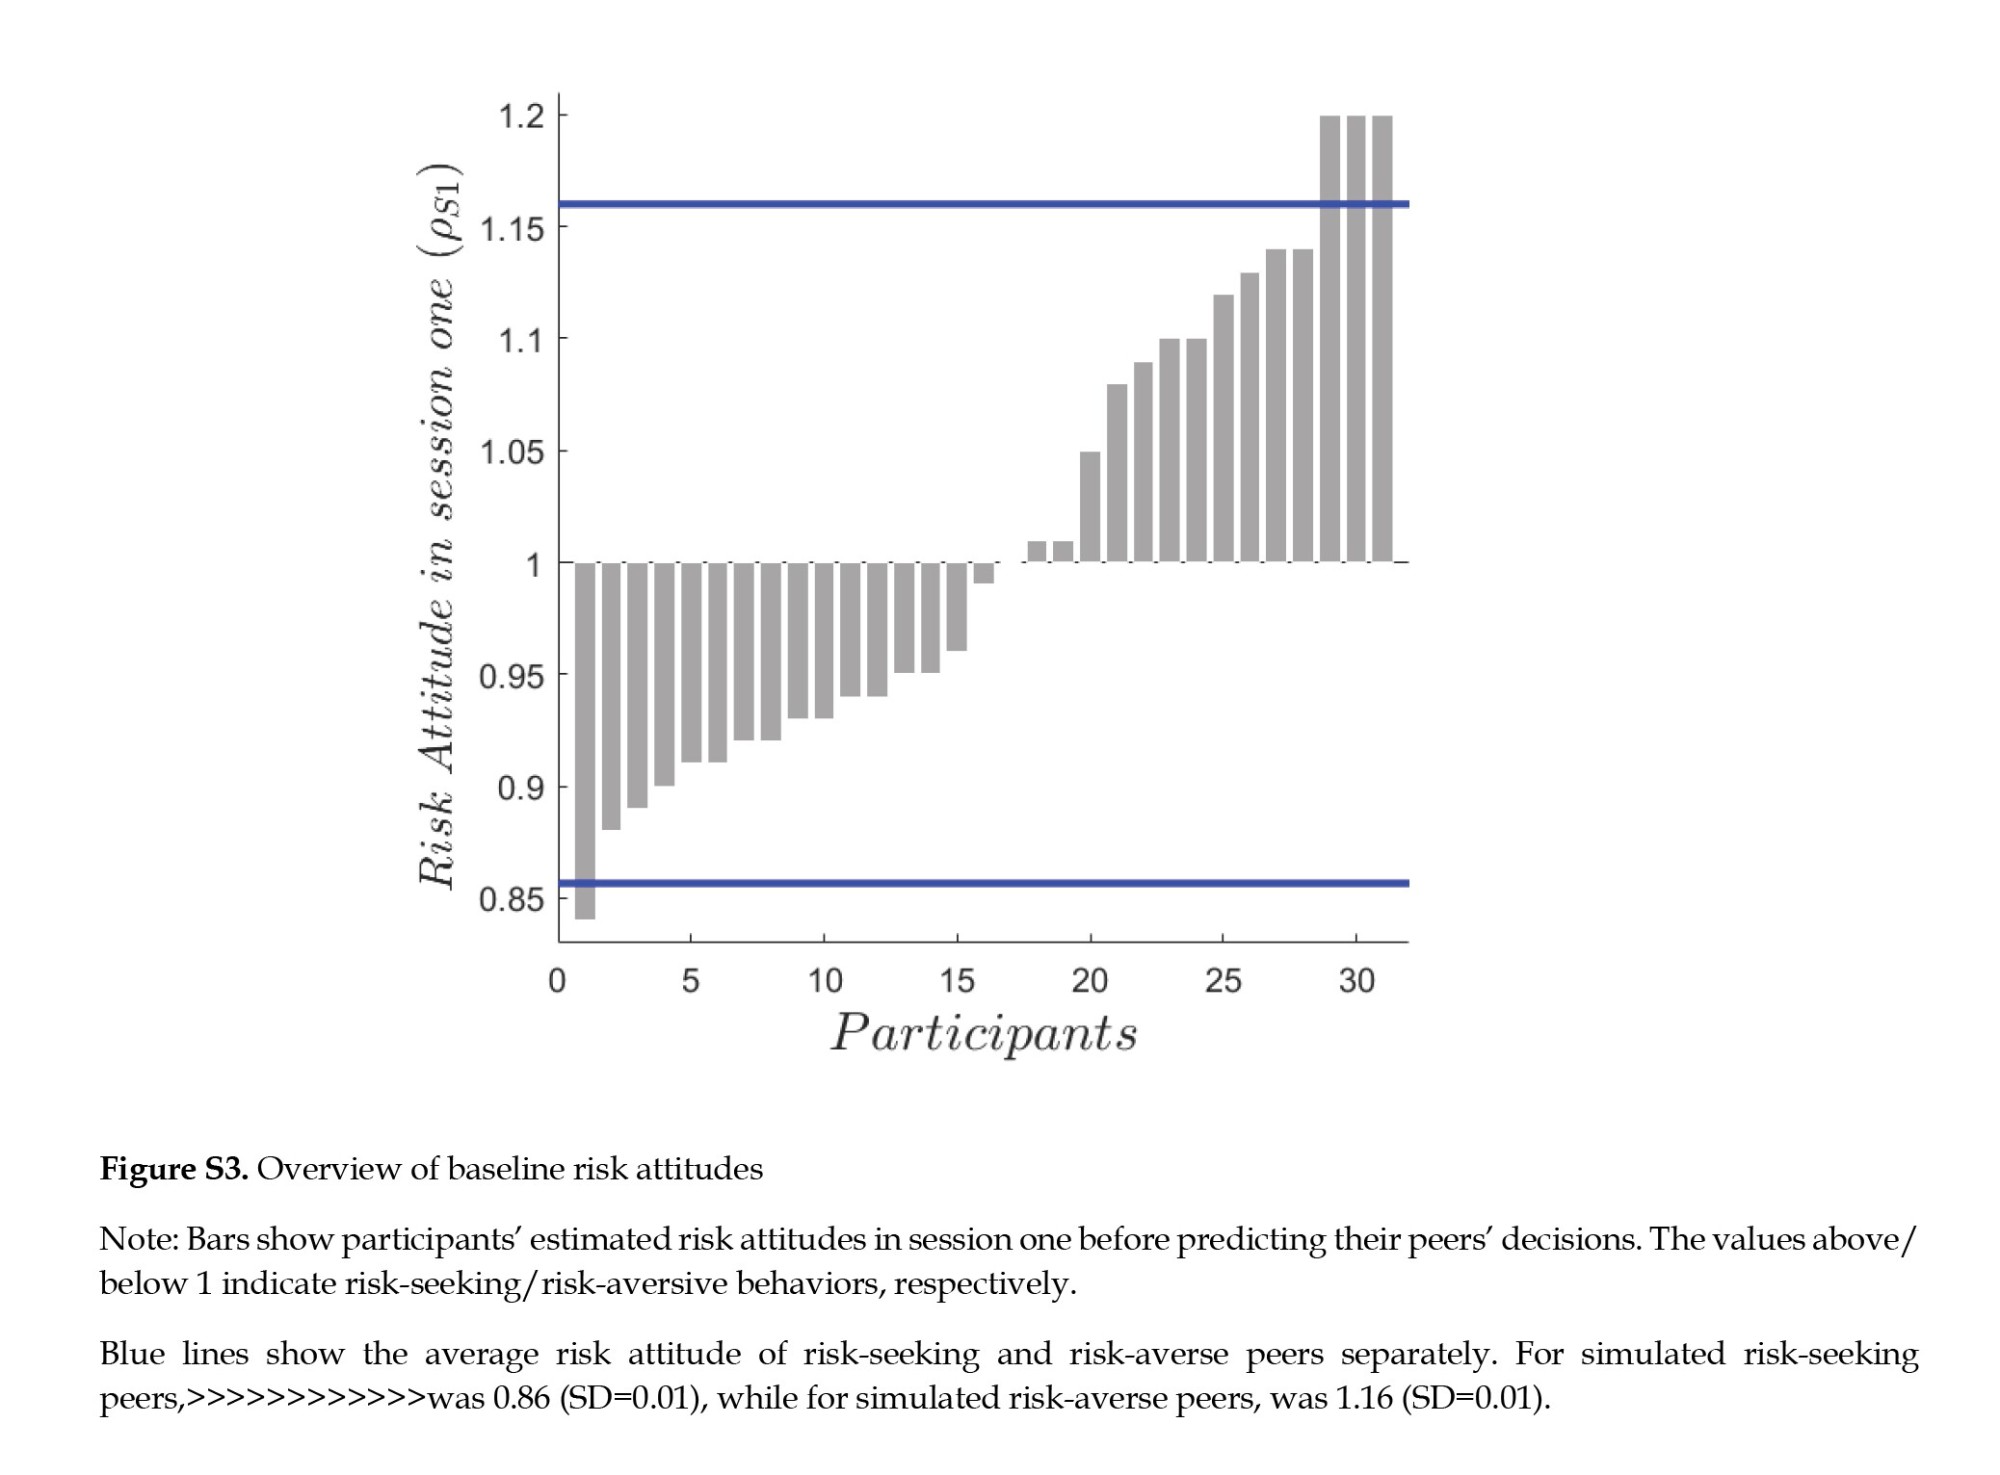
Contrary to previous studies on adolescence (Blankenstein et al., 2016; Reiter et al., 2019; Tymula et al., 2012), risk aversion did not seem to be a common characteristic among the samples (Figure S3). Based on the computational model, participants’ risk attitudes in session 1 (ρs1) ranged between 0.84 and 1.20 (ρs1 Mean±SD 1.01±0.10, median=0.99), reflecting a broad range of risk aversion and risk-taking behaviors. There are roughly equal proportions of risk-seekers and risk-averse participants in the sample (14 participants were risk-seekers (ρs1>1), 16 were risk-averse (ρs1<1), and one was risk-neutral (ρs1=1)). Furthermore, participants who predicted and observed risk-averse peers have no distinct baseline risk attitudes from those who predicted and observed risk-seeking peers (two-sample t-test, t=-0.1, df=29, and P=0.92).
Participants showed high performance during the prediction phase, which indicates that they successfully learned their peers’ risk behavior (Mean±SD 82%±8%, range: 63%-97%) (Figure S4). The data from the two participants with unsatisfactory prediction performance were not taken into account because their prediction performance was lower than the chance threshold (63.3%) in the prediction session.
A prediction session with 35 uninterrupted trials was conceptually divided into four parts. In the beginning, participants were not familiar with the data and therefore, their performance was below the chance threshold. However, as the session went on, they started to identify patterns and make more accurate predictions because they had more time to become familiar with the data and the emerging patterns, allowing them to better understand the data and make more accurate predictions.
Despite performing below chance in the first five trials (train trials), the subsequent ten trials (early trials) showed remarkable progress (performance in the early part: Mean±SD 80±14%, t=6.68, df=30, and P<10-5). On average, the early part performance was 11% higher than the train part. Then, the average proportion of correct predictions remained above 80% (middle and late parts). It ensured that the quality of prediction remained in the acceptable range until the end of the prediction phase, despite potential factors, such as lack of attention.
In line with previous studies (Braams et al., 2019; Braams et al., 2021; Suzuki et al., 2016), we expected that participants make riskier choices after predicting and observing the choices of risk-seeking peers, and fewer risky choices when the peers are risk-averse.
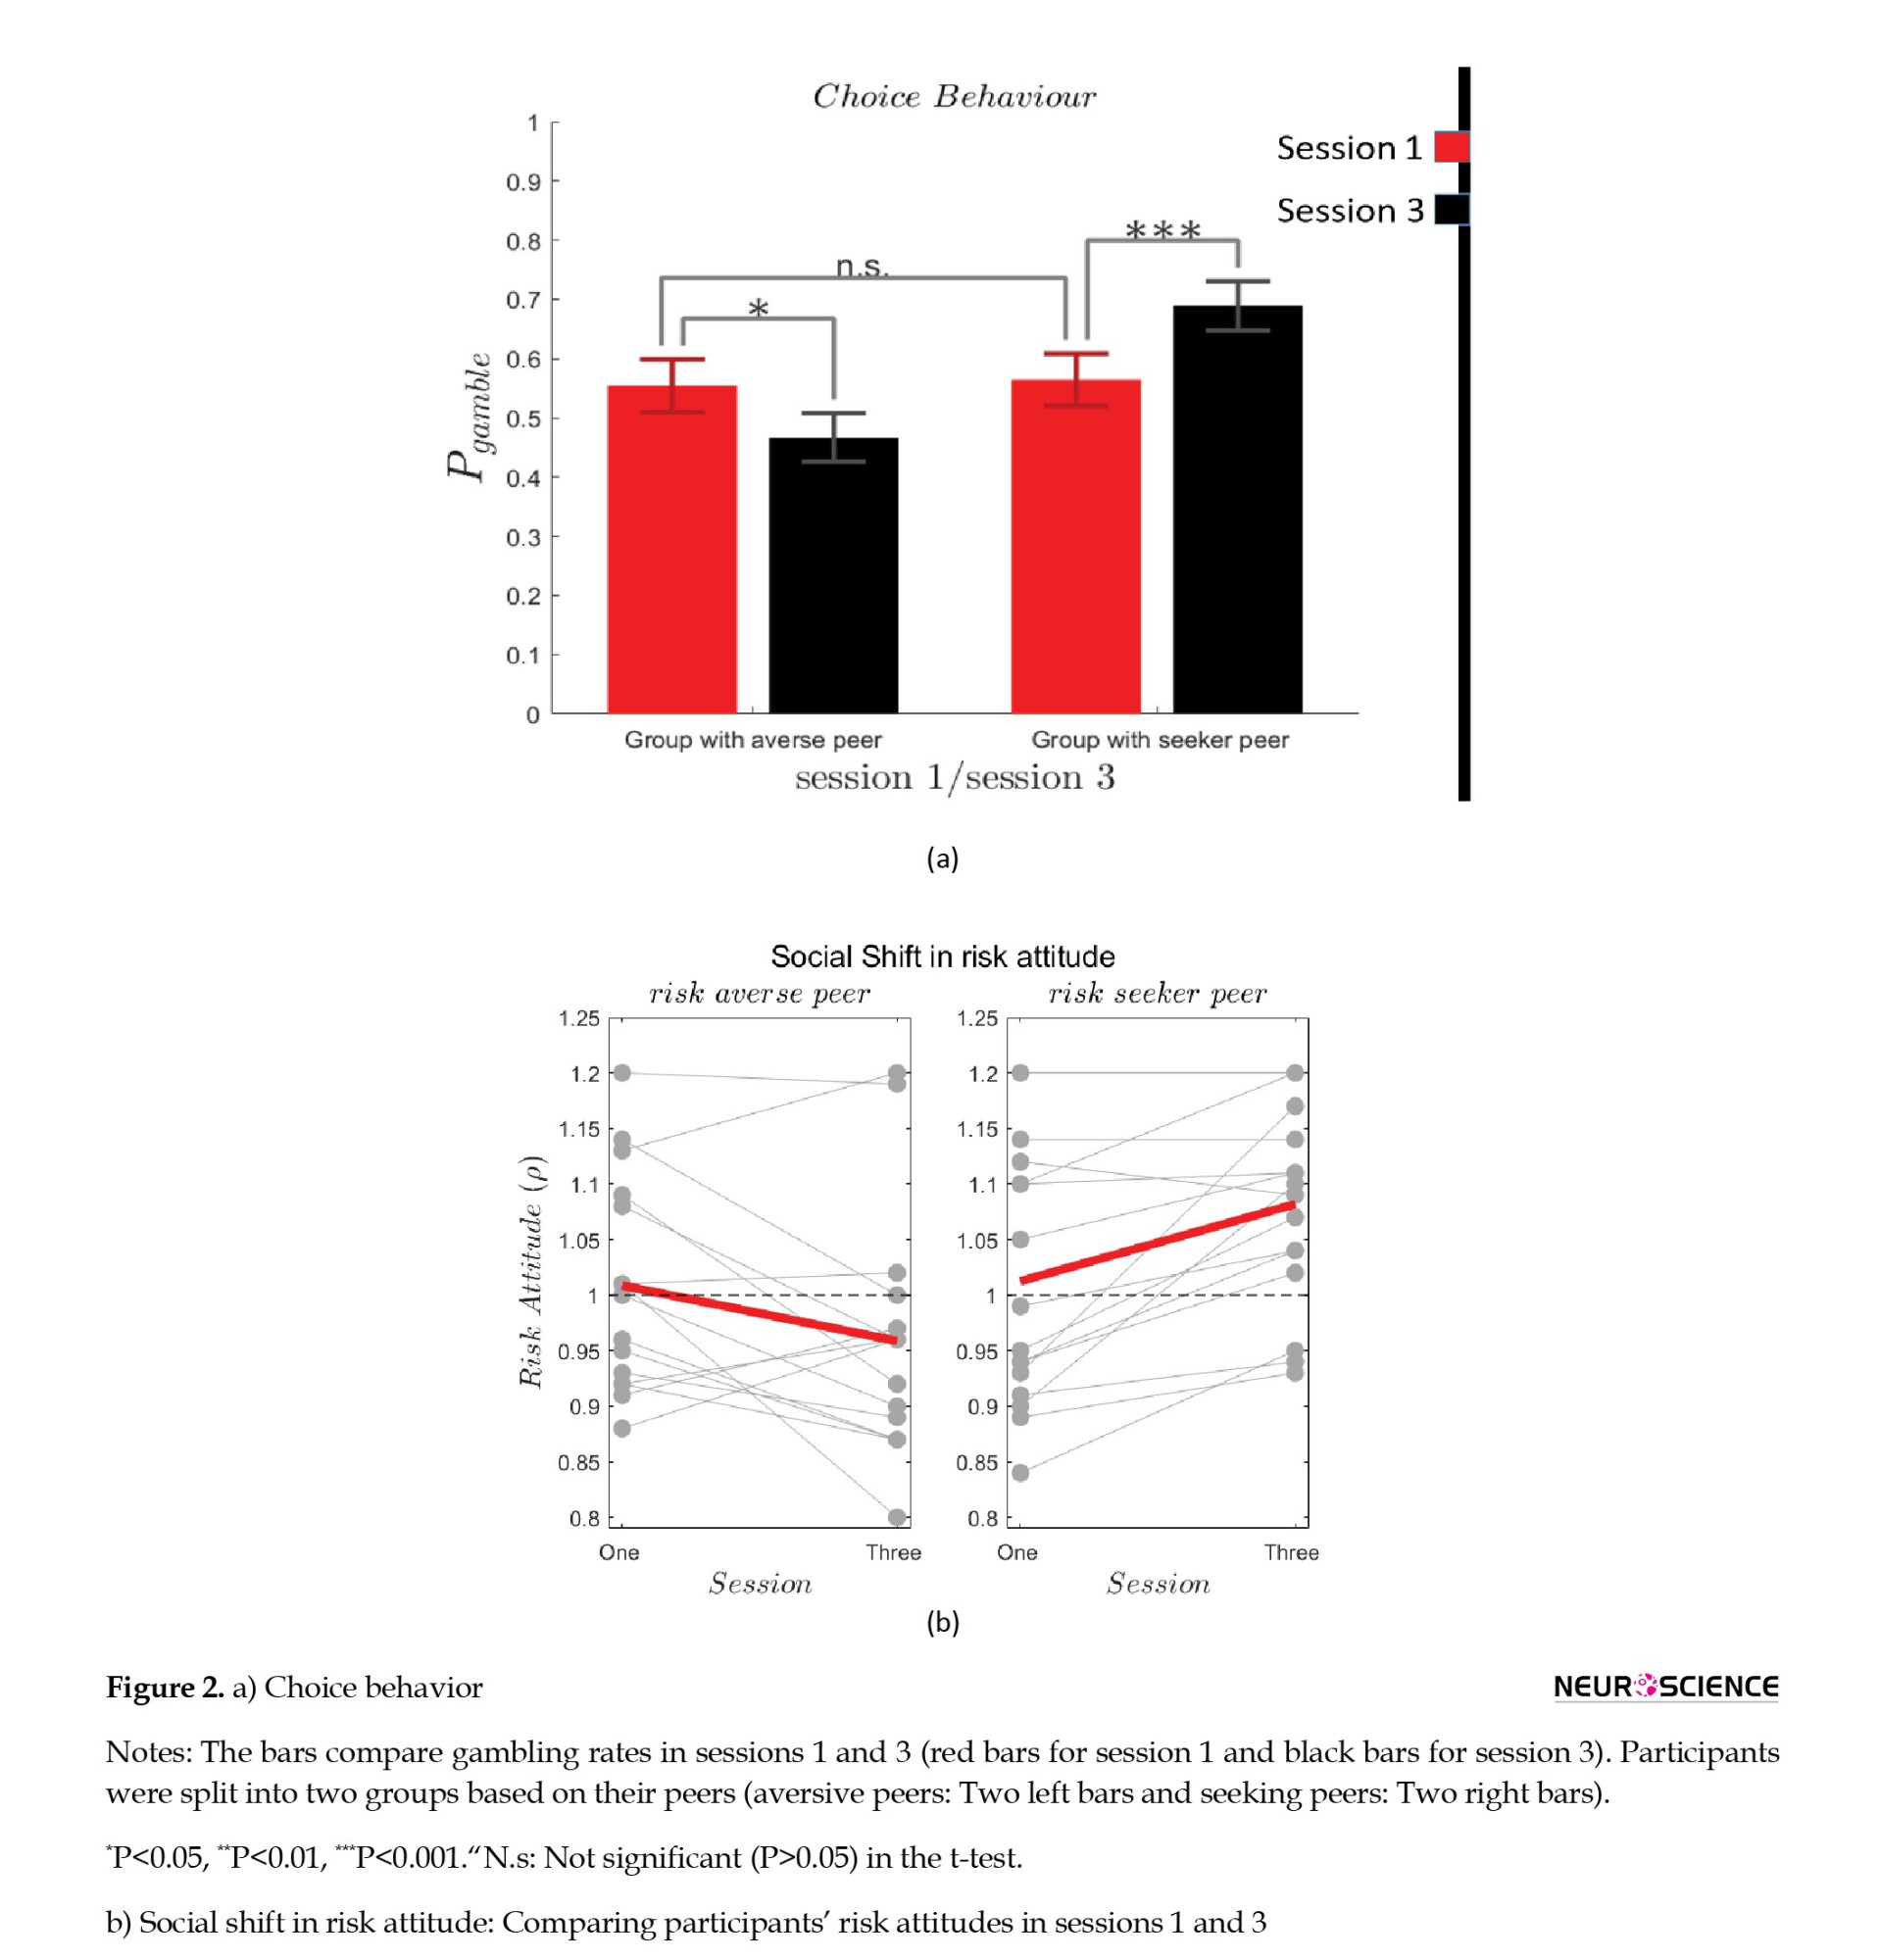
Participants who predicted risk-averse peers (n=15), selected the risky option in 55.4±17.8% of trials in session 1 (ranged=28-97) and in 46.7±16.4% of trials in session 3 (ranged=22-77). This result shows that after predicting risk-averse peers, participants selected gambling options significantly less than before (paired t-test: t=-2.17, df=14, and P=0.04). On the other side, participants who predicted risk-taker peers (16 participants), selected the risky option on 56.4±17.7% of trials in session 1 (ranged=31-88) and 68.9±16.6% of trials in session 3 (ranged=40-94), indicating that after predicting risk-seeking peers, they selected risky options significantly more than before (paired t-test: t=4.45, df=15, P=4×10⁻⁴ Figure 2a).
For both groups, Figure 2b compares the participants’ attitudes before (session 1) and after (session 3) the prediction session. As determined by the paired t-test, participants who predicted risk-averse peers in session 2, exhibited significant declines in their risk attitudes during session 3 (Mean±SD of changes -0.05±0.09, t=-2.13, df=14, and P=0.04). On the other hand, participants with risk-seeking peers exhibited a significantly higher level of risk attitudes in session 3 (Mean±SD of changes 0.07±0.07, t=3.72, df=15, and P=0.002).
To gain additional insight into participants’ behavior, we measured the degree of contagion, which is prevalent in similar studies (Reiter et al., 2019; Suzuki et al., 2016). Contagion occurs when someone conforms to his peer, which can be quantitatively expressed as follows (Suzuki et al., 2016) (Equation 1):
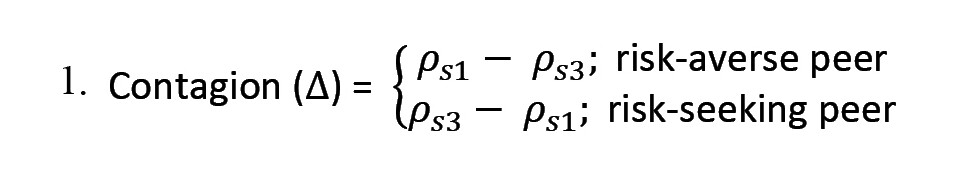
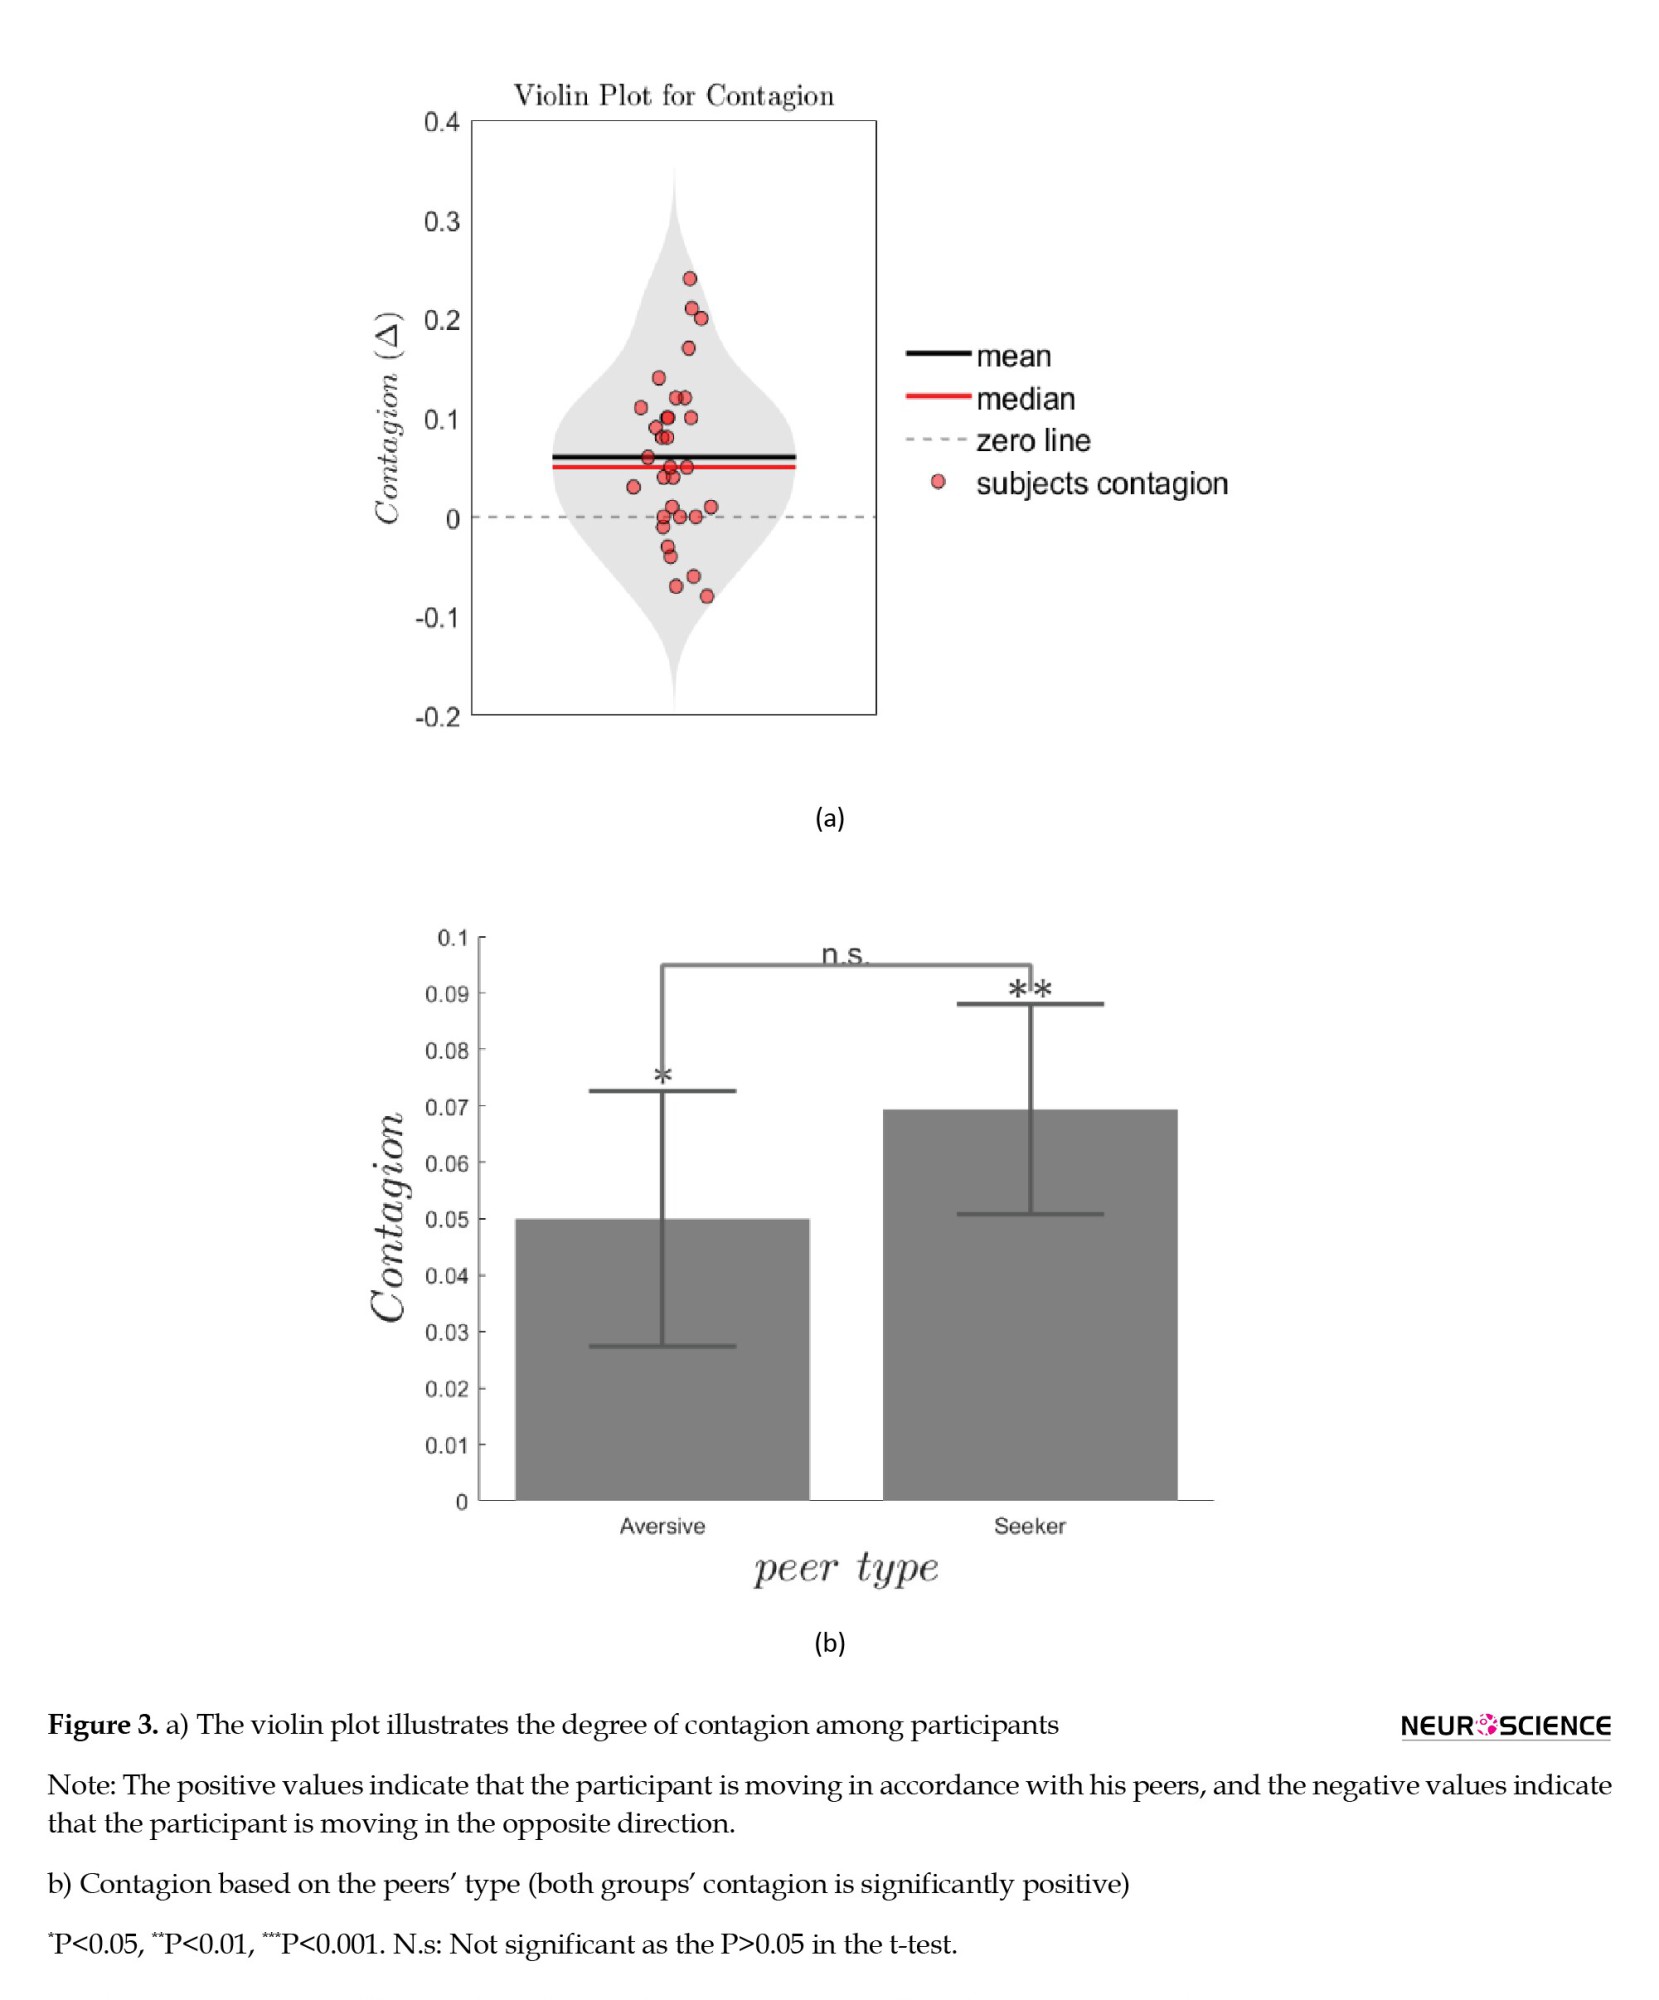
Figure 3a summarizes risk contagion within the samples. Among the majority of participants, the risk contagion value falls above the zero line. The risk contagion effect was found to be significantly positive among our participants (one-sample t-test against zero: ∆all=0.06±0.08, t=4.08, df=30, and P=3×10⁻⁴). On average, our adolescents adapt their risky behavior after observing their peers’ risky behavior.
Figure 3b illustrates the degree of contagion based on the peer’s risk attitude (aversive or seeking). Both groups were significantly affected by the contagion effect (group with aversive peers: t=2.14, P=0.04; group with seeker peers: t=3.7, P=0.002). As can be seen in Figure 3b, the average contagion effect for the group with the risk-seeking peer was stronger than the group with a risk-averse peer (∆aversive-peer=0.05 and ∆seeker-peer=0.07). However, a two-sample t-test between the two groups revealed no significant differences in the size of contagion (t=-0.65, df=29, and P=0.52). Further analysis revealed that the degree of contagion was not significantly correlated with the proportion of correct predictions in session 2 (P=0.19), implying that the contagion was not primarily triggered by predicting the peers’ choices.
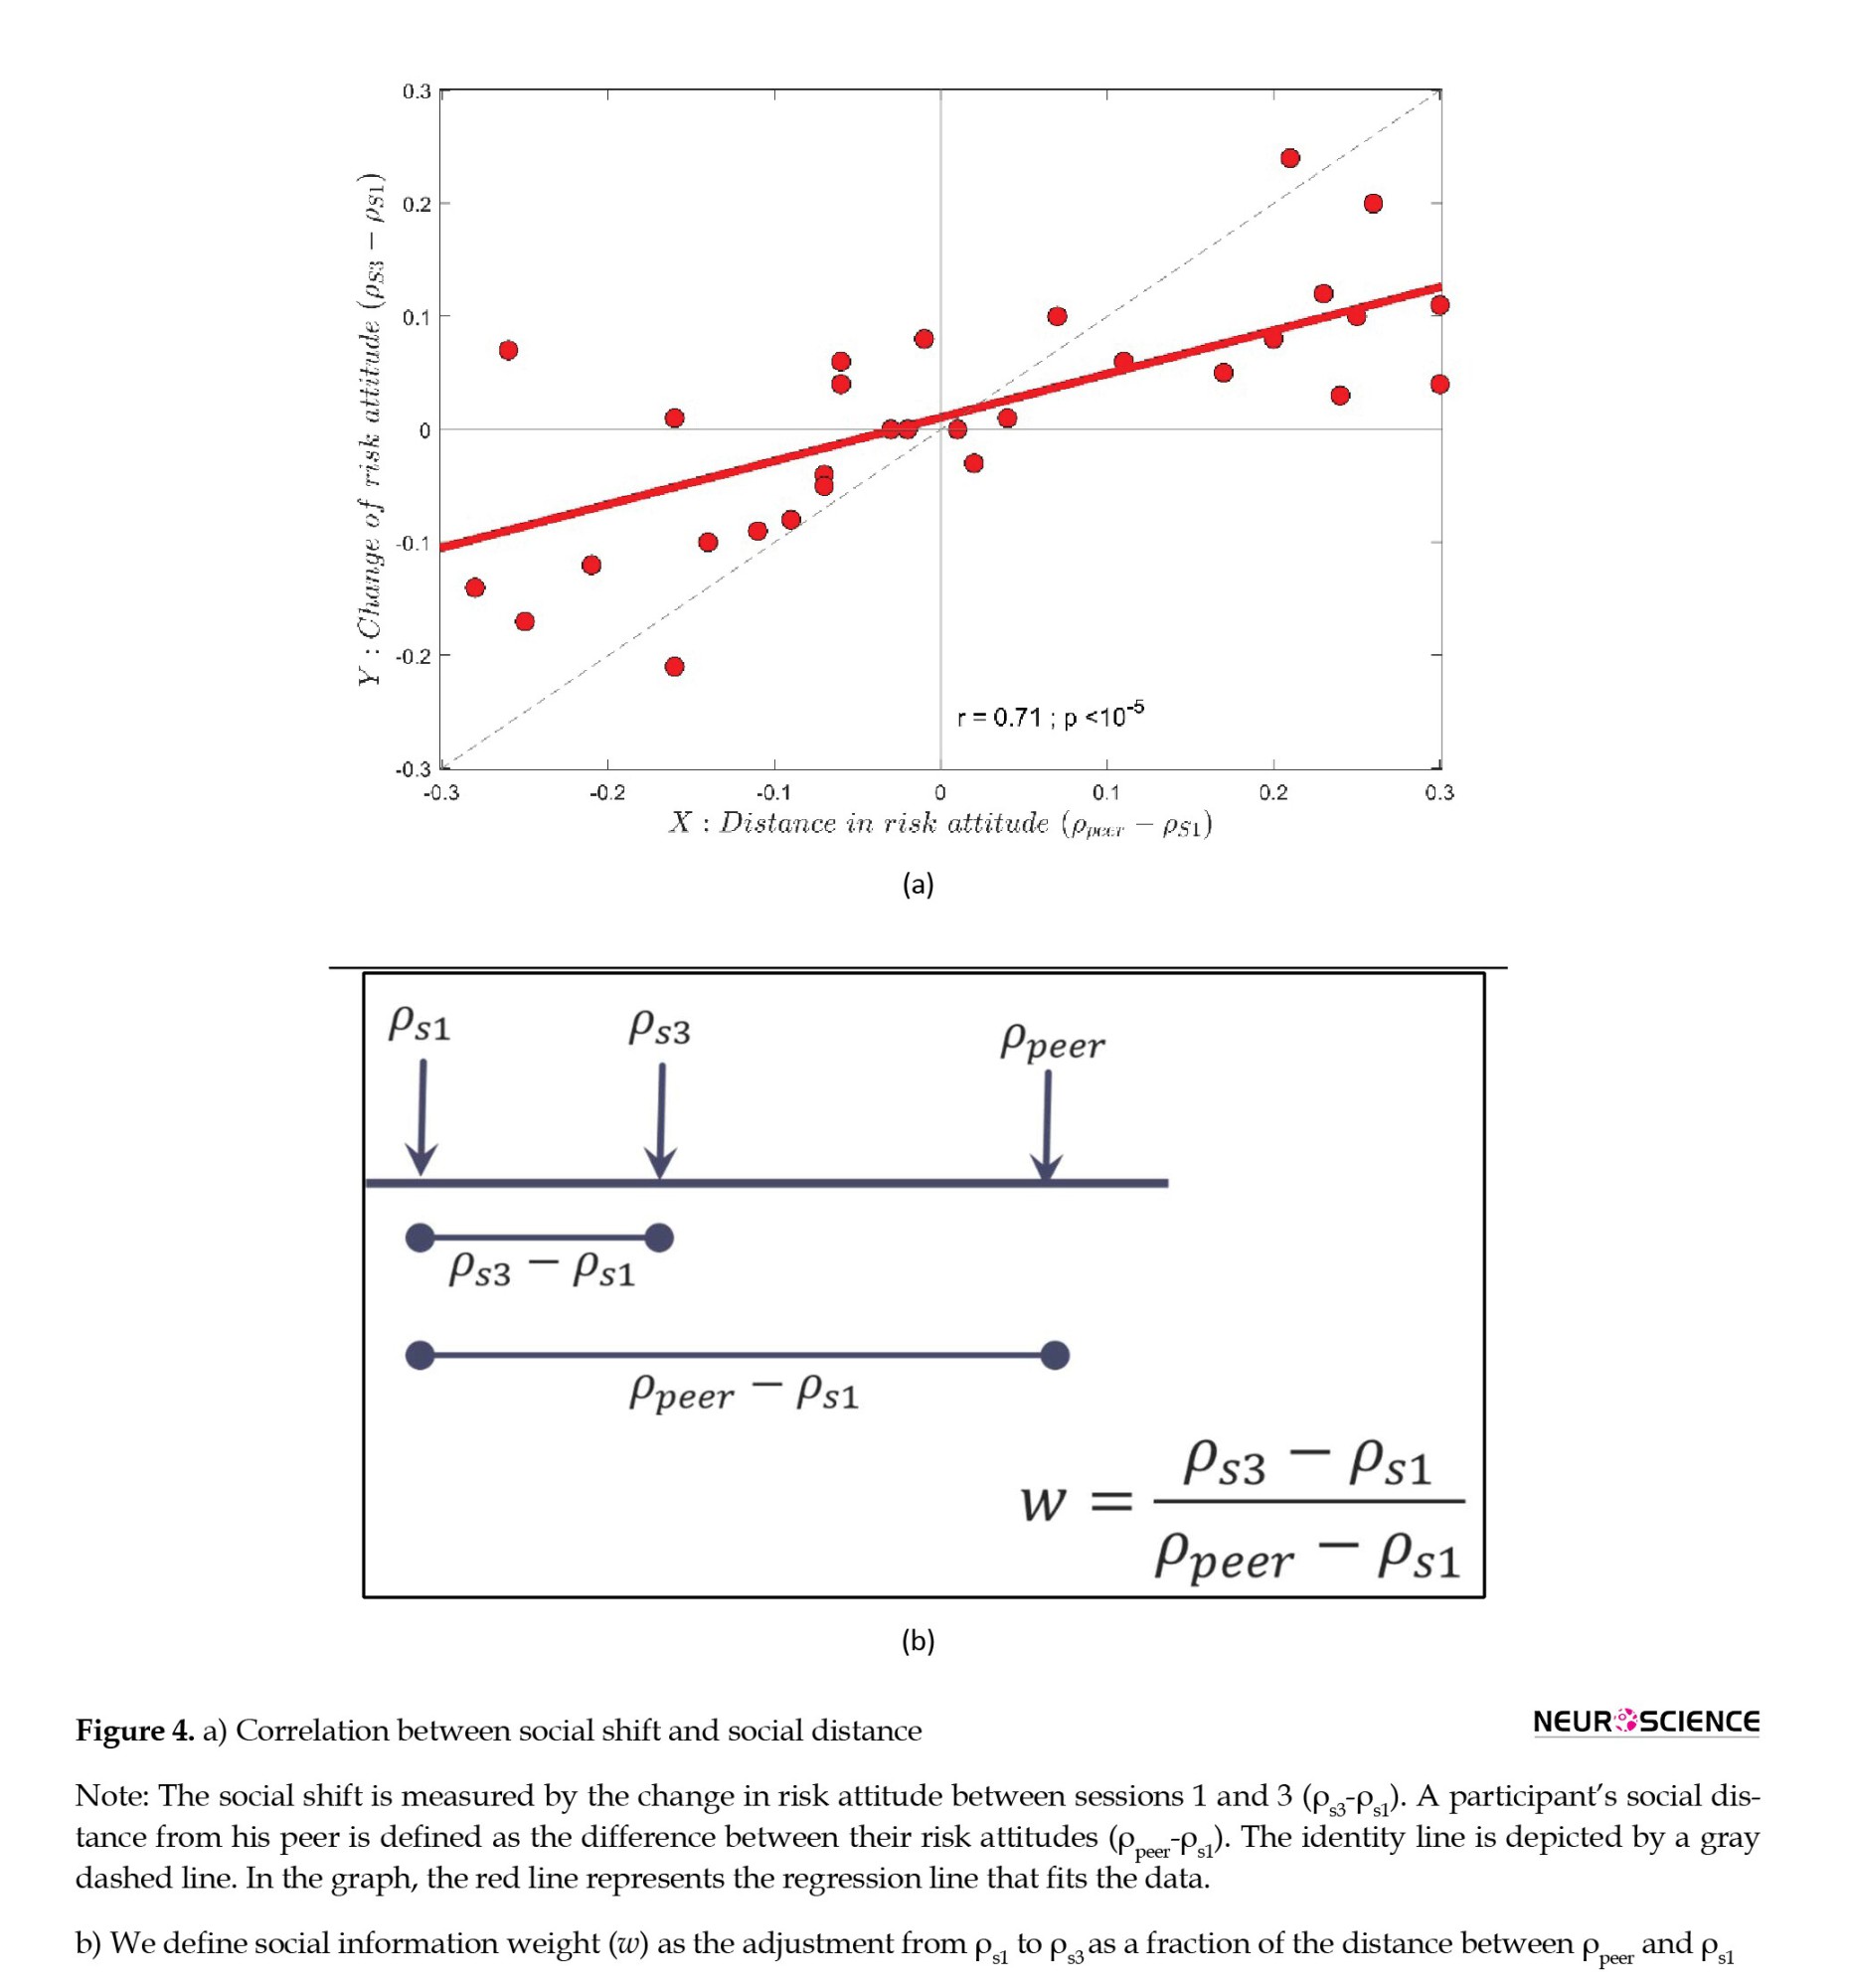
We observed that when early adolescents witness peers making risk-seeking or risk-averse choices, their own risk attitudes tend to increase or decrease, respectively. Here, we assessed whether the size of this social shift could be predicted by the difference between a participant’s risk attitude and that of their peer (social distance). Employing the formulation used in other studies (Molleman et al., 2019b; Molleman et al., 2022), the social distance is calculated by comparing the baseline risk attitude of a participant with that of his peer (Equation 2):
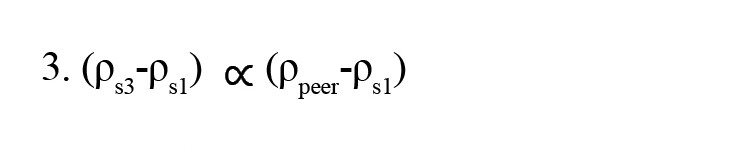
There is a strong correlation between this social shift (ρs3-ρs1) and the distance between the participant and his peer, (Pearson correlation, r=0.71, P<0.001; Figure 4a). The result shows that we can linearly relate the social shift to the social distance as follows (Equation 3):
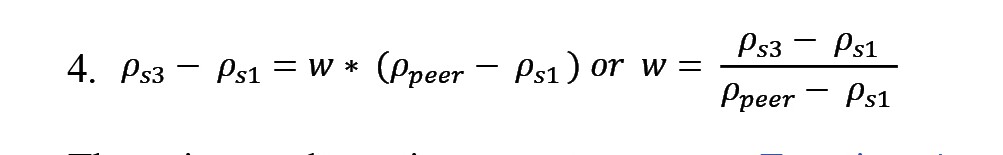
We fitted a generalized linear regression model to our data (y~1+x: x=ρo-ρs1, and y=ρs3-ρs1), which revealed that the intercept was not significant (intercept=0.01; P=0.43). As a result, our model no longer includes the intercept (Equation 4):
There is an alternative way to arrange Equation 4 where participants’ risk attitudes after observing peers (ρs3) can be represented as a weighting average of their baseline risk attitudes (ρs1) and their peers’ risk attitude (ρpeer) (Equation 5).
5. ρs3=w×ρpeer+(1-w)×ρs1
In Equations 4 and 5, w (social weight) represents how much weight a peer has in a participant’s view. The participant’s risk attitude after interaction lies somewhere between that of his peer and that of himself before the interaction. Figure 4b illustrates how ρs3 may vary depending on the amount of w. The higher w, the more similar the participant will become to his peer after acquiring social information. Participants with w=0 do not change according to social information, whereas those with w=1 conform fully to their peers’ behaviors. Participants who give the same weight to their own strategy and that of their peers are represented by w=1/2.
Assuming ρs1 and ρpeer form a convex combination, we fitted the model suggested in Equation 5 to the entire data set. Consequently, w was estimated to be 0.38. We also calculated w using the model-free estimation of risk attitude (see statistical analysis in the method section). The value of w was 0.33, which is approximately comparable to the value determined by the model-based approach. Taking the entire sample data into consideration, the results of the model-based and model-free approaches indicate that the social weight (w) lies between 0.3 and 0.4.
4. Discussion
In the present study, by combining an economical behavioral task with a computational modeling approach, we investigated how information in the social context influences risky behavior among early male teenagers.
In accordance with the literature, we demonstrated that boys’ risk attitudes shift when they become aware of their peers’ choices. We observed the risk contagion effect in teenagers as adolescents’ risk attitudes increase/decrease when they observe peers making risk-seeking/risk-averse choices. After learning about their peers, participants’ risk attitudes were formed based on their own baseline risk attitudes as well as their peers’ risk attitudes. Results showed that peer-biased shifts in risk attitudes correlate with the risk perspective gap between teenagers and their peers.
We confirmed previous studies (Blankenstein et al., 2016; Braams et al., 2021; Reiter et al., 2019; Suzuki et al., 2016), indicating that attitudes toward risk change after observing and learning about peers' risk attitudes during early adolescence. Consistent with these results, one incorporates information obtained from observing others into his decision-making process. We found that adolescents displayed significant changes toward their peers. Our results align with a recent study indicating that the risk contagion effect is more prominent among early adolescents, whereas older adolescents tend to prioritize their own preferences and beliefs (Molleman et al., 2022). Early adolescents might possess a less defined comprehension of moral values (Reiter et al., 2019), whereas older adolescents could exhibit a more certain grasp of these principles (Morgan et al., 2012). It is possible that the reported developmental trends in susceptibility to social influence are due to the decrease in randomness in decision-making as we age (Rodriguez Buritica et al., 2019). We checked for and excluded participants who made most of their choices randomly.
Risk contagion may be explained by a reward-sensitive motivational state induced by peers, which increases teenagers' likelihood of engaging in risky behavior (Reiter et al., 2019). In a recent meta-analysis comprising 59 fMRI studies on decision-making under risk in adolescents, it was found that adolescents, in contrast to adults, exhibited a stronger association with the right LPFC when opting for safe choices and a stronger association with the left insula and bilateral dorsal striatum when opting for risky choices. Nevertheless, adults exhibited a stronger association with the right mid-dACC compared to adolescents when making risky choices. This finding can be interpreted through the lens of prominent developmental theories of decision-making under risk, such as the dual-systems model (involving cognitive control and emotional arousal) and another theory that underscores alterations in cognitive strategies with maturation (van Duijvenvoorde et al., 2022; Zhang, 2022).
In adolescents, brain areas associated with cognitive control were less strongly recruited than in adults, but activity in the cognitive control system did not vary according to social context. Thus, adolescents may involve an imbalance between cognitive and affective systems (Chein et al., 2011; Steinberg, 2008). Although these studies suggest that peer effects on adolescents' decision-making are associated with impulsive behavior and enhanced reward-related activity, some results of the reaction time (RT) analysis contradict these findings (Reiter et al., 2019; Van Hoorn et al., 2017). Based on their results, peer presence (Van Hoorn et al., 2017) and social information (Reiter et al., 2019) did not simply facilitate decision-making, which is inconsistent with an impulsive reaction to risky peer behavior. According to these studies, risk contagion among teenagers involves a deliberate, socially motivated process. I To bolster this concept, research has shown that the risk contagion effect influences the neural encoding of risk in the caudate by interacting with the dlPFC, a region known for its role in thoughtful, purposeful decision-making and action planning in adults (Suzuki et al., 2016).
A prevalent belief regarding teenagers being inclined towards risk-taking behavior implies that they are more likely to be influenced by risk-seeking peers rather than risk-averse ones (Loke & Mak, 2013; WHO, 2012), potentially resulting in conformity towards riskier choices. Studies in this area seem to indicate that risk contagion in adolescents is specific to interacting with risk-seeking peers, not risk-averse peers (Chein et al., 2011; Reiter et al., 2019) or at least, teens who observed risk-seeking peers shifted more than teens who observed risk-averse peers. There are, however, some teens who have pronounced risk-averse preferences (Braams et al., 2021; Chein et al., 2011) and it turns out that nearly half of our sample was risk-averse. Moreover, our results revealed that in spite of a stronger contagion effect for the group with a risk-seeking peer, the size was not significantly different. Taking into account the findings of our study, we conclude that risk contagion in early adolescents is a bidirectional effect that does not solely trigger risk-seeking activities but can also help prevent risky behavior.
In addition, as we explored in more detail, social differences in risk attitudes were positively correlated with peer-biased risk contagion. Teens' risk attitudes change proportionally to the gap between their peers and their own, with about 30-40% of the gap vanishing when they learn about their peers' choices. Susceptibility to peer influence appears to be an adaptive process that is associated with a greater sense of interpersonal connection. Interestingly, in real life, social information may also affect individuals based on their position in their social network.
An analysis of a large sample of participants showed that their behavior changed about 1/3 of the distance towards the observed social information after receiving advice (Mollema et al., 2019b). Another recent study conducted on adolescents aged 11 to 15 years, based on a simple estimation task, demonstrated that social information has a strong effect on behavior. In this task, the average adjustment when observing a peer was 43% (Molleman et al., 2019a).
The relationship between social integration and real-life behavior in the domain of risk is yet to be investigated. Peers impact almost all aspects of adolescents' lives, from taste in music and clothing to the more serious, such as the use of illicit drugs or engaging in unprotected sex (Loke & Mak, 2013; Steinberg, 2008). Thus, understanding social influences on adolescent risk-taking behavior is valuable for preventing maladaptive behaviors and disease (Reiter et al., 2017; WHO, 2012). Long-term running with the wrong crowd can adversely affect people's health, education, social and economic success, and general well-being (WHO, 2012). Recent studies, however, indicate that peers may also promote prosocial behavior and reduce risk-taking (Ahmed et al., 2020; Chierchia et al., 2020; Molleman et al., 2022). The results of a recent study suggest that children and adolescents are more likely to be positively influenced by peers in the domain of prosocial decision-making than older individuals (Foulkes et al., 2018). However, more research is needed in this area. It would be useful to examine how peer relationships affect learning and decision-making within social networks in future studies. Understanding how peers promote and shape positive behavior requires understanding how behavior, social learning, and network formation interact.
Because of budgetary constraints, we were limited to a sample size of 38 participants, but our power analysis revealed that this was sufficient to draw conclusions about the overall dataset. However, the sample size of 15-16 used for in-group analysis may not be adequate for generalizations. Nonetheless, the results of each group can still provide valuable insights that can be used to explore risk contagion further. In addition, studies similar to ours have conducted intra-group or auxiliary analyses using a small sample size; for example, Suzuki et al., (2016) utilized a total sample size of 24, with some of the auxiliary analyses conducted on 12 participants.
Lastly, like most studies in this field (Braams et al., 2021; Suzuki et al., 2016; Van Hoorn et al., 2017), we restricted our sample to male participants. The purpose of this was to avoid the confounding effect of baseline differences in risk-taking that might be associated with differences in pubertal trajectory between boys and girls. For future studies, it is advisable to incorporate lifespan samples from both genders to assess the generalizability of the findings.
As a topic for future research, it is theoretically interesting to investigate the integration of information from different sources when parents and peers exert opposing influences. Exploring how individuals’ confidence in their own judgment impacts their utilization of social information presents an intriguing avenue for research. Additionally, longitudinal and cross-sectional studies can offer valuable insights into the roots and progression of social learning.
5. Conclusion
Our study shed new light on the use of social information by adolescents in making risky decisions. Peer-provided social information was highly used by adolescents. The data showed that these peer-biased changes in risk attitudes are proportional to the gap between teenagers and their peers’ risk perspectives. According to the results, their perspectives began to align closer after receiving the information, and approximately 30-40% of the gap was eliminated. A difference in teens’ risk attitudes before they communicate does not appear to be causally correlated with social risk contagion. However, it is possible to argue that this shift is part of an adaptive process involving social integration.
Ethical Considerations
Compliance with ethical guidelines
The research was approved by the SCS Research Ethics Committee of the Institute for Research in Fundamental Sciences (IPM) (Code: SCS. REC: 1401/60/1/618).
Funding
The paper was extracted from the PhD dissertation of Amir Hossein Tehrani-Safa, approved by Institute for Cognitive and Brain Sciences, Shahid Beheshti university.
Authors' contributions
Conceptualization, methodology, review and editing: Amir Hossein Tehrani-Safa, Atiye Sarabi-Jamab; Investigation: Amir Hossein Tehrani-Safa and Mohammad Herasat; Validation: AmirHossein Tehrani-Safa and Atiye Sarabi-Jamab; Supervision and project administration: Reza Ghaderi and Atiye Sarabi-Jamab; Resources: Atiye Sarabi-Jamab; Visualization, software and formal analysis: Amir Hossein Tehrani-Safa; Writing the original draft: Amir Hossein Tehrani-Safa, Mohammad Herasat and Atiye Sarabi-Jamab.
Conflict of interest
The authors declared no conflict of interest.
References
Risk-taking behaviors can be observed in various contexts, from extreme sports and gambling to drug use and unprotected sex. Teenage years are associated with increased risk-taking behavior (Steinberg, 2008). For instance, when it comes to financial matters, teenagers may venture into risky investments in the stock market or cryptocurrency without proper guidance. Another example is spending money on expensive electronics, such as smartphones and gaming consoles. Peer influence is a powerful force in the lives of teenagers, particularly in the digital age when they are exposed to social media (Valkenburg et al., 2022). These influences play a crucial role in their decision-making processes. Teenagers frequently look to their peers for guidance on clothing, music preferences, and behavior. Peer influence can have both positive and negative impacts (Molleman et al., 2022). Positive peer influence can encourage teenagers to make good choices, such as abstaining from drugs and alcohol, while negative peer influence can lead them to engage in risky behaviors, such as smoking or skipping school.
Smoking and drinking alcohol are more prevalent among adolescents when they are in the company of peers, and having friends who smoke and drink is a predictor of their substance use (Andrews et al., 2002; Loke & Mak, 2013). Laboratory studies have demonstrated that adolescents engage in riskier behaviors when interacting with peers compared to when they are alone (Albert et al., 2013; Blankenstein et al., 2016; Gardner & Steinberg, 2005).
Some studies have found that contextual factors affect whether and how peer presence influences decision-making. Teenagers may engage in risky behaviors in the presence of peers if they believe it will enhance, protect, or reinforce their social relationships (Somerville et al., 2019). Evidence from humans and animals suggests that the presence of others may increase the value of non-social rewards (Foulkes & Blakemore, 2016). Adolescents are more susceptible to peer influence and are more prone to risky behavior, so peer presence theoretically has a greater impact on risky behavior among adolescents than among adults (Gardner & Steinberg, 2005). Although adolescents can evaluate the risks and consequences of their behavior, being with peers can prompt them to exhibit risk-taking behaviors (Smith et al., 2014).
Observing and learning from others’ risk-related decisions can also influence individuals to change their risk preferences, a phenomenon known as risk contagion (Reiter et al., 2019; Suzuki et al., 2016). When a participant mimics the decision of their peer, the degree of contagion is positive. For instance, if a colleague takes a risky investment, the participant is likely to follow the same manner. Conversely, if the partner chooses a risk-averse option, the participant is inclined to do the same.
Recent studies have shown the effect of contagion when we have information about others’ risk-related choices (Suzuki et al., 2016). Similar to adults, this kind of social stimulus affects adolescents as well (Braams et al., 2021; Reiter et al., 2019). Adolescents tend to adjust their behavior to align with that of their peers. They utilize peers as a source of information and can adapt their behavior through peer-to-peer observations (Reiter et al., 2019). In adolescents, observing peers’ gambling choices changes the subjective value of those gambles (Blankenstein et al., 2016). In a recent study on adolescents (Braams et al., 2021), participants observed the gambling choices of peers in some experimental trials. It was observed that this observation influenced adolescents’ subjective values of peer-selected choices. This change is better characterized by a shift in risk attitude rather than a simple social bias towards or against the utility of gambling choices (Suzuki et al., 2016).
We designed an experiment to examine how social learning influences risk attitudes in early adolescents. Our experimental design was as follows: In the first session (self-phase), participants made choices between a sure option and a risky variable option. This was followed by the second session (prediction session), where they predicted the choices of a hypothetical participant and immediately received feedback on the accuracy of their predictions. Participants performed the self-evaluation phase for a second time in the final session (session three) after the prediction session.
Our analysis comprises two main steps: Firstly, we examined whether attitudes toward risk shift after early adolescents learn about their peers’ risk attitudes (measuring the contagion effect). The second step involved formulating participants’ risk attitudes after learning about their peers as a function of their baseline risk attitudes and those of their peers. We calculated the relative distance between participants and their peers and represented participants’ risk attitudes after seeing their peers as a weighted average of their baseline risk attitude and their peers to determine how much social information is weighted by the adolescents. Using this method, we can quantify how individuals integrate their personal risk attitudes with their peers’ attitudes in a weighted average model. This method, which has recently been applied in studies involving perceptual decision-making tasks (Molleman et al., 2019b; Molleman et al., 2020, Molleman et al., 2022), allows participants to revise their initial estimates after seeing what another person estimates.
2. Materials and Methods
Sample
To determine the appropriate sample size, we conducted a power analysis. Using the effect size of the contagion in risk attitude from a recent study (effect size: d=0.58) (Suzuki et al., 2016), and considering a significance level α=0.05, the power analysis indicated that a total sample size of N=27 would ensure a power >0.90. We recruited 38 middle school male students aged 12-15 years (Mean±SD age 13.18±0.48, median age=13). Data collection was restricted to male participants, consistent with previous research (Reiter et al., 2019), due to differences in pubertal development trajectories between female and male adolescents, as well as evidence of baseline gender differences in risk preferences (Byrnes et al., 1999).
Before the experiment, participants completed a demographic form, which included questions about recent psychiatric disorders. According to their self-reported responses, none of them had received a recent psychiatric diagnosis.
Participants and their parents signed an informed consent form. The research was approved by the SCS Research Ethics Committee of the Institute for Research in Fundamental Sciences (IPM).
Procedure and task
The experiment consisted of three sessions, with each session presenting 35 trials to each participant. The first and third sessions aimed to evaluate the participants’ level of risk attitude. Termed the “self-phase,” these sessions required participants to choose between accepting or rejecting a gambling offer in each trial. Participants were informed that if they rejected the offer, they could receive a guaranteed amount of money (30 TT; Thousand Iranian Tomans, at the time of the experiment, 1$ was equal to 4.2 TT). However, if they accepted the offer, they could enter the gamble at the end of the game. The amount of money involved in the gambling offer for all trials exceeded 30 TT to ensure participants would not choose it if it were lower than the guaranteed money (30 TT).
To prevent potential influences of reward feedback on their decision-making process, the outcome of the gamble was not revealed to participants in each trial. At the end of the experiment, one choice was randomly chosen and implemented as part of the payment procedure (refer to payment procedure for further details). Given that participants did not know which trial would be selected, all trials were treated equally, as if they were the only ones.
Consistent with recent developmental studies (Blankenstein et al., 2016; L van Leijenhorst, 2006; Shad, 2011; Van Den Bos & Hertwig, 2017), we used wheels of fortune to visualize gambles. For each gambling offer, the chances of winning and the amount of money the participants could earn were shown on a pie chart, and they were asked to accept or reject the offer using the right and left arrow keys on the keyboard. The pie chart shown to the participants consisted of a blue area showing the probability of winning, and inside the blue area, they could see the amount of gambling money (Supplemental information on the task and the experimental procedure and Figure S.1).
This type of stimulus is frequently used in developmental research to illustrate probability to adolescents who have recently begun to grasp the concept of probability (Figure 1a).
To identify the misleading data of inattentive participants, two trials were included in each self-session with a 100% chance of winning. The amount of reward offered by risk-free gambles is higher than the sure payoff. Accordingly, economic rationality dictates that participants should always prefer the risk-free gamble to the sure option regardless of their risk attitude. If a participant rejected both trials, that data was considered invalid. In the second session, known as the “prediction phase,” the second round of 35 trials was conducted. During this session, the participants were asked to predict the choices made by their peers, and then, the computer would give them feedback on the correctness of their predictions (Figure 1b). Throughout the instruction, they were informed that one of their peers had played the game before, and their data were recorded. In reality, the data shown to the participants were generated by a computer algorithm (Supplementary material: Computational model of decision-making under risk section for details of the algorithm) and exhibited two patterns of risk-taking or risk-averse behavior. Each participant was randomly assigned to one of these patterns, assuming that it was the data from their peers, and trying to guess the pattern and predict their answer. During the experiment, none of the participants doubted that the peer choices were real. The simulated risk-seeker peers chose gambles in 80±3% of trials (ranged 77–86%), whereas the simulated risk-averse peers chose gambles in 19±2.5% of trials (ranged 14–23%).
Before starting the actual experiment, the participants went through a training phase where they experienced three trials similar to the self-phase of the experiment and three trials similar to the prediction phase. Then, they proceeded to the actual experiment. To avoid tiredness and its possible effects on participants’ choices, the participants were allowed to rest a while between the sessions and then continue the game by pressing a random key. This was reminded to them after they finished each session.
Payment procedure
The reward calculation process consisted of two parts: one for self-trials and one for prediction trials. The payment process for self-sessions was as follows: The computer randomly selected one trial from sessions 1 and 3 and displayed it along with the participant’s choice. Participants who accepted the offer on that trial were required to provide a number between 1 and 100. Depending on the chances of winning in that gambling offer, a given percent of these numbers were marked as “win,” and the rest were labeled “lose.” If the bet numbers given by participants were labeled as “win,” they won the offer and received their reward. Participants who chose not to accept the offer on the selected trial were also given a certain amount of 30 TT.
The computer also randomly selected one of the trials for the prediction session. An additional 30TT was awarded if the participant’s prediction on that trial was correct. Based on the protocols for an experiment involving early adolescents, we are unable to pay cash directly to the participants. Accordingly, we summed up each participant’s scores over the course of the experiment and awarded them a prize equal to the sum of those scores.
Statistical analyses
Two different measures were used to assess risk attitude (model-based and model-free methods). To derive a parameter representing the participant’s risk attitude based on our model-based method, we fitted an exponential utility function to the participants’ choices. Detailed information on exponential utility functions and model fitting can be found in the Supplementary material: Computational model of decision-making under risk. A model-free measure of participants’ risk preferences is the proportion of gambles accepted compared to the (hypothetical) proportion acceptable to a risk-neutral agent (Reiter et al., 2019; Suzuki et al., 2016). A risk-neutral agent chooses whether or not to gamble by comparing the expected reward of the gamble (the probability times the magnitude of the reward) with the value of a safe option.
In the prediction trials, participants predicted the choices that the peer made and immediately received feedback on the correctness of their predictions. The performance in prediction could be interpreted as a way to assess how well participants had learned about their peers’ behaviors. We measured the percentage of correct guesses as participants’ performance in the prediction phase.
We divided the prediction session, which consisted of 35 trials into four parts: Train trials, early trials, middle trials, and late trials. This allowed us to gain a deeper understanding of participants’ prediction behavior. The first five trials constitute the train part, and the remaining parts each consist of 10 trials. We assumed performance at prediction as being significantly free of chance if the proportion of correct predictions is larger than the specified threshold.
To calculate this threshold, we employed the method introduced by Steffens et al. (2020), which involved retaining the first five trials (train trials) and calculating the threshold based on the subsequent 30 trials. Thus, in this context, if the observed performance exceeded 63.3%, it could be reasonably assumed that the performance was significantly above chance levels (Steffens et al., 2020).
From the initial 38 participants, seven were excluded from the final analysis. One participant was eliminated due to providing an incorrect response during the risk-free trials, indicating a lack of attention to the task procedure. Two further participants were excluded due to their prediction performance falling below the chance threshold in the prediction session, suggesting that they did not learn their peers’ choices efficiently. Additionally, following a model-based analysis, it was determined that four participants made the majority of their decisions randomly, and thus, their data were removed from further analysis. Ultimately, the data from the remaining 31 participants were used for analysis.
Data analysis was conducted using MATLAB software (2017; The Mathworks, Natick, MA). Common statistical analyses, such as Pearson’s linear correlation and t-tests, were performed using the “statistics and machine learning toolbox functions.” Linear models were constructed using the “fitglm” and “lsqlin” functions. Risk attitudes were extracted using the maximum likelihood method, wherein choices from each self-session were fitted using the “fmincon” function with the SQP search algorithm. To determine the sample size for the current study, we conducted power analysis in G*Power software, version 3.1 (Faul et al., 2007).
3. Results
We assessed the participants’ risk attitudes at baseline, reflecting their attitudes toward risk before exposure to social influence (Figure 1). This was achieved by fitting a computational model of decision-making under risk to the choice data collected from each participant in the first session (Supplementary material: Computational model of decision-making under risk).
Contrary to previous studies on adolescence (Blankenstein et al., 2016; Reiter et al., 2019; Tymula et al., 2012), risk aversion did not seem to be a common characteristic among the samples (Figure S3). Based on the computational model, participants’ risk attitudes in session 1 (ρs1) ranged between 0.84 and 1.20 (ρs1 Mean±SD 1.01±0.10, median=0.99), reflecting a broad range of risk aversion and risk-taking behaviors. There are roughly equal proportions of risk-seekers and risk-averse participants in the sample (14 participants were risk-seekers (ρs1>1), 16 were risk-averse (ρs1<1), and one was risk-neutral (ρs1=1)). Furthermore, participants who predicted and observed risk-averse peers have no distinct baseline risk attitudes from those who predicted and observed risk-seeking peers (two-sample t-test, t=-0.1, df=29, and P=0.92).
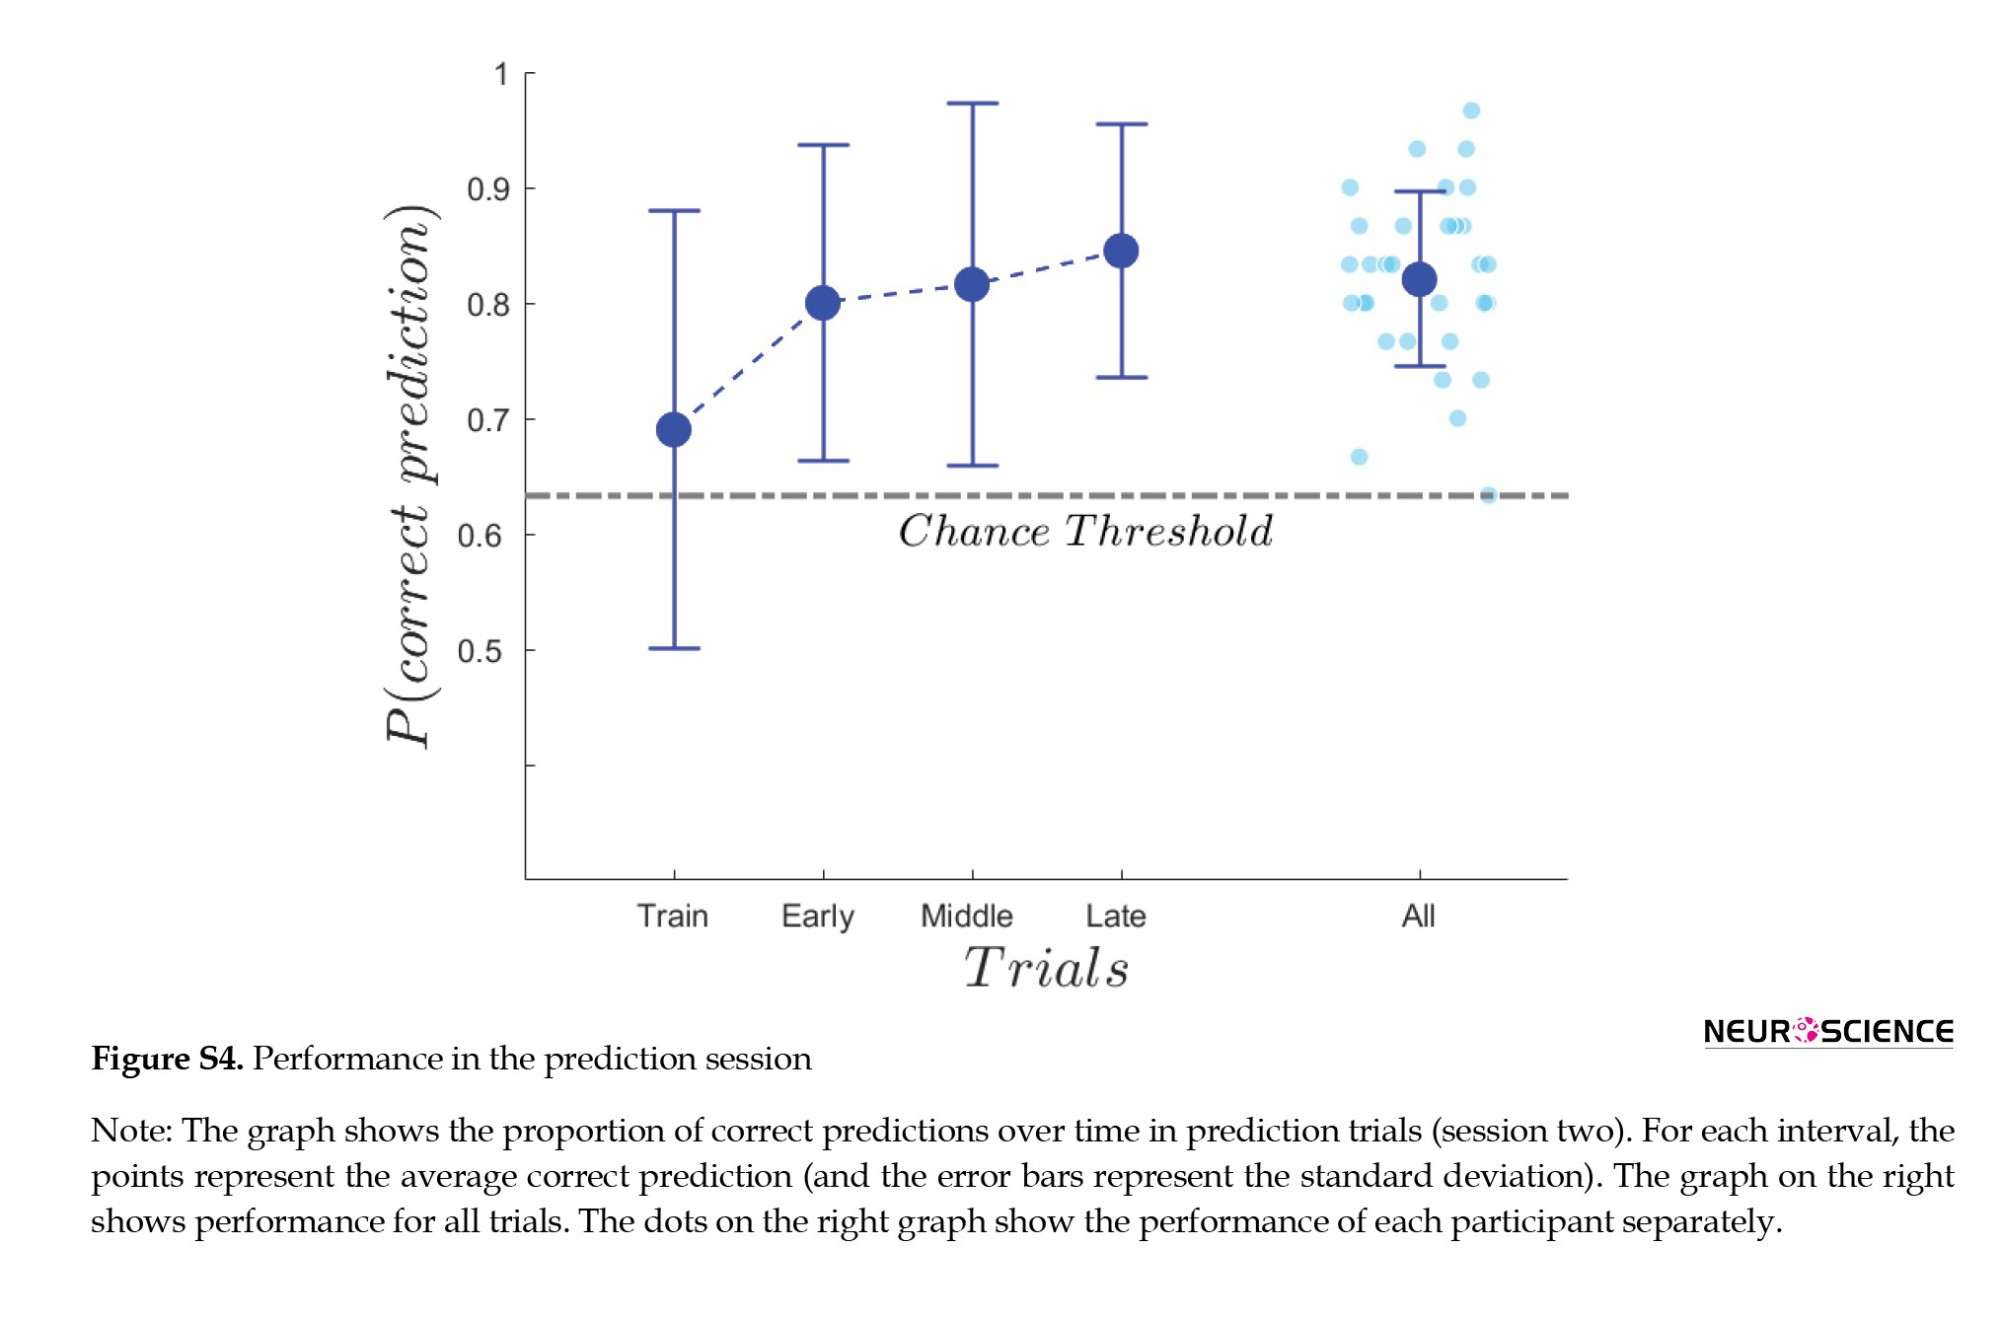
Participants showed high performance during the prediction phase, which indicates that they successfully learned their peers’ risk behavior (Mean±SD 82%±8%, range: 63%-97%) (Figure S4). The data from the two participants with unsatisfactory prediction performance were not taken into account because their prediction performance was lower than the chance threshold (63.3%) in the prediction session.
A prediction session with 35 uninterrupted trials was conceptually divided into four parts. In the beginning, participants were not familiar with the data and therefore, their performance was below the chance threshold. However, as the session went on, they started to identify patterns and make more accurate predictions because they had more time to become familiar with the data and the emerging patterns, allowing them to better understand the data and make more accurate predictions.
Despite performing below chance in the first five trials (train trials), the subsequent ten trials (early trials) showed remarkable progress (performance in the early part: Mean±SD 80±14%, t=6.68, df=30, and P<10-5). On average, the early part performance was 11% higher than the train part. Then, the average proportion of correct predictions remained above 80% (middle and late parts). It ensured that the quality of prediction remained in the acceptable range until the end of the prediction phase, despite potential factors, such as lack of attention.
In line with previous studies (Braams et al., 2019; Braams et al., 2021; Suzuki et al., 2016), we expected that participants make riskier choices after predicting and observing the choices of risk-seeking peers, and fewer risky choices when the peers are risk-averse.
Participants who predicted risk-averse peers (n=15), selected the risky option in 55.4±17.8% of trials in session 1 (ranged=28-97) and in 46.7±16.4% of trials in session 3 (ranged=22-77). This result shows that after predicting risk-averse peers, participants selected gambling options significantly less than before (paired t-test: t=-2.17, df=14, and P=0.04). On the other side, participants who predicted risk-taker peers (16 participants), selected the risky option on 56.4±17.7% of trials in session 1 (ranged=31-88) and 68.9±16.6% of trials in session 3 (ranged=40-94), indicating that after predicting risk-seeking peers, they selected risky options significantly more than before (paired t-test: t=4.45, df=15, P=4×10⁻⁴ Figure 2a).
For both groups, Figure 2b compares the participants’ attitudes before (session 1) and after (session 3) the prediction session. As determined by the paired t-test, participants who predicted risk-averse peers in session 2, exhibited significant declines in their risk attitudes during session 3 (Mean±SD of changes -0.05±0.09, t=-2.13, df=14, and P=0.04). On the other hand, participants with risk-seeking peers exhibited a significantly higher level of risk attitudes in session 3 (Mean±SD of changes 0.07±0.07, t=3.72, df=15, and P=0.002).
To gain additional insight into participants’ behavior, we measured the degree of contagion, which is prevalent in similar studies (Reiter et al., 2019; Suzuki et al., 2016). Contagion occurs when someone conforms to his peer, which can be quantitatively expressed as follows (Suzuki et al., 2016) (Equation 1):
Figure 3a summarizes risk contagion within the samples. Among the majority of participants, the risk contagion value falls above the zero line. The risk contagion effect was found to be significantly positive among our participants (one-sample t-test against zero: ∆all=0.06±0.08, t=4.08, df=30, and P=3×10⁻⁴). On average, our adolescents adapt their risky behavior after observing their peers’ risky behavior.
Figure 3b illustrates the degree of contagion based on the peer’s risk attitude (aversive or seeking). Both groups were significantly affected by the contagion effect (group with aversive peers: t=2.14, P=0.04; group with seeker peers: t=3.7, P=0.002). As can be seen in Figure 3b, the average contagion effect for the group with the risk-seeking peer was stronger than the group with a risk-averse peer (∆aversive-peer=0.05 and ∆seeker-peer=0.07). However, a two-sample t-test between the two groups revealed no significant differences in the size of contagion (t=-0.65, df=29, and P=0.52). Further analysis revealed that the degree of contagion was not significantly correlated with the proportion of correct predictions in session 2 (P=0.19), implying that the contagion was not primarily triggered by predicting the peers’ choices.
We observed that when early adolescents witness peers making risk-seeking or risk-averse choices, their own risk attitudes tend to increase or decrease, respectively. Here, we assessed whether the size of this social shift could be predicted by the difference between a participant’s risk attitude and that of their peer (social distance). Employing the formulation used in other studies (Molleman et al., 2019b; Molleman et al., 2022), the social distance is calculated by comparing the baseline risk attitude of a participant with that of his peer (Equation 2):
There is a strong correlation between this social shift (ρs3-ρs1) and the distance between the participant and his peer, (Pearson correlation, r=0.71, P<0.001; Figure 4a). The result shows that we can linearly relate the social shift to the social distance as follows (Equation 3):
We fitted a generalized linear regression model to our data (y~1+x: x=ρo-ρs1, and y=ρs3-ρs1), which revealed that the intercept was not significant (intercept=0.01; P=0.43). As a result, our model no longer includes the intercept (Equation 4):
There is an alternative way to arrange Equation 4 where participants’ risk attitudes after observing peers (ρs3) can be represented as a weighting average of their baseline risk attitudes (ρs1) and their peers’ risk attitude (ρpeer) (Equation 5).
5. ρs3=w×ρpeer+(1-w)×ρs1
In Equations 4 and 5, w (social weight) represents how much weight a peer has in a participant’s view. The participant’s risk attitude after interaction lies somewhere between that of his peer and that of himself before the interaction. Figure 4b illustrates how ρs3 may vary depending on the amount of w. The higher w, the more similar the participant will become to his peer after acquiring social information. Participants with w=0 do not change according to social information, whereas those with w=1 conform fully to their peers’ behaviors. Participants who give the same weight to their own strategy and that of their peers are represented by w=1/2.
Assuming ρs1 and ρpeer form a convex combination, we fitted the model suggested in Equation 5 to the entire data set. Consequently, w was estimated to be 0.38. We also calculated w using the model-free estimation of risk attitude (see statistical analysis in the method section). The value of w was 0.33, which is approximately comparable to the value determined by the model-based approach. Taking the entire sample data into consideration, the results of the model-based and model-free approaches indicate that the social weight (w) lies between 0.3 and 0.4.
4. Discussion
In the present study, by combining an economical behavioral task with a computational modeling approach, we investigated how information in the social context influences risky behavior among early male teenagers.
In accordance with the literature, we demonstrated that boys’ risk attitudes shift when they become aware of their peers’ choices. We observed the risk contagion effect in teenagers as adolescents’ risk attitudes increase/decrease when they observe peers making risk-seeking/risk-averse choices. After learning about their peers, participants’ risk attitudes were formed based on their own baseline risk attitudes as well as their peers’ risk attitudes. Results showed that peer-biased shifts in risk attitudes correlate with the risk perspective gap between teenagers and their peers.
We confirmed previous studies (Blankenstein et al., 2016; Braams et al., 2021; Reiter et al., 2019; Suzuki et al., 2016), indicating that attitudes toward risk change after observing and learning about peers' risk attitudes during early adolescence. Consistent with these results, one incorporates information obtained from observing others into his decision-making process. We found that adolescents displayed significant changes toward their peers. Our results align with a recent study indicating that the risk contagion effect is more prominent among early adolescents, whereas older adolescents tend to prioritize their own preferences and beliefs (Molleman et al., 2022). Early adolescents might possess a less defined comprehension of moral values (Reiter et al., 2019), whereas older adolescents could exhibit a more certain grasp of these principles (Morgan et al., 2012). It is possible that the reported developmental trends in susceptibility to social influence are due to the decrease in randomness in decision-making as we age (Rodriguez Buritica et al., 2019). We checked for and excluded participants who made most of their choices randomly.
Risk contagion may be explained by a reward-sensitive motivational state induced by peers, which increases teenagers' likelihood of engaging in risky behavior (Reiter et al., 2019). In a recent meta-analysis comprising 59 fMRI studies on decision-making under risk in adolescents, it was found that adolescents, in contrast to adults, exhibited a stronger association with the right LPFC when opting for safe choices and a stronger association with the left insula and bilateral dorsal striatum when opting for risky choices. Nevertheless, adults exhibited a stronger association with the right mid-dACC compared to adolescents when making risky choices. This finding can be interpreted through the lens of prominent developmental theories of decision-making under risk, such as the dual-systems model (involving cognitive control and emotional arousal) and another theory that underscores alterations in cognitive strategies with maturation (van Duijvenvoorde et al., 2022; Zhang, 2022).
In adolescents, brain areas associated with cognitive control were less strongly recruited than in adults, but activity in the cognitive control system did not vary according to social context. Thus, adolescents may involve an imbalance between cognitive and affective systems (Chein et al., 2011; Steinberg, 2008). Although these studies suggest that peer effects on adolescents' decision-making are associated with impulsive behavior and enhanced reward-related activity, some results of the reaction time (RT) analysis contradict these findings (Reiter et al., 2019; Van Hoorn et al., 2017). Based on their results, peer presence (Van Hoorn et al., 2017) and social information (Reiter et al., 2019) did not simply facilitate decision-making, which is inconsistent with an impulsive reaction to risky peer behavior. According to these studies, risk contagion among teenagers involves a deliberate, socially motivated process. I To bolster this concept, research has shown that the risk contagion effect influences the neural encoding of risk in the caudate by interacting with the dlPFC, a region known for its role in thoughtful, purposeful decision-making and action planning in adults (Suzuki et al., 2016).
A prevalent belief regarding teenagers being inclined towards risk-taking behavior implies that they are more likely to be influenced by risk-seeking peers rather than risk-averse ones (Loke & Mak, 2013; WHO, 2012), potentially resulting in conformity towards riskier choices. Studies in this area seem to indicate that risk contagion in adolescents is specific to interacting with risk-seeking peers, not risk-averse peers (Chein et al., 2011; Reiter et al., 2019) or at least, teens who observed risk-seeking peers shifted more than teens who observed risk-averse peers. There are, however, some teens who have pronounced risk-averse preferences (Braams et al., 2021; Chein et al., 2011) and it turns out that nearly half of our sample was risk-averse. Moreover, our results revealed that in spite of a stronger contagion effect for the group with a risk-seeking peer, the size was not significantly different. Taking into account the findings of our study, we conclude that risk contagion in early adolescents is a bidirectional effect that does not solely trigger risk-seeking activities but can also help prevent risky behavior.
In addition, as we explored in more detail, social differences in risk attitudes were positively correlated with peer-biased risk contagion. Teens' risk attitudes change proportionally to the gap between their peers and their own, with about 30-40% of the gap vanishing when they learn about their peers' choices. Susceptibility to peer influence appears to be an adaptive process that is associated with a greater sense of interpersonal connection. Interestingly, in real life, social information may also affect individuals based on their position in their social network.
An analysis of a large sample of participants showed that their behavior changed about 1/3 of the distance towards the observed social information after receiving advice (Mollema et al., 2019b). Another recent study conducted on adolescents aged 11 to 15 years, based on a simple estimation task, demonstrated that social information has a strong effect on behavior. In this task, the average adjustment when observing a peer was 43% (Molleman et al., 2019a).
The relationship between social integration and real-life behavior in the domain of risk is yet to be investigated. Peers impact almost all aspects of adolescents' lives, from taste in music and clothing to the more serious, such as the use of illicit drugs or engaging in unprotected sex (Loke & Mak, 2013; Steinberg, 2008). Thus, understanding social influences on adolescent risk-taking behavior is valuable for preventing maladaptive behaviors and disease (Reiter et al., 2017; WHO, 2012). Long-term running with the wrong crowd can adversely affect people's health, education, social and economic success, and general well-being (WHO, 2012). Recent studies, however, indicate that peers may also promote prosocial behavior and reduce risk-taking (Ahmed et al., 2020; Chierchia et al., 2020; Molleman et al., 2022). The results of a recent study suggest that children and adolescents are more likely to be positively influenced by peers in the domain of prosocial decision-making than older individuals (Foulkes et al., 2018). However, more research is needed in this area. It would be useful to examine how peer relationships affect learning and decision-making within social networks in future studies. Understanding how peers promote and shape positive behavior requires understanding how behavior, social learning, and network formation interact.
Because of budgetary constraints, we were limited to a sample size of 38 participants, but our power analysis revealed that this was sufficient to draw conclusions about the overall dataset. However, the sample size of 15-16 used for in-group analysis may not be adequate for generalizations. Nonetheless, the results of each group can still provide valuable insights that can be used to explore risk contagion further. In addition, studies similar to ours have conducted intra-group or auxiliary analyses using a small sample size; for example, Suzuki et al., (2016) utilized a total sample size of 24, with some of the auxiliary analyses conducted on 12 participants.
Lastly, like most studies in this field (Braams et al., 2021; Suzuki et al., 2016; Van Hoorn et al., 2017), we restricted our sample to male participants. The purpose of this was to avoid the confounding effect of baseline differences in risk-taking that might be associated with differences in pubertal trajectory between boys and girls. For future studies, it is advisable to incorporate lifespan samples from both genders to assess the generalizability of the findings.
As a topic for future research, it is theoretically interesting to investigate the integration of information from different sources when parents and peers exert opposing influences. Exploring how individuals’ confidence in their own judgment impacts their utilization of social information presents an intriguing avenue for research. Additionally, longitudinal and cross-sectional studies can offer valuable insights into the roots and progression of social learning.
5. Conclusion
Our study shed new light on the use of social information by adolescents in making risky decisions. Peer-provided social information was highly used by adolescents. The data showed that these peer-biased changes in risk attitudes are proportional to the gap between teenagers and their peers’ risk perspectives. According to the results, their perspectives began to align closer after receiving the information, and approximately 30-40% of the gap was eliminated. A difference in teens’ risk attitudes before they communicate does not appear to be causally correlated with social risk contagion. However, it is possible to argue that this shift is part of an adaptive process involving social integration.
Ethical Considerations
Compliance with ethical guidelines
The research was approved by the SCS Research Ethics Committee of the Institute for Research in Fundamental Sciences (IPM) (Code: SCS. REC: 1401/60/1/618).
Funding
The paper was extracted from the PhD dissertation of Amir Hossein Tehrani-Safa, approved by Institute for Cognitive and Brain Sciences, Shahid Beheshti university.
Authors' contributions
Conceptualization, methodology, review and editing: Amir Hossein Tehrani-Safa, Atiye Sarabi-Jamab; Investigation: Amir Hossein Tehrani-Safa and Mohammad Herasat; Validation: AmirHossein Tehrani-Safa and Atiye Sarabi-Jamab; Supervision and project administration: Reza Ghaderi and Atiye Sarabi-Jamab; Resources: Atiye Sarabi-Jamab; Visualization, software and formal analysis: Amir Hossein Tehrani-Safa; Writing the original draft: Amir Hossein Tehrani-Safa, Mohammad Herasat and Atiye Sarabi-Jamab.
Conflict of interest
The authors declared no conflict of interest.
References
Ahmed, S., Foulkes, L., Leung, J., Griffin, C., Sakhardande, A., Bennett, M., Dunning, D., Griffiths, K., Parker, J., Kuyken, W., Williams, J. M. G., Dalgleish, T., & Blakemore, S. (2020). Susceptibility to prosocial and antisocial influence in adolescence. [DOI:10.1016/j.adolescence.2020.07.012] [PMID] [PMCID]
Albert, D., Chein, J., & Steinberg, L. (2013). The Teenage Brain: Peer Influences on Adolescent Decision Making. Current Directions in Psychological Science, 22(2), 114-120. [DOI:10.1177/0963721412471347] [PMID] [PMCID]
Andrews, J. A., Tildesley, E., Hops, H., & Li, F. (2002). The influence of peers on young adult substance use. Health Psychology, 21(4), 349-357. [DOI:10.1037/0278-6133.21.4.349] [PMID]
Bernoulli, D. (1954). Exposition of a new theory on the measurement of risk. Econometrica, 22, 23-36. [DOI:10.2307/1909829]
Blankenstein, N. E., Crone, E. A., van den Bos, W., & van Duijvenvoorde, A. C. K. (2016). Dealing With Uncertainty: Testing Risk- and Ambiguity-Attitude Across Adolescence. Developmental Neuropsychology, 41(1-2), 77-92. [DOI:10.1080/87565641.2016.1158265] [PMID]
Braams, B. R., Davidow, J. Y., & Somerville, L. H. (2019). Developmental patterns of change in the influence of safe and risky peer choices on risky decision-making. Developmental Science, 22(1). https://doi.org/10.1111/desc.12717 [DOI:10.1111/DESC.12717] [PMID]
Braams, B. R., Davidow, J. Y., & Somerville, L. H. (2021). Information about others’ choices selectively alters risk tolerance and medial prefrontal cortex activation across adolescence and young adulthood. Developmental Cognitive Neuroscience, 52. [DOI:10.1016/j.dcn.2021.101039] [PMID] [PMCID]
Byrnes, James P and Miller, David C and Schafer, W. D. (1999). Gender differences in risk taking: A meta-analysis. Psychological Bulletin, 125(3), 367. [DOI:10.1037/0033-2909.125.3.367]
Chein, J. M., Albert, D., O’Brien, L., Uckert, K., & Steinberg, L. (2011). Peers increase adolescent risk taking by enhancing activity in the brain’s reward circuitry. Developmental Science, 14(2), F1. [DOI:10.1111/j.1467-7687.2010.01035.x] [PMID] [PMCID]
Chierchia, G., Piera Pi-Sunyer, B., & Blakemore, S.-J. (2020). Prosocial influence and opportunistic conformity in adolescents and young adults. Psychological Science, 31(12), 1585-1601. [DOI:10.1177/0956797620957625] [PMID] [PMCID]
Ciranka, S., & van den Bos, W. (2019). Social influence in adolescent decision-making: A formal framework. Frontiers in Psychology, 10(AUG), 1915. https://doi.org/10.3389/fpsyg.2019.01915 [DOI:10.3389/FPSYG.2019.01915/BIBTEX] [PMID] [PMCID]
Faul, F., Erdfelder, E., Lang, A. G., & Buchner, A. (2007). G*Power 3: A flexible statistical power analysis program for the social, behavioral, and biomedical sciences. Behavior Research Methods, 39(2), 175-191. [DOI:10.3758/BF03193146] [PMID]
Foulkes, L, Leung, J., Fuhrmann, D., Knoll, L., & Blakemore, S. (2018). Age differences in the prosocial influence effect. [DOI:10.1111/desc.12666] [PMID] [PMCID]
Foulkes, Lucy, & Blakemore, S. J. (2016). Is there heightened sensitivity to social reward in adolescence? Current Opinion in Neurobiology, 40, 81-85. [DOI:10.1016/j.conb.2016.06.016] [PMID]
Gardner, M., & Steinberg, L. (2005). Peer influence on risk taking, risk preference, and risky decision making in adolescence and adulthood: An experimental study. Developmental Psychology, 41(4), 625-635. [DOI:10.1037/0012-1649.41.4.625] [PMID]
L van Leijenhorst, E. C. S. B. (2006). Neural correlates of developmental differences in risk estimation and feedback processing. Neuropsychologia, 44, 2158-2170. [DOI:10.1016/j.neuropsychologia.2006.02.002] [PMID]
Levy, I., Snell, J., Nelson, A. J., Rustichini, A., & Glimcher, P. W. (2010). Neural representation of subjective value under risk and ambiguity. Journal of Neurophysiology, 103(2), 1036-1047. [DOI:10.1152/jn.00853.2009] [PMID]
Loke, A. Y., & Mak, Y. W. (2013). Family process and peer influences on substance use by adolescents. International Journal of Environmental Research and Public Health, 10(9), 3868-3885. [DOI:10.3390/ijerph10093868] [PMID] [PMCID]
Molleman, L., Ciranka, S., & van den Bos, W. (2022). Social influence in adolescence as a double-edged sword. Proceedings of the Royal Society B, 289(1977), 20220045. [DOI:10.1098/rspb.2022.0045] [PMID] [PMCID]
Molleman, L., Kanngiesser, P., & van den Bos, W. (2019). Social information use in adolescents: The impact of adults, peers and household composition. PloS One, 14(11), e0225498. [DOI:10.1371/journal.pone.0225498] [PMID] [PMCID]
Molleman, L., Kurvers, R. H. J. M., & van den Bos, W. (2019). Unleashing the BEAST: a brief measure of human social information use. Evolution and Human Behavior, 40(5), 492-499. [DOI:10.1016/j.evolhumbehav.2019.06.005]
Molleman, L., Tump, A. N., Gradassi, A., Herzog, S., Jayles, B., Kurvers, R. H. J. M., & van den Bos, W. (2020). Strategies for integrating disparate social information. Proceedings of the Royal Society B, 287(1939), 20202413. [DOI:10.1098/rspb.2020.2413] [PMID] [PMCID]
Morgan, T. J. H., Rendell, L. E., Ehn, M., Hoppitt, W., & Laland, K. N. (2012). The evolutionary basis of human social learning. Proceedings of the Royal Society B: Biological Sciences, 279(1729), 653-662. [DOI:10.1098/rspb.2011.1172] [PMID] [PMCID]
Reiter, A., Heinz, A., & Deserno, L. (2017). Linking social context and addiction neuroscience: a computational psychiatry approach. Nature Reviews Neuroscience, 18(7), 450. [DOI:10.1038/nrn.2017.67] [PMID]
Reiter, A. M. F., Suzuki, S., O’Doherty, J. P., Li, S. C., & Eppinger, B. (2019). Risk contagion by peers affects learning and decision-making in adolescents. Journal of Experimental Psychology: General, 148(9), 1494-1504. [DOI:10.1037/xge0000512] [PMID]
Rodriguez Buritica, J. M., Heekeren, H. R., & van den Bos, W. (2019). The computational basis of following advice in adolescents. Journal of Experimental Child Psychology, 180, 39-54. [DOI:10.1016/j.jecp.2018.11.019] [PMID] [PMCID]
Shad, M. (2011). Neurobiology of decision-making in adolescents. Behav. Brain Res., 217, 67-76. [DOI:10.1016/j.bbr.2010.09.033] [PMID] [PMCID]
Smith, A. R., Chein, J., & Steinberg, L. (2014). Peers increase adolescent risk taking even when the probabilities of negative outcomes are known. Developmental Psychology, 50(5), 1564-1568. [DOI:10.1037/a0035696] [PMID] [PMCID]
Somerville, L. H., Haddara, N., Sasse, S. F., Skwara, A. C., Moran, J. M., & Figner, B. (2019). Dissecting “Peer Presence” and “Decisions” to Deepen Understanding of Peer Influence on Adolescent Risky Choice. Child Development, 90(6), 2086-2103. [DOI:10.1111/cdev.13081] [PMID]
Steffens, T., Steffens, L. M., & Marcrum, S. C. (2020). Chance-level hit rates in closed-set, forced-choice audiometry and a novel utility for the significance test-based detection of malingering. PLoS ONE, 15(4), 1-15. [DOI:10.1371/journal.pone.0231715] [PMID] [PMCID]
Steinberg, L. (2008). A Social Neuroscience Perspective on Adolescent Risk-Taking. [DOI:10.1016/J.DR.2007.08.002] [PMID] [PMCID]
Suzuki, S., Jensen, E. L. S., Bossaerts, P., & O’Doherty, J. P. (2016). Behavioral contagion during learning about another agent’s risk-preferences acts on the neural representation of decision-risk. Proceedings of the National Academy of Sciences of the United States of America, 113(14), 3755-3760. [DOI:10.1073/pnas.1600092113] [PMID] [PMCID]
Tversky, A., & Kahneman, D. (1992). Advances in prospect theory: Cumulative representation of uncertainty. Journal of Risk and Uncertainty, 5(4), 297-323. [DOI:10.1007/BF00122574]
Tymula, A., Rosenberg, L. A., Roy, A. K., Ruderman, L., Manson, K., & Glimcher, P. W. (2012). Adolescents’ risk-taking behavior is driven by tolerance to ambiguity. Proceedings of the National Academy of Sciences, 1-6. [DOI:10.1073/pnas.1207144109] [PMID] [PMCID]
Valkenburg, P. M., Meier, A., & Beyens, I. (2022). Social media use and its impact on adolescent mental health: An umbrella review of the evidence. Current Opinion in Psychology, 44, 58-68. [DOI:10.1016/j.copsyc.2021.08.017] [PMID]
Van Den Bos, W., & Hertwig, R. (2017). Adolescents display distinctive tolerance to ambiguity and to uncertainty during risky decision making. Scientific Reports 2017 7:1, 7(1), 1-11. [DOI:10.1038/srep40962] [PMID] [PMCID]
van Duijvenvoorde, A. V, Hoorn, J. Van, & Blankenstein, N. (2022). Risks and rewards in adolescent decision-making. [DOI:10.1016/j.copsyc.2022.101457] [PMID]
Van Hoorn, J., Crone, E. A., & Van Leijenhorst, L. (2017). Hanging out with the right crowd: Peer influence on risk-taking behavior in adolescence. Journal of Research on Adolescence, 27(1), 189-200. [DOI:10.1111/jora.12265] [PMID]
World Health Organization (Geneva); Regional Committee. (2012). European action plan to reduce the harmful use of alcohol 2012 - 2020. Europe, 6(May 2011), 12-15.
Zhang, Z. (2022). Functionally similar yet distinct neural mechanisms underlie different choice behaviors: ALE meta-analyses of decision-making under risk in adolescents and adults. Developmental Review, 66, 101052. [DOI:https://doi.org/10.1016/j.dr.2022.101052]
Supplementary material
Supplemental information on the task and the experimental procedure
The gambles are represented by two parameters ρ and r, where ρ is the probability of receiving the reward and r is the amount of that reward. Reward probabilities (ρ) were 0.3, 0.4, and 0.5. T is important to highlight that we do not consider small probabilities (ρ<0.3), thereby minimizing the impact of subjective probability distortion as suggested in prospect theory (Tversky & Kahneman, 1992). Also, ρ and r are systematically varied to decouple the expected value of the reward from its mathematical variance. The sure payoff had a fixed value of 30TT. We set the gambles such that the risk-neutral participants chose gambling in nearly half of the trials (Figure S.1).
Computational model of decision-making under risk
In our study, participants’ attitudes toward risk were estimated through the widely used computational framework (Blankenstein et al., 2016; Braams et al., 2021; Levy et al., 2010; Tymula et al., 2012). The power utility function (Bernoulli, 1954) is used to model the subjective value of a risky option (Equation S.1):
p represents the risk attitude of the participants and is less and greater than 1 if he is a risk-averse and risk-taker, respectively. Also, ρ=1 indicates risk neutrality. The following Softmax function was employed to model the probabilistic nature of choice in the model of behavior in Equation S.2. Based on the difference between the expected utility of the two options, the Softmax function calculates the probability that a decision-maker will choose the gambling option (Ciranka & van den Bos, 2019).
In Equation S.2, β is a non-negative free parameter that models the degree, to which the choice probability relates to the utility difference. As β becomes smaller, choices become more random. It should be noted that this risk attitude estimation method is highly consistent with other commonly used model-based and model-free methods (Suzuki et al., 2016).
We set lower and upper bounds on the risk attitude ρ such that the estimated risk attitude always falls between 0.8 and 1.2. This range was found based on a computer simulation procedure. We simulated subjects with a variety of risk attitude characteristics and 100 simulations were run for each value of ρ. For all simulations, β is set to 5. Figure S.2 illustrates the probability of accepting the gamble for various values of ρ. Based on the simulations, subjects with a risk attitude of less than 0.8 rejected gambling, and subjects with a risk attitude greater than 1.2 chose gambles in over 90% of the trials. Therefore, risk attitudes greater than 1.2 and smaller than 0.8 result in a low variation in choice patterns. After fixing this range, we feed the behavioral data into the optimization algorithm.
To ensure the reliability of estimation, we simulated choices under different risk attitudes. We used the same set of gambling options and the same number of trials as in the original experiment. These choices were re-fitted based on our computational model. The recovery procedure appears to be highly accurate as can be seen in Table S.1
Data availability
All data and code supporting the findings of this study are available from the public repository, accessible at https://github.com/ahtehranisafa/adolescents-social-weight.
Type of Study: Original |
Subject:
Cognitive Neuroscience
Received: 2023/02/17 | Accepted: 2023/06/27 | Published: 2024/05/1
Received: 2023/02/17 | Accepted: 2023/06/27 | Published: 2024/05/1
Send email to the article author
| Rights and permissions | |
 |
This work is licensed under a Creative Commons Attribution-NonCommercial 4.0 International License. |
![]()
Copyright © The Author(s);
This is an open access article distributed under the terms of the Creative Commons Attribution License (CC-By-NC), which permits use, distribution, and reproduction in any medium, provided the original work is properly cited and is not used for commercial purposes.
Contact Information
