

Volume 15, Issue 2 (March & April 2024)
BCN 2024, 15(2): 199-210 |
Back to browse issues page


Download citation:
BibTeX | RIS | EndNote | Medlars | ProCite | Reference Manager | RefWorks
Send citation to:


BibTeX | RIS | EndNote | Medlars | ProCite | Reference Manager | RefWorks
Send citation to:
Nobakhsh B, Shalbaf A, Rostami R, Kazemi R. Graph-based Analysis to Predict Repetitive Transcranial Magnetic Stimulation Treatment Response in Patients With Major Depressive Disorder Using EEG Signals. BCN 2024; 15 (2) :199-210
URL: http://bcn.iums.ac.ir/article-1-2628-en.html
URL: http://bcn.iums.ac.ir/article-1-2628-en.html


1- Department of Biomedical Engineering and Medical Physics, School of Medicine, Shahid Beheshti University of Medical Sciences, Tehran, Iran.
2- Department of Psychology, Faculty of Education and Psychology, University of Tehran, Tehran, Iran.
3- Department of Entrepreneurship Development, Faculty of Entrepreneurship, University of Tehran, Tehran, Iran.
2- Department of Psychology, Faculty of Education and Psychology, University of Tehran, Tehran, Iran.
3- Department of Entrepreneurship Development, Faculty of Entrepreneurship, University of Tehran, Tehran, Iran.
Keywords: Effective connectivity, electroencephalogram (EEG), Graph theory, Major depressive disorder (MDD), Repetitive transcranial magnetic stimulation (rTMS)
Full-Text [PDF 1237 kb]
| Abstract (HTML)
Full-Text:
1. Introduction
Major depressive disorder (MDD) is a common mental disorder that currently affects over 264 million people of different ages. Depression is a significant cause of disability and contributes to the overall burden of illness associated with personal, social, and economic problems (Organization, 2017; Shiozawa et al., 2015). People with MDD experience symptoms such as low and chronic mood, decreased pleasure from previous activities, sleep disorders, mental retardation, fatigue and energy loss, weight change, and negative thoughts. They also suffer from pessimism to sin and suicidal thoughts (Association, 2000).
Medicines and psychotherapy are the first lines of treatment for MDD. However, around one-third of patients fail to respond to these treatments and are identified as treatment-resistant MDD patients (Berlim et al., 2008). Electroconvulsive therapy (ECT) and repetitive transcranial magnetic stimulation (rTMS) are non-pharmacological treatments for drug-resistant MDD patients. ECT has anesthesia risk, memory changes, and social stigmatization, whereas the rTMS is less invasive and painful than the ECT (Fink, 2001; Im & Lee, 2006; O’Reardon et al., 2007). In rTMS, based on the patient and treatment procedure stimulation parameters, such as coil shape, intensity, frequency, train duration, and inter-train interval, a series of magnetic pulses are applied to the cerebral cortex. These magnetic pulses can modulate the neuronal activity of target points (Beuzon et al., 2017). rTMS can change brain activity according to its frequency. High frequency (HF) (usually ≥10 Hz) is used to stimulate the target point, whereas low frequency (LF) (usually ≤1 Hz) inhibits the target point (Milev et al., 2016). Due to the left hypoactivity and right hyperactivity dorsolateral prefrontal cortex (DLPFC) in MDD patients, HF rTMS and LF rTMS are applied to the left and right DLPFC, respectively (Brunoni et al., 2017; Mayberg et al., 2000). Recent studies indicate that the success rate of rTMS treatment in people with MDD is about 50%-55% (Carpenter et al., 2012; Ciobanu et al., 2013). Because the rTMS treatment period is long (about 20 sessions) and the costs on healthcare systems are high, predicting the response to treatment through a personalized medicine approach is necessary and helps clinical decisions (Silverstein et al., 2015).
Currently, the prescription of rTMS treatment is based on clinical evaluation and lacks sufficient accuracy to predict the rTMS treatment outcome, especially before starting the treatment (Shalbaf et al., 2018). In one study, demographic indicators, depressive characteristics, and medicinal history were used as clinical predictors, and results demonstrated that MDD patients who are younger and show less refractory to medication have a better response to the rTMS treatment (Fregni et al., 2006). Another study, in addition to age, examined the effects of gender, menopausal status, and ovarian hormone levels in women. It was shown that there was no difference in rTMS response between men and premenopausal women (68.8% and 70.6%, respectively). Besides, the rTMS treatment outcome in postmenopausal women is low. The regression analysis has indicated that menopause and ovarian steroid levels play a key role in the rTMS treatment outcome in women (Huang et al., 2008). In one study, Rostami et al. evaluated clinical and demographic data. Based on the results, the patients with better cognitive-emotional symptoms respond better to rTMS treatment than the somatic symptoms (Rostami et al., 2017). As observed in these studies, due to the MDD patients’ differences in individual characteristics and brain structures, clinical data lack sufficient accuracy in predicting the rTMS treatment outcome.
The search for biomarkers to predict the rTMS treatment outcome in MDD patients has expanded on neuroimaging methods based on electroencephalogram (EEG). Clinicians frequently use EEG to identify effective biomarkers. EEG has many advantages, including ease of use, sufficient temporal resolution, non-invasiveness, and accessibility in the clinic (Shalbafet al., 2020a; Shalbaf et al., 2020b). Several linear and non-linear measures from EEG signals have been proposed as predictors of the rTMS treatment outcome in patients with drug-resistant MDD. One study used non-linear EEG features, including Lempel-Ziv complexity (LZC) and the largest Lyapunov exponent in an α frequency band. Non-responders indicated a significant decrease in LZC, while responders showed an increase in LZC (Arns et al., 2014). In another study, MDD patients were classified into responder and non-responder for rTMS treatment using feature selection of EEG signals based on a genetic algorithm and an artificial neural network (Erguzel et al., 2015). In other studies, additional features such as permutation entropy (Shalbaf et al., 2018), Katz fractal dimension, and correlation dimension (Hasanzadeh et al., 2019) were extracted from EEG signals and examined to predict the rTMS treatment outcome in drug-resistant MDD patients. These methods contribute to analyzing the complexity of EEG signals, but the EEG signal is non-stationary, and these methods have limitations in estimating accurate temporal patterns.
Neuroimaging techniques reveal that a single EEG channel cannot represent complicated neurophysiological changes in psychiatric disorders. Recent research has indicated that the human brain is a complex integrated network consisting of interconnected brain areas to form subnets of the brain. Examining these networks can provide a new perspective on how the brain works. Consequently, understanding the brain’s neural dynamic patterns and behavior provides the best features to predict rTMS treatment response. Complex interactions across brain regions can be described through functional and effective brain connectivity measures (Friston, 2011). Functional connectivity indicates only coordinated activity and statistical dependency between brain areas, while effective connectivity provides information about the causal relationship between brain areas (Olejarczyk & Jernajczyk, 2017). Granger causality (GC) is widely used to estimate the effective brain connectivities that characterize the directed information flow and causal interaction between time series of EEG signals. Graph theory methods are often used for quantitative analysis of brain connection. Graph theory is a theoretical platform to examine complex networks like the brain, which can provide valuable information about the local organization of the functional brain networks (Van Den Heuvel & Pol, 2010).
The novelties of the current study are the use of effective brain connectivity measures by pretreatment EEG signals to estimate the graph theory indices, which helps identify the brain’s complex networks and its best patterns to find significant biomarkers between two groups of responder and non-responder MDD patients. These findings will lead to a decrease in the time and cost of the patients before starting the rTMS treatment.
2. Materials and Methods
Participants and clinical assessment
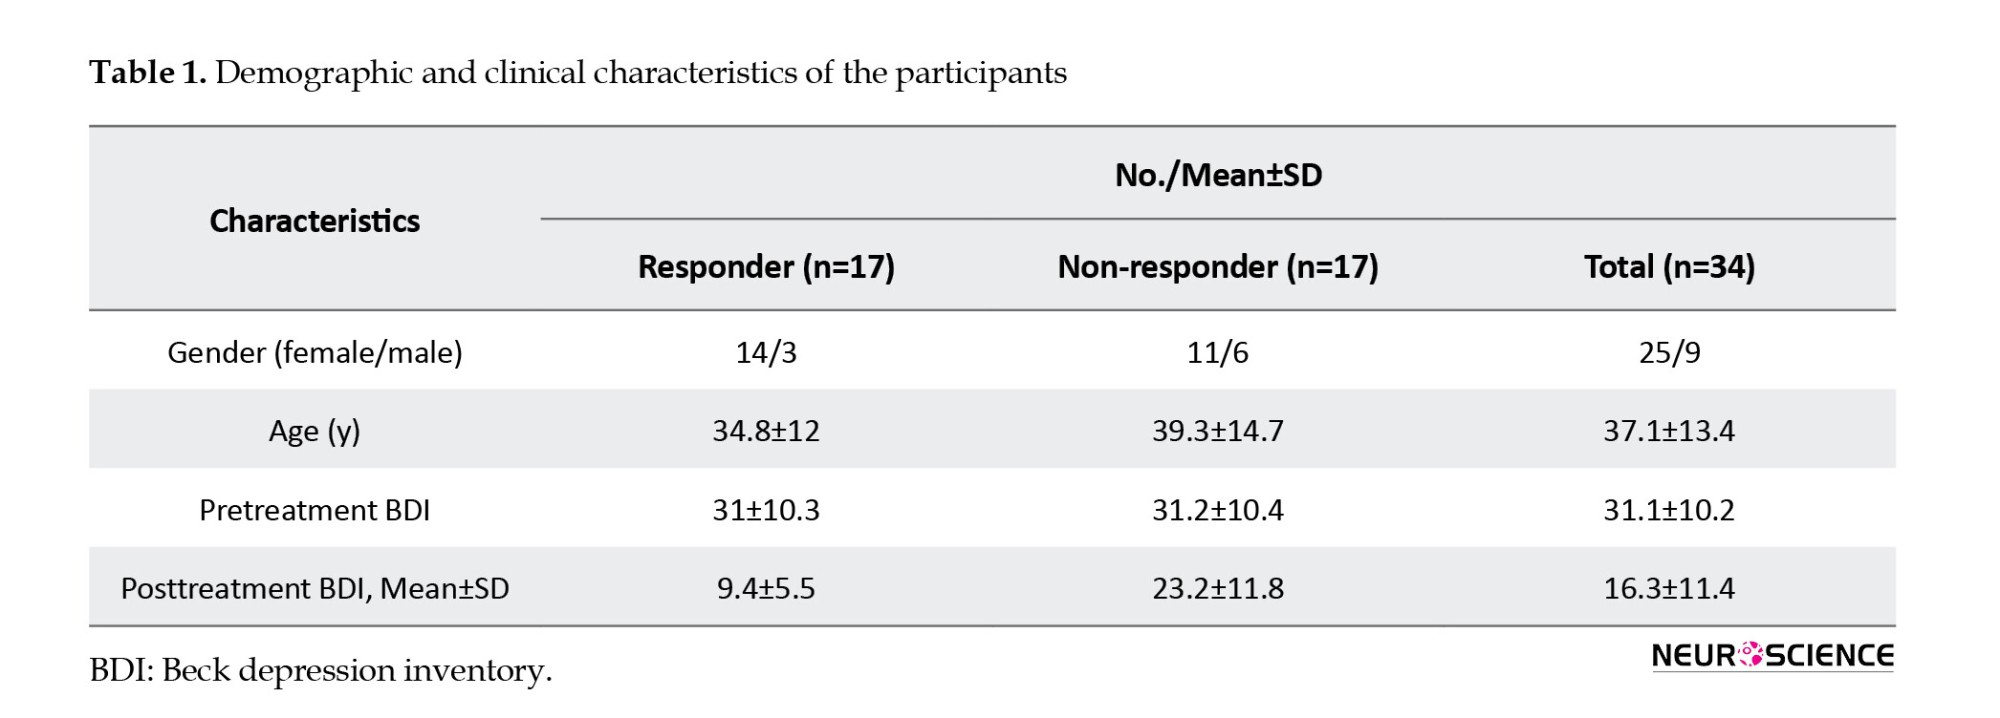
The EEG data were recorded at the Atieh Clinical Neuroscience Center from 34 MDD patients refractory to medication (Mean±SD age: 37.1±13.4 years, 25 women) who were referred for rTMS treatment. An experienced psychiatrist, based on the structured clinical interviews for axis I DSM-IV (First, 1997), made the diagnosis of MDD, and the patient was subjected to a baseline clinical assessment using the beck depression inventory (BDI-II) (Beck et al., 1961). This inventory has 21 self-report questions dealing with the status of the subjects in their past week. Each question consists of four answers ranging in intensity. All MDD patients received 20 sessions of rTMS treatment, three sessions per week, in the right DLPFC area of the brain. BDI scores for all MDD patients were assessed one week before rTMS treatment and after 20 sessions of rTMS. A reduction of at least 50% of the total BDI score is defined as the rTMS treatment outcome. In the current study, the participants’ written consent was obtained, and the study was authorized by Shahid Beheshti University of Medical Sciences Ethics Committee. The demographic data and clinical characteristics of participants are summarized in Table 1.
rTMS treatment parameters
Atieh Clinical Neuroscience Center utilizes a Neuro MS rTMS device (Neurosoft, Russia) for patients referred for the rTMS treatment. Magnetic pulses are delivered through a 70-mm stimulation coil (air film coil). Each patient's motor threshold is defined as the lowest intensity needed to stimulate the motor cortex that causes a contraction of the abductor pollicis brevis (APB) muscle in at least 5 out of 10 attempts. The coil position is 5 cm anterior along a parasagittal line from the site of optimum APB stimulation. All patients received the LF-rTMS protocol. This protocol delivered stimulation over the right DLPFC, at 120% of the resting motor threshold, for 10 s at 1-Hz with 2 s intervals. This procedure is repeated 200 times (2000 pulses) per session (40000 pulses over 20 sessions).
Pretreatment EEG acquisition
All EEG signals were recorded in the resting state with closed eyes condition for 300 seconds with 19 channels of Ag/AgCl electrodes (Mitsar-EEG 201 machine). The position of the electrodes was according to the 10-20 standard (Fp1, Fp2, F7, F3, Fz, F4, F8, T7, C3, Cz, C4, T8, P7, P3, Pz, P4, P8, O1, and O2) and the sampling rate of recorded EEG signals was 250 Hz.
EEG preprocessing
The EEGLAB open-source toolbox (Delorme & Makeig, 2004) has been used to preprocess and remove the environmental and movement noise from EEG data. At first, a high-pass filter (1 Hz) purified EEG signals and removed the baseline drift. EEG signals were re-referenced by the average reference. The CleanLine open-source plugin (Mullen, 2012) in the EEGLAB toolbox has been used to remove the line noise from EEG signal channels. This plugin uses a sliding window to estimate sine wave amplitude to decrease, and in comparison with a notch filter, it does not make a hole in the EEG spectrum. EEG data were cleaned visually by the “reject continuous data by eye” section to remove the motion artifacts (that existed in all channels). After relative cleanliness, independent component analysis (ICA) was utilized to clean the data from blinking and head movements. In the end, we hold 150 seconds of all subjects to unify the data.
Effective connectivity
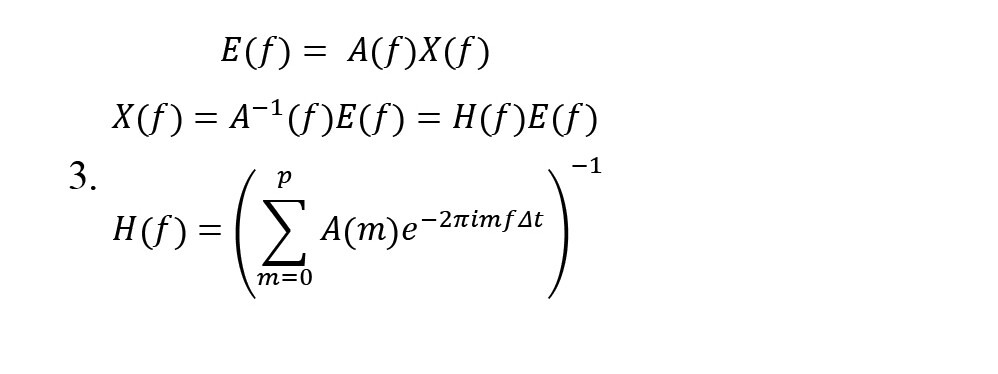
Effective connectivity provides information on the causal interaction relationship between the time series of EEG signals and characterizes the directed information flow (Olejarczyk & Jernajczyk, 2017). Effective connectivity is extracted by the SIFT open-source plugin (Delorme et al., 2011) in the EEGLAB toolbox. The Granger causality (GC) is widely used to calculate effective brain connectivities. The directed transfer function (DTF) is a GC-based scale defined in the frequency domain and could be computed based on a multivariate autoregressive model (MVAR) (Kaminski & Blinowska, 1991). For an X(t) as -channel multivariate time series, it obtains (Equations 1 and 2):

Coefficients of A and E(t) are k×k -sized matrices and -size vectors, respectively. Then, the model is transformed into a multivariate autoregressive in the frequency domain to obtain the system transfer matrix (Equation 3):
The filter coefficients matrix H(f) is known as the system transfer matrix. The transfer matrix makes it possible to find cross-spectra and partial coherences (Equation 4):
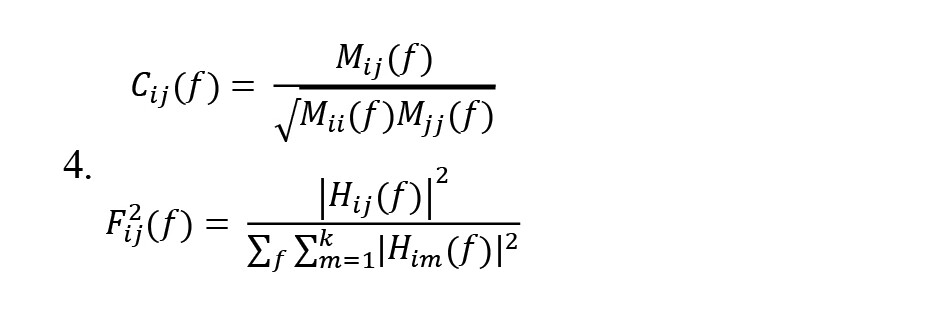
, Where Cij(f) is partial coherence and is a minor of the spectral matrix, and the DTF modification (Fij2(f)) concerns the function normalization to make the denominator independent of frequency. The dDTF (χij(f)) indicates direct propagation from channel j to i (Equation 5):

There exists a direct causal relationship between channels j→i when both functions Fij2(f) and Cij2(f) are non-zero. So, the dDTF method has compensated for the lack of other effective connectivities by combining the advantages of DTF and partial coherence methods and has indicated more reliable effective connectivity.
Graph analysis
Graph theory analysis has been used to obtain a new perspective on complex networks like the brain. The brain’s nervous system is a complex network that can be modeled as a graph. The EEG channels (brain regions) are nodes, and the edges represent the brain connections calculated by the dDTF method. As a result, brain function based on graph indices can be assessed (Rubinov & Sporns, 2010). For each obtained graph, the local indices have been calculated (Bullmore & Sporns, 2009; Rubinov & Sporns, 2010). The first index is degree; the node’s degree represents the number of neighbors connected to the given node. This index can be computed as inward and outward links, in-degree and out-degree, respectively. Each edge (link) has a weight that indicates whether the connection is strong or weak. Strength is the sum of all neighboring link weights. Furthermore, the strength of nodes can be computed inward and outward links as in-strength and out-strength. Another important graph-based index is centrality, which makes it possible to assess the node’s importance in interactions with other nodes (Chiang & Haneef, 2014). Betweenness centrality calculates these types of nodes and demonstrates the fraction of all shortest paths in the network that pass across a given node. Graph-based indices are calculated using functions implemented in the BCT open-source toolbox (Rubinov & Sporns, 2010).
Statistical analysis
The statistical analysis assesses the significance of the extracted features. The current study has used the Wilcoxon rank-sum test to examine the sample independence of the two groups (Fay & Proschan, 2010). The area under the receiver operating characteristic curve (AUC-ROC) has been used to evaluate the performance of two group classification algorithms to select the best features (Mamitsuka, 2006).
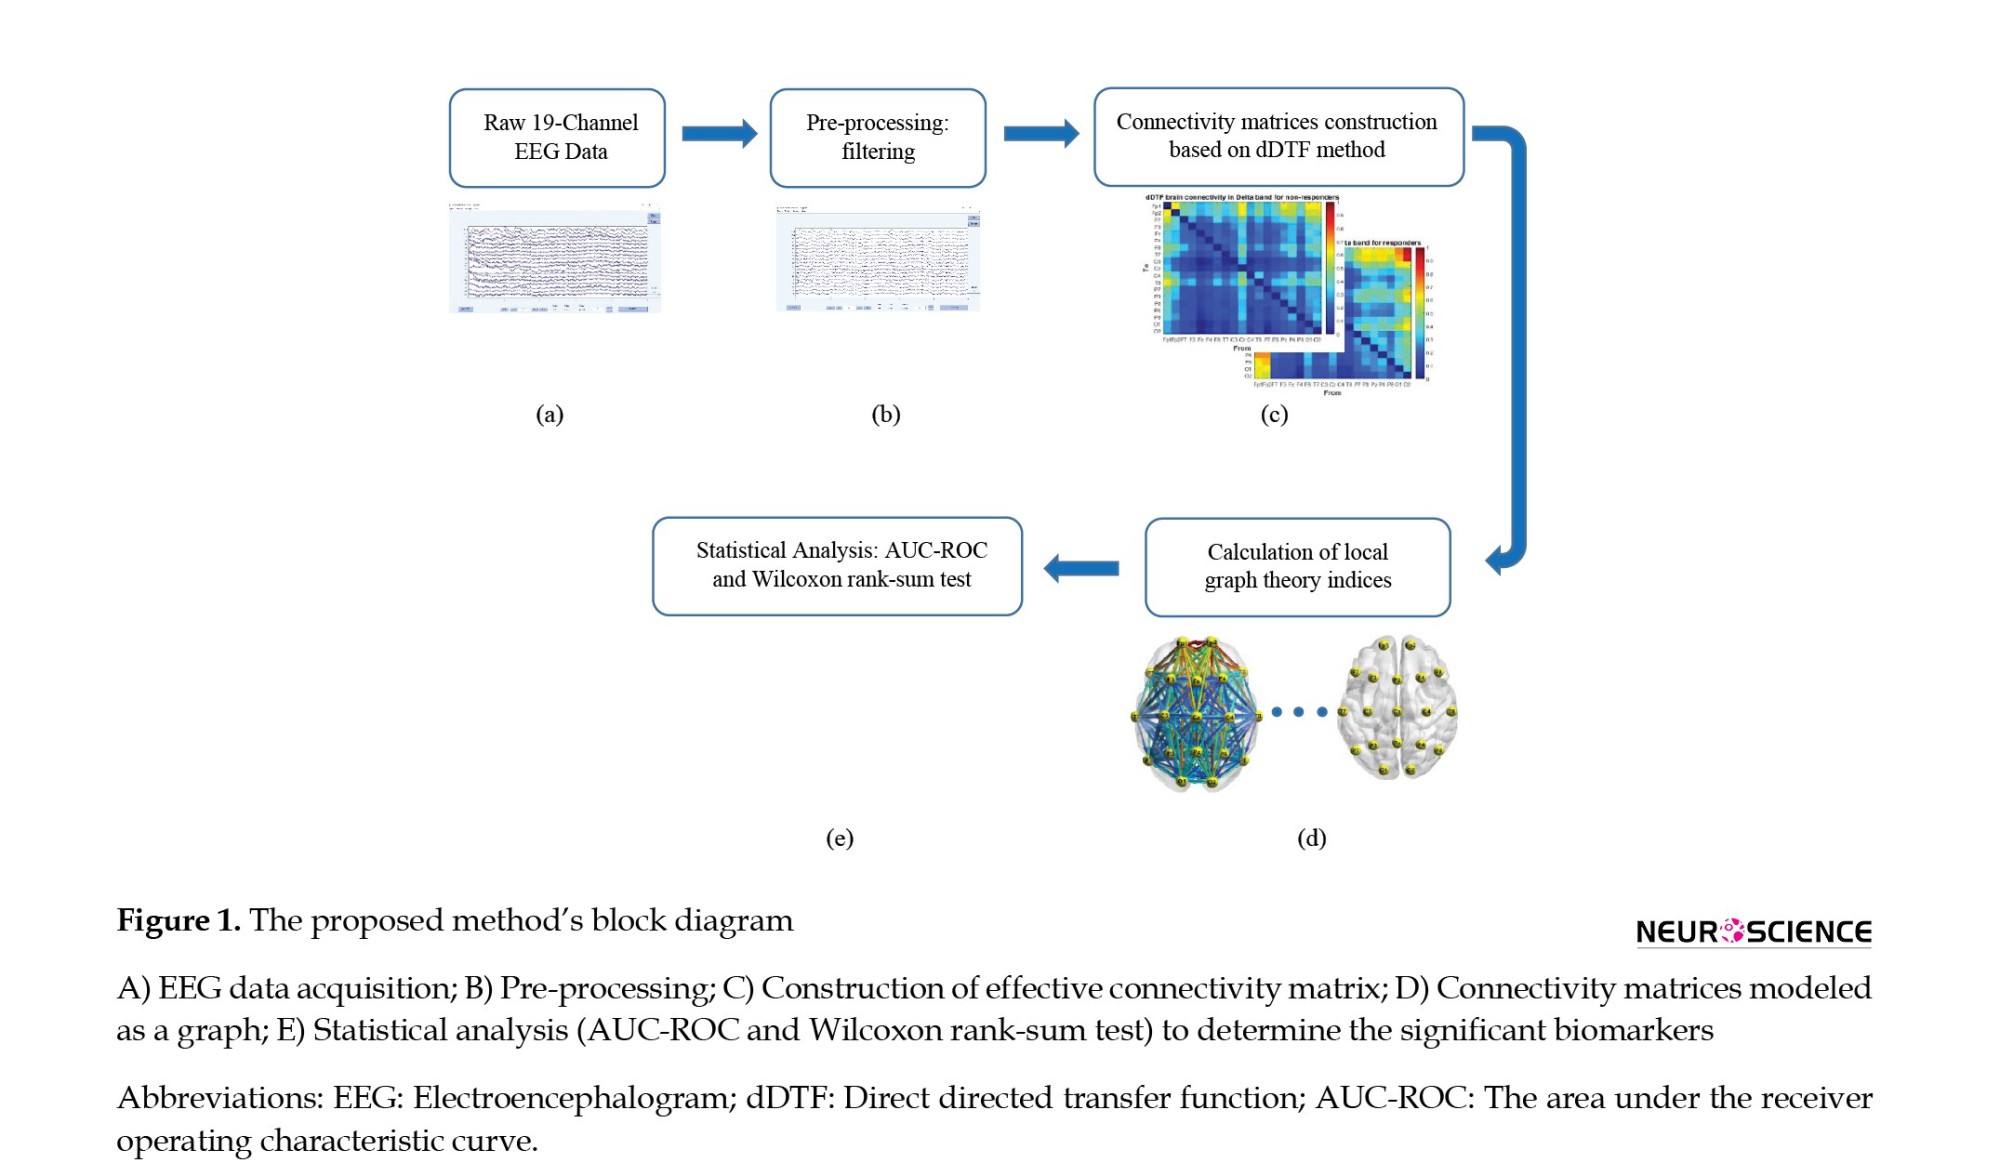
Overview of the proposed method
The proposed method’s block diagram is summarized in Figure 1. First, the raw EEG data will be processed using the EEGLAB open-source toolbox. The preprocessing block removes the environmental and subject artifacts to extract the pure brain activity, including frequency filtering and line noise cancellation, artifacts removal, ICA (to remove blinking and head movements), and time correction. Then, the effective brain connectivity between 19 EEG signal channels is calculated using the dDTF method in all frequency bands of the δ, θ, α, β, and γ and used as the extracted feature using the SIFT plugin (Mullen, 2010) in the EEGLAB toolbox. The connectivity matrix (dDTF) is 19×19 per patient. In the following, brain function is modeled as a graph by the dDTF method and examined with the local graph theory indices such as degree, out-degree, in-degree, strength, out-strength, in-strength, and betweenness centrality. Finally, the Wilcoxon rank-sum test (P) and AUC-ROC are utilized to identify the best indices and significant biomarkers to predict the rTMS treatment outcome in MDD patients refractory to drugs.
3. Results
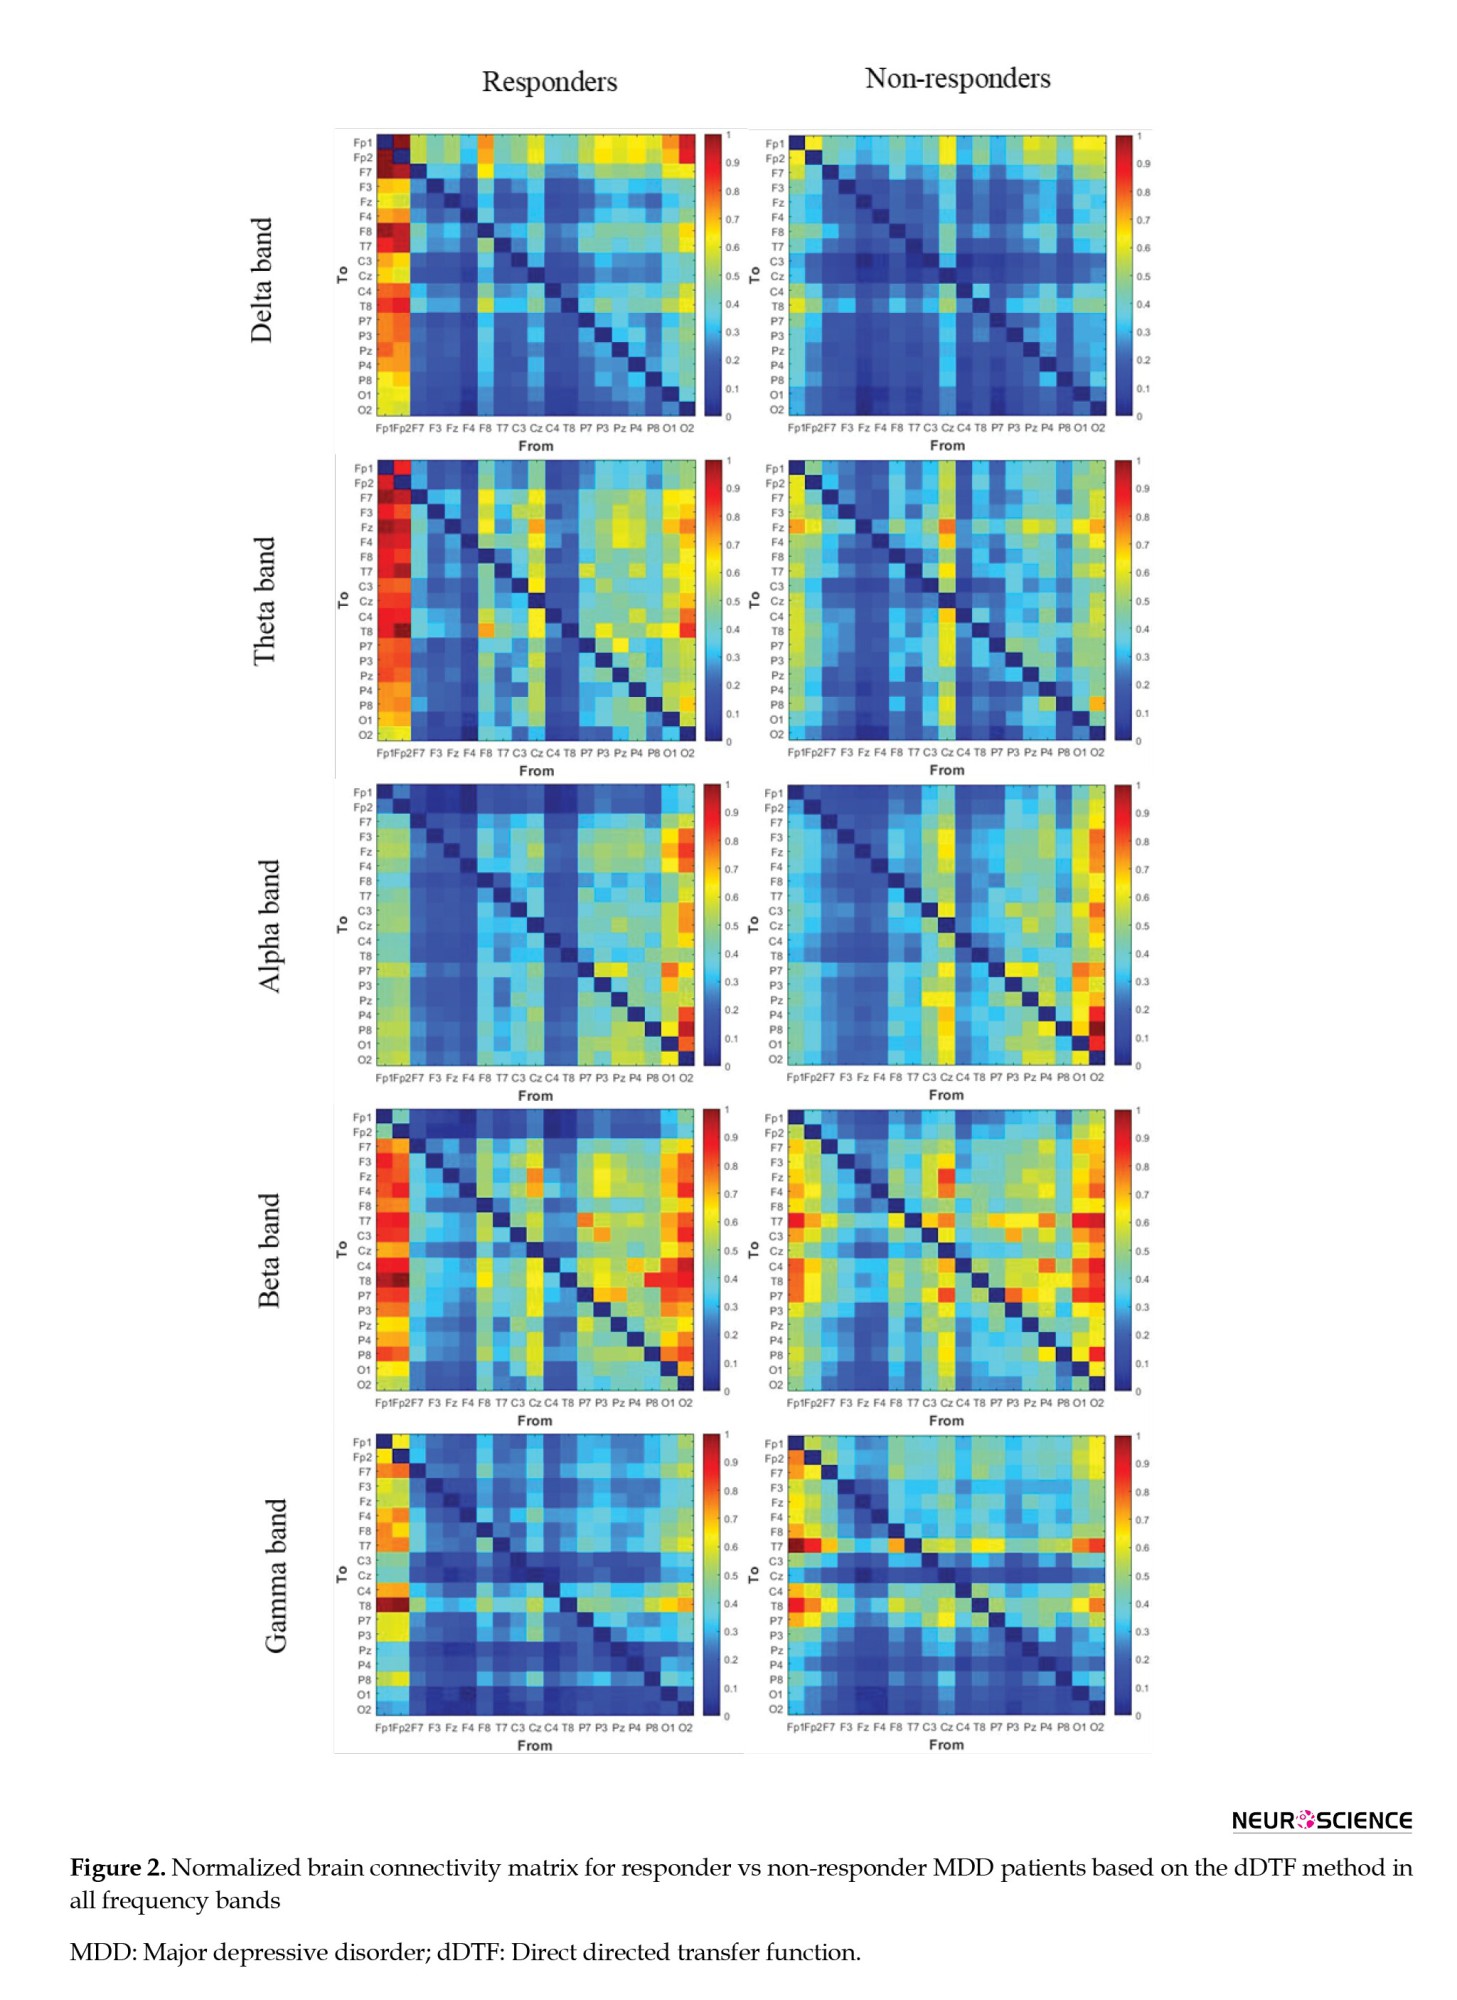
After preprocessing, each EEG data was segmented into a window length of 10 seconds. The dDTF values indicate a causal relationship between different brain areas based on the parameters of the MVAR model. The dDTF brain connectivity features have been extracted in the δ (1-4 Hz), θ (4-8 Hz), α (8-12 Hz), β (12-30 Hz), and γ (30-40 Hz) frequency bands, separately. The MVAR model parameters have been selected according to the autocorrelation function and portmanteau tests (model order=12). Autocorrelation function and portmanteau tests have been used to pass the order selection criteria (whiteness, consistency, and stability). The dDTF method calculated the connectivity matrix by 10-s windows, and the mean values of the 15 windows (150 s) from the whole signal were assigned as a connectivity matrix for each patient. Then, the brain is modeled as a graph so that nodes represent EEG channels (brain regions) and edges represent the brain connections determined by the dDTF method. Figure 2 illustrates the normalized mean values of brain connectivity matrices and the causal relationship between different brain areas calculated by the dDTF method for responding and non-responding MDD patients in δ, θ, α, β, and γ frequency bands separately.
Next, the brain function is examined with the graph theory indices using the embedded functions in the BCT open-source toolbox. Local indices, including degree, out-degree, in-degree, strength, out-strength, in-strength, and betweenness centrality, were calculated for each obtained graph. Graph theory indices for each node (EEG channels) were calculated for all frequency bands at different thresholds (for example, at the 70% threshold, 30% of the weakest connections in the brain connectivity matrix were removed). The Wilcoxon rank-sum test (P) and the AUC-ROC were used to identify the best indices that predict the rTMS treatment outcome. The results of this process, including the Mean±SD values of the graph theory indices for responder versus non-responder MDD patients for each frequency band with the highest AUC-ROC, are reported in Table 2 separately. In other words, each graph theory index has been calculated at different nodes and thresholds, and the best one based on the highest AUC-ROC is reported in Table 2.
For example, in betweenness centrality at the δ band, the Fp2 node at the threshold of 0.7 have the highest AUC-ROC (0.85) and P<0.001. Also, the best graph theory indices for all frequency bands based on AUC-ROC are reported in Table 3. According to Table 2, graph theory indices have the highest AUC-ROC values in the δ and θ bands. By examining the AUC-ROC values of graph theory indices, it is notable that the degree, strength, and betweenness centrality in the δ frequency band and in-degree, out-strength, and in-strength in the θ frequency band have the highest AUC-ROC values. Also, by assessing the most notable brain areas, the Fp2 node has the highest AUC-ROC values (Tables 2 and 3). According to Table 2, degree, strength, out-degree, out-strength, and betweenness centrality in the Fp2 area have the highest AUC-ROC values. The Fp2 area is a source of information for this target, and therefore, out-degree and out-strength indices have higher AUC-ROC values than in-degree and in-strength indices. In Table 3, out of the 18 highest-rated indices, 14 were in the Fp2 area as the best brain area to predict the rTMS treatment outcome. Finally, from the graph theory indices perspective, the betweenness centrality has the highest AUC-ROC values (Tables 2 and 3). In summary, with the assessment of all graph theory indices, the betweenness centrality in the Fp2 area and the δ frequency band has the highest AUC-ROC value of 0.854 and the P<0.001 in the threshold of 0.7.
4. Discussion
Effective brain connectivity and graph theory criteria were used in this study to predict the rTMS treatment outcome in drug-refractory MDD patients. We calculated most local graph theory indices and found the prefrontal region, especially the Fp2 area in the δ frequency band, a critical brain region for this aim.
The dDTF method provides the best effective brain connectivity. This method calculates direct directed connections and excludes indirect and false connections from the connectivity matrix, unlike the Granger-Geweke causality. This method is one of the multivariate methods based on multichannel AR models that can identify the causal relationships between signals and determine the direct flow of activity between time series. The definition of dDTF measure in the frequency domain allows us to study the role of different EEG rhythms in information processing. Also, the DTF method is based on the phase difference between the time series, so it is insensitive to the effect of volume conductance and robust to noise. Based on the advantages of the dDTF method, it can be concluded that the dDTF method used in this study provides the most effective brain connectivity. Also, physiological evidence shows their efficiency in other brain studies (Blinowska, 2011).
Among all calculated graph theory indices, the betweenness centrality index in the Fp2 area and the δ frequency band have the highest AUC-ROC values (Tables 2 and 3). The betweenness centrality indicates the node connecting different parts of the network, usually characterized by a high centrality. Thus, an area with the highest betweenness centrality mediates the connection of nodes in other brain areas. Therefore, each node with the highest betweenness centrality is more active than the others. The more activity in prefrontal regions in the δ and θ band, especially the Fp2 area in the δ frequency band, indicated the most significant biomarker.
Out-degree and out-strength indices have the highest AUC-ROC values after the betweenness centrality index. These indices represent the source of information and identify the area that is the cause of information flow in the brain network. In Figures 2, the individual node that sends the highest values of brain connectivity has the highest out-degree and out-strength values. A high AUC-ROC value in out-degree and out-strength indicates significant differences between two groups of responders and non-responders to the rTMS treatment. The prefrontal region in the δ and θ band, and in particular the Fp2 region in the δ band, is the source of information, which is expressed by higher differences between out-degree and out-strength indices, corresponding to higher AUC-ROC values in two groups for this target. Other indices, such as in-degree and in-strength indices, specify the network nodes where information flow is imported from other areas. Table 2 indicates that only the T8 node has this property, but since it has a low AUC-ROC value, it is disregarded as an effective biomarker. Consequently, considerable information for distinguishing between responder and non-responder MDD groups is available in the prefrontal region, especially in the Fp2 area. Other brain regions are less involved in this type of disorder. Graph theory indices of this region have significant differences in the δ and θ frequency bands used as one of the rTMS treatment outcome predictors in drug-resistant MDD patients.
The obtained results from graph theory indices indicate that the greatest differences between indices were observed in the δ frequency band and that the significant differences between indices were found in θ and β frequency bands and suitable biomarkers for distinguishing between responder and non-responder groups to rTMS treatment in MDD patients (Tables 2 and 3). As in previous studies (Hunter et al., 2007; Knott et al., 2000; Mumtaz et al., 2017), the indices calculated in δ and θ frequency bands have shown higher efficiency than other frequency bands in classifying the two groups. The considerable changes in connectivity in δ and θ frequency bands in the frontal cortex of MDD patients can be explained from a neurobiological point of view using θ current density in the rostral anterior cingulate cortex (rACC) (Korb et al., 2009; Mulert et al., 2007; Pizzagalli et al., 2001). This region is the cause of the response to different types of medication for depression. The rACC is the hub in the brain default network and is associated with self-focused processing. Besides, the rACC resting-state activity affects rumination, memory, and planning (Simpson et al., 2001). Reflective pondering and brooding are essential elements of rumination and are mechanisms for responding to distress. Increasing the rACC activity may lead to less self-focused and better response to the treatment due to adaptive self-referential functions. Also, the MRI data in depressed patients indicated better functional connectivity discrimination in the rACC than in the other brain regions (Zeng et al., 2014).
5. Conclusion
This study investigated the significant biomarkers that can be used to obtain the rTMS treatment response in drug-resistant MDD patients. Personal medicine approaches will reduce the cost of treatment and increase the treatment method’s effectiveness in psychiatric disorders. With the assessment of several graph theory indices, it is shown that the Fp2 region plays the most significant role in the prediction of the rTMS treatment response in drug-resistance MDD, especially the betweenness centrality in Fp2 and the δ frequency band are the best and have the highest AUC value of 0.854.
For future work, it is suggested that more EEG channels be used to calculate graph theory indices, then feature selection methods, machine learning, and deep learning methods be used to classify the MDD patients who respond to the rTMS.
Ethical Considerations
Compliance with ethical guidelines
The study was approved by the Ethics Committee of Shahid Beheshti University of Medical Sciences (Code: IR.SBMU.MSP.REC.1400. 656).
Funding
This research is financially supported by the Research Department of the School of Medicine, Shahid Beheshti University of Medical Sciences (Grant No.: 29611).
Authors' contributions
Conceptualization, methodology, validation and the original draft preparation: Behrouz Nobakhsh and Ahmad Shalbaf; Supervision and project administration: Ahmad Shalbaf; Software and formal analysis: Behrouz Nobakhsh; Resources and data curation: Reza Rostami and Reza Kazemi; Investigation, review and editing: All authors.
Conflict of interest
The authors declared no conflict of interest.
Acknowledgments
The authors would like to thank Research Department of the School of Medicine, Shahid Beheshti University of Medical Sciences.
References
Arns, M., Cerquera, A., Gutiérrez, R. M., Hasselman, F., & Freund, J. A. (2014). Non-linear EEG analyses predict non-response to rTMS treatment in major depressive disorder. Clinical Neurophysiology, 125(7), 1392–1399. [DOI:10.1016/j.clinph.2013.11.022] [PMID]
American Psychiatric Association. (2000). Diagnostic criteria from dsM-iV-tr. Washington: American Psychiatric Association. [Link]
Beck, A. T., Ward, C. H., Mendelson, M., Mock, J., & Erbaugh, J. (1961). An inventory for measuring depression. Archives of General Psychiatry, 4, 561–571. [DOI:10.1001/archpsyc.1964.01720240015003] [PMID]
Berlim, M. T., Fleck, M. P., & Turecki, G. (2008). Current trends in the assessment and somatic treatment of resistant/refractory major depression: An overview. Annals of Medicine, 40(2), 149-159. [DOI:10.1080/07853890701769728] [PMID]
Beuzon, G., Timour, Q., & Saoud, M. (2017). Predictors of response to repetitive transcranial magnetic stimulation (rTMS) in the treatment of major depressive disorder. L'Encephale, 43(1), 3–9. [DOI:10.1016/j.encep.2016.11.002] [PMID]
Blinowska K. J. (2011). Review of the methods of determination of directed connectivity from multichannel data. Medical & Biological Engineering & Computing, 49(5), 521–529.[DOI:10.1007/s11517-011-0739-x] [PMID] [PMCID]
Brunoni, A. R., Chaimani, A., Moffa, A. H., Razza, L. B., Gattaz, W. F., & Daskalakis, Z. J., et al. (2017). Repetitive transcranial magnetic stimulation for the acute treatment of major depressive episodes: A systematic review with network meta-analysis. JAMA Psychiatry, 74(2), 143–152. [DOI:10.1001/jamapsychiatry.2016.3644] [PMID]
Bullmore, E., & Sporns, O. (2009). Complex brain networks: Graph theoretical analysis of structural and functional systems. Nature Reviews Neuroscience, 10(3), 186-198. [DOI:10.1038/nrn2575] [PMID]
Carpenter, L. L., Janicak, P. G., Aaronson, S. T., Boyadjis, T., Brock, D. G., & Cook, I. A., et al. (2012). Transcranial magnetic stimulation (TMS) for major depression: A multisite, naturalistic, observational study of acute treatment outcomes in clinical practice. Depression and Anxiety, 29(7), 587–596. [DOI:10.1002/da.21969] [PMID]
Chiang, S., & Haneef, Z. (2014). Graph theory findings in the pathophysiology of temporal lobe epilepsy. Clinical Neurophysiology, 125(7), 1295–1305. [DOI:10.1016/j.clinph.2014.04.004] [PMID] [PMCID]
Ciobanu, C., Girard, M., Marin, B., Labrunie, A., & Malauzat, D. (2013). rTMS for pharmacoresistant major depression in the clinical setting of a psychiatric hospital: Effectiveness and effects of age. Journal of Affective Disorders, 150(2), 677–681. [DOI:10.1016/j.jad.2013.03.024] [PMID]
Delorme, A., & Makeig, S. (2004). EEGLAB: An open source toolbox for analysis of single-trial EEG dynamics including independent component analysis. Journal of Neuroscience Methods, 134(1), 9–21. [DOI:10.1016/j.jneumeth.2003.10.009] [PMID]
Delorme, A., Mullen, T., Kothe, C., Akalin Acar, Z., Bigdely-Shamlo, N., & Vankov, A., et al. (2011). EEGLAB, SIFT, NFT, BCILAB, and ERICA: New tools for advanced EEG processing. Computational Intelligence and Neuroscience, 2011, 130714. [DOI:10.1155/2011/130714] [PMID] [PMCID]
Erguzel, T. T., Ozekes, S., Tan, O., & Gultekin, S. (2015). Feature selection and classification of electroencephalographic signals: An artificial neural network and genetic algorithm based approach. Clinical EEG and Neuroscience, 46(4), 321–326. [DOI:10.1177/1550059414523764] [PMID]
Fay, M. P., & Proschan, M. A. (2010). Wilcoxon-mann-whitney or t-test? On assumptions for hypothesis tests and multiple interpretations of decision rules. Statistics Surveys, 4, 1–39. [DOI:10.1214/09-SS051] [PMID] [PMCID]
Fink, M. (2001). Convulsive therapy: A review of the first 55 years. Journal of Affective Disorders, 63(1-3), 1-15. [DOI:10.1016/S0165-0327(00)00367-0]
First, M. B. (1997). Structured clinical interview for DSM-IV axis I disorders SCID-I. Washington: American Psychiatric Press. [Link]
Fregni, F., Marcolin, M. A., Myczkowski, M., Amiaz, R., Hasey, G., & Rumi, D. O., et al. (2006). Predictors of antidepressant response in clinical trials of transcranial magnetic stimulation. The International Journal of Neuropsychopharmacology, 9(6), 641–654. [DOI:10.1017/S1461145705006280] [PMID]
Friston K. J. (2011). Functional and effective connectivity: A review. Brain Connectivity, 1(1), 13–36. [DOI:10.1089/brain.2011.0008] [PMID]
Hasanzadeh, F., Mohebbi, M., & Rostami, R. (2019). Prediction of rTMS treatment response in major depressive disorder using machine learning techniques and nonlinear features of EEG signal. Journal of Affective Disorders, 256, 132–142. [DOI:10.1016/j.jad.2019.05.070] [PMID]
Huang, C. C., Wei, I. H., Chou, Y. H., & Su, T. P. (2008). Effect of age, gender, menopausal status, and ovarian hormonal level on rTMS in treatment-resistant depression. Psychoneuroendocrinology, 33(6), 821–831. [DOI:10.1016/j.psyneuen.2008.03.006] [PMID]
Hunter, A. M., Cook, I. A., & Leuchter, A. F. (2007). The promise of the quantitative electroencephalogram as a predictor of antidepressant treatment outcomes in major depressive disorder. The Psychiatric Clinics of North America, 30(1), 105–124. [DOI:10.1016/j.psc.2006.12.002] [PMID]
Im, C.H., & Lee, C. (2006). Computer-aided performance evaluation of a multichannel transcranial magnetic stimulation system. IEEE Transactions on Magnetics, 42(12), 3803-3808. [DOI:10.1109/TMAG.2006.883913]
Kamiński, M. J., & Blinowska, K. J. (1991). A new method of the description of the information flow in the brain structures. Biological Cybernetics, 65(3), 203–210. [DOI:10.1007/BF00198091] [PMID]
Knott, V., Mahoney, C., Kennedy, S., & Evans, K. (2000). Pre-treatment EEG and it's relationship to depression severity and paroxetine treatment outcome. Pharmacopsychiatry, 33(6), 201–205. [DOI:10.1055/s-2000-8356] [PMID]
Korb, A. S., Hunter, A. M., Cook, I. A., & Leuchter, A. F. (2009). Rostral anterior cingulate cortex theta current density and response to antidepressants and placebo in major depression. Clinical Neurophysiology, 120(7), 1313–1319. [DOI:10.1016/j.clinph.2009.05.008] [PMID] [PMCID]
Mamitsuka, H. (2006). Selecting features in microarray classification using ROC curves. Pattern Recognition, 39(12), 2393-2404. [DOI:10.1016/j.patcog.2006.07.010]
Mayberg, H. S., Brannan, S. K., Tekell, J. L., Silva, J. A., Mahurin, R. K., & McGinnis, S., et al. (2000). Regional metabolic effects of fluoxetine in major depression: Serial changes and relationship to clinical response. Biological Psychiatry, 48(8), 830–843. [DOI:10.1016/S0006-3223(00)01036-2] [PMID]
Milev, R. V., Giacobbe, P., Kennedy, S. H., Blumberger, D. M., Daskalakis, Z. J., & Downar, J., et al. (2016). Canadian network for mood and anxiety treatments (CANMAT) 2016 clinical guidelines for the management of adults with major depressive disorder: Section 4. Neurostimulation treatments. Canadian Journal of Psychiatry. Revue Canadienne de Psychiatrie, 61(9), 561–575. [DOI:10.1177/0706743716660033] [PMID] [PMCID]
Mulert, C., Juckel, G., Brunnmeier, M., Karch, S., Leicht, G., & Mergl, R., et al. (2007). Rostral anterior cingulate cortex activity in the theta band predicts response to antidepressive medication. Clinical EEG and Neuroscience, 38(2), 78–81. [DOI:10.1177/155005940703800209] [PMID]
Mullen, T. (2010). Source information flow toolbox (SIFT). San Diego: Swartz Center for Computational Neuroscience. [Link]
Mullen, T. (2012). CleanLine EEGLAB plugin. San Diego, CA: Neuroimaging Informatics Toolsand Resources Clearinghouse (NITRC). [Link]
Mumtaz, W., Xia, L., Mohd Yasin, M. A., Azhar Ali, S. S., & Malik, A. S. (2017). A wavelet-based technique to predict treatment outcome for major depressive disorder. Plos One, 12(2), e0171409. [DOI:10.1371/journal.pone.0171409] [PMID] [PMCID]
O'Reardon, J. P., Solvason, H. B., Janicak, P. G., Sampson, S., Isenberg, K. E., & Nahas, Z., et al. (2007). Efficacy and safety of transcranial magnetic stimulation in the acute treatment of major depression: A multisite randomized controlled trial. Biological Psychiatry, 62(11), 1208–1216. [DOI:10.1016/j.biopsych.2007.01.018] [PMID]
Olejarczyk, E., & Jernajczyk, W. (2017). Graph-based analysis of brain connectivity in schizophrenia. Plos One, 12(11), e0188629. [DOI:10.1371/journal.pone.0188629] [PMID] [PMCID]
World Health Organization (WHO). Depression. Retrieved from: [Link]
Pizzagalli, D., Pascual-Marqui, R. D., Nitschke, J. B., Oakes, T. R., Larson, C. L., & Abercrombie, H. C., et al. (2001). Anterior cingulate activity as a predictor of degree of treatment response in major depression: Evidence from brain electrical tomography analysis. The American Journal of Psychiatry, 158(3), 405–415. [DOI:10.1176/appi.ajp.158.3.405] [PMID]
Rostami, R., Kazemi, R., Nitsche, M. A., Gholipour, F., & Salehinejad, M. A. (2017). Clinical and demographic predictors of response to rTMS treatment in unipolar and bipolar depressive disorders. Clinical Neurophysiology, 128(10), 1961–1970. [DOI:10.1016/j.clinph.2017.07.395] [PMID]
Rubinov, M., & Sporns, O. (2010). Complex network measures of brain connectivity: Uses and interpretations. NeuroImage, 52(3), 1059–1069. [DOI:10.1016/j.neuroimage.2009.10.003] [PMID]
Shalbaf, A., Bagherzadeh, S., & Maghsoudi, A. (2020). Transfer learning with deep convolutional neural network for automated detection of schizophrenia from EEG signals. Physical and Engineering Sciences in Medicine, 43(4), 1229–1239. [DOI:10.1007/s13246-020-00925-9] [PMID]
Shalbaf, A., Shalbaf, R., Saffar, M., & Sleigh, J. (2020). Monitoring the level of hypnosis using a hierarchical SVM system. Journal of Clinical Monitoring and Computing, 34(2), 331–338. [DOI:10.1007/s10877-019-00311-1] [PMID]
Shalbaf, R., Brenner, C., Pang, C., Blumberger, D. M., Downar, J., & Daskalakis, Z. J., et al. (2018). Non-linear entropy analysis in EEG to predict treatment response to repetitive transcranial magnetic stimulation in depression. Frontiers in Pharmacology, 9, 1188. [DOI:10.3389/fphar.2018.01188] [PMID] [PMCID]
Shiozawa, P., Raza, R., Cordeiro, Q., & Brunoni, A. R. (2015). Clinical applications of neuromodulation in psychiatry. In H. Knotkova., & D. Rasche (Eds.), Textbook of neuromodulation (pp. 171-185). Berlin: Springer. [DOI:10.1007/978-1-4939-1408-1_14]
Silverstein, W. K., Noda, Y., Barr, M. S., Vila-Rodriguez, F., Rajji, T. K., & Fitzgerald, P. B., et al. (2015). Neurobiological predictors of response to dorsolateral prefrontal cortex repetitive transcranial magnetic stimulation in depression: A systematic review. Depression and Anxiety, 32(12), 871–891. [DOI:10.1002/da.22424] [PMID]
Simpson, J. R., Jr, Snyder, A. Z., Gusnard, D. A., & Raichle, M. E. (2001). Emotion-induced changes in human medial prefrontal cortex: I. during cognitive task performance. Proceedings of the National Academy of Sciences of the United States of America, 98(2), 683–687. [DOI:10.1073/pnas.98.2.683] [PMID] [PMCID]
van den Heuvel, M. P., & Hulshoff Pol, H. E. (2010). Exploring the brain network: A review on resting-state fMRI functional connectivity. European Neuropsychopharmacology, 20(8), 519–534. [DOI:10.1016/j.euroneuro.2010.03.008] [PMID]
Zeng, L. L., Shen, H., Liu, L., & Hu, D. (2014). Unsupervised classification of major depression using functional connectivity MRI. Human Brain Mapping, 35(4), 1630–1641. [DOI:10.1002/hbm.22278] [PMID] [PMCID]
Major depressive disorder (MDD) is a common mental disorder that currently affects over 264 million people of different ages. Depression is a significant cause of disability and contributes to the overall burden of illness associated with personal, social, and economic problems (Organization, 2017; Shiozawa et al., 2015). People with MDD experience symptoms such as low and chronic mood, decreased pleasure from previous activities, sleep disorders, mental retardation, fatigue and energy loss, weight change, and negative thoughts. They also suffer from pessimism to sin and suicidal thoughts (Association, 2000).
Medicines and psychotherapy are the first lines of treatment for MDD. However, around one-third of patients fail to respond to these treatments and are identified as treatment-resistant MDD patients (Berlim et al., 2008). Electroconvulsive therapy (ECT) and repetitive transcranial magnetic stimulation (rTMS) are non-pharmacological treatments for drug-resistant MDD patients. ECT has anesthesia risk, memory changes, and social stigmatization, whereas the rTMS is less invasive and painful than the ECT (Fink, 2001; Im & Lee, 2006; O’Reardon et al., 2007). In rTMS, based on the patient and treatment procedure stimulation parameters, such as coil shape, intensity, frequency, train duration, and inter-train interval, a series of magnetic pulses are applied to the cerebral cortex. These magnetic pulses can modulate the neuronal activity of target points (Beuzon et al., 2017). rTMS can change brain activity according to its frequency. High frequency (HF) (usually ≥10 Hz) is used to stimulate the target point, whereas low frequency (LF) (usually ≤1 Hz) inhibits the target point (Milev et al., 2016). Due to the left hypoactivity and right hyperactivity dorsolateral prefrontal cortex (DLPFC) in MDD patients, HF rTMS and LF rTMS are applied to the left and right DLPFC, respectively (Brunoni et al., 2017; Mayberg et al., 2000). Recent studies indicate that the success rate of rTMS treatment in people with MDD is about 50%-55% (Carpenter et al., 2012; Ciobanu et al., 2013). Because the rTMS treatment period is long (about 20 sessions) and the costs on healthcare systems are high, predicting the response to treatment through a personalized medicine approach is necessary and helps clinical decisions (Silverstein et al., 2015).
Currently, the prescription of rTMS treatment is based on clinical evaluation and lacks sufficient accuracy to predict the rTMS treatment outcome, especially before starting the treatment (Shalbaf et al., 2018). In one study, demographic indicators, depressive characteristics, and medicinal history were used as clinical predictors, and results demonstrated that MDD patients who are younger and show less refractory to medication have a better response to the rTMS treatment (Fregni et al., 2006). Another study, in addition to age, examined the effects of gender, menopausal status, and ovarian hormone levels in women. It was shown that there was no difference in rTMS response between men and premenopausal women (68.8% and 70.6%, respectively). Besides, the rTMS treatment outcome in postmenopausal women is low. The regression analysis has indicated that menopause and ovarian steroid levels play a key role in the rTMS treatment outcome in women (Huang et al., 2008). In one study, Rostami et al. evaluated clinical and demographic data. Based on the results, the patients with better cognitive-emotional symptoms respond better to rTMS treatment than the somatic symptoms (Rostami et al., 2017). As observed in these studies, due to the MDD patients’ differences in individual characteristics and brain structures, clinical data lack sufficient accuracy in predicting the rTMS treatment outcome.
The search for biomarkers to predict the rTMS treatment outcome in MDD patients has expanded on neuroimaging methods based on electroencephalogram (EEG). Clinicians frequently use EEG to identify effective biomarkers. EEG has many advantages, including ease of use, sufficient temporal resolution, non-invasiveness, and accessibility in the clinic (Shalbafet al., 2020a; Shalbaf et al., 2020b). Several linear and non-linear measures from EEG signals have been proposed as predictors of the rTMS treatment outcome in patients with drug-resistant MDD. One study used non-linear EEG features, including Lempel-Ziv complexity (LZC) and the largest Lyapunov exponent in an α frequency band. Non-responders indicated a significant decrease in LZC, while responders showed an increase in LZC (Arns et al., 2014). In another study, MDD patients were classified into responder and non-responder for rTMS treatment using feature selection of EEG signals based on a genetic algorithm and an artificial neural network (Erguzel et al., 2015). In other studies, additional features such as permutation entropy (Shalbaf et al., 2018), Katz fractal dimension, and correlation dimension (Hasanzadeh et al., 2019) were extracted from EEG signals and examined to predict the rTMS treatment outcome in drug-resistant MDD patients. These methods contribute to analyzing the complexity of EEG signals, but the EEG signal is non-stationary, and these methods have limitations in estimating accurate temporal patterns.
Neuroimaging techniques reveal that a single EEG channel cannot represent complicated neurophysiological changes in psychiatric disorders. Recent research has indicated that the human brain is a complex integrated network consisting of interconnected brain areas to form subnets of the brain. Examining these networks can provide a new perspective on how the brain works. Consequently, understanding the brain’s neural dynamic patterns and behavior provides the best features to predict rTMS treatment response. Complex interactions across brain regions can be described through functional and effective brain connectivity measures (Friston, 2011). Functional connectivity indicates only coordinated activity and statistical dependency between brain areas, while effective connectivity provides information about the causal relationship between brain areas (Olejarczyk & Jernajczyk, 2017). Granger causality (GC) is widely used to estimate the effective brain connectivities that characterize the directed information flow and causal interaction between time series of EEG signals. Graph theory methods are often used for quantitative analysis of brain connection. Graph theory is a theoretical platform to examine complex networks like the brain, which can provide valuable information about the local organization of the functional brain networks (Van Den Heuvel & Pol, 2010).
The novelties of the current study are the use of effective brain connectivity measures by pretreatment EEG signals to estimate the graph theory indices, which helps identify the brain’s complex networks and its best patterns to find significant biomarkers between two groups of responder and non-responder MDD patients. These findings will lead to a decrease in the time and cost of the patients before starting the rTMS treatment.
2. Materials and Methods
Participants and clinical assessment
The EEG data were recorded at the Atieh Clinical Neuroscience Center from 34 MDD patients refractory to medication (Mean±SD age: 37.1±13.4 years, 25 women) who were referred for rTMS treatment. An experienced psychiatrist, based on the structured clinical interviews for axis I DSM-IV (First, 1997), made the diagnosis of MDD, and the patient was subjected to a baseline clinical assessment using the beck depression inventory (BDI-II) (Beck et al., 1961). This inventory has 21 self-report questions dealing with the status of the subjects in their past week. Each question consists of four answers ranging in intensity. All MDD patients received 20 sessions of rTMS treatment, three sessions per week, in the right DLPFC area of the brain. BDI scores for all MDD patients were assessed one week before rTMS treatment and after 20 sessions of rTMS. A reduction of at least 50% of the total BDI score is defined as the rTMS treatment outcome. In the current study, the participants’ written consent was obtained, and the study was authorized by Shahid Beheshti University of Medical Sciences Ethics Committee. The demographic data and clinical characteristics of participants are summarized in Table 1.
rTMS treatment parameters
Atieh Clinical Neuroscience Center utilizes a Neuro MS rTMS device (Neurosoft, Russia) for patients referred for the rTMS treatment. Magnetic pulses are delivered through a 70-mm stimulation coil (air film coil). Each patient's motor threshold is defined as the lowest intensity needed to stimulate the motor cortex that causes a contraction of the abductor pollicis brevis (APB) muscle in at least 5 out of 10 attempts. The coil position is 5 cm anterior along a parasagittal line from the site of optimum APB stimulation. All patients received the LF-rTMS protocol. This protocol delivered stimulation over the right DLPFC, at 120% of the resting motor threshold, for 10 s at 1-Hz with 2 s intervals. This procedure is repeated 200 times (2000 pulses) per session (40000 pulses over 20 sessions).
Pretreatment EEG acquisition
All EEG signals were recorded in the resting state with closed eyes condition for 300 seconds with 19 channels of Ag/AgCl electrodes (Mitsar-EEG 201 machine). The position of the electrodes was according to the 10-20 standard (Fp1, Fp2, F7, F3, Fz, F4, F8, T7, C3, Cz, C4, T8, P7, P3, Pz, P4, P8, O1, and O2) and the sampling rate of recorded EEG signals was 250 Hz.
EEG preprocessing
The EEGLAB open-source toolbox (Delorme & Makeig, 2004) has been used to preprocess and remove the environmental and movement noise from EEG data. At first, a high-pass filter (1 Hz) purified EEG signals and removed the baseline drift. EEG signals were re-referenced by the average reference. The CleanLine open-source plugin (Mullen, 2012) in the EEGLAB toolbox has been used to remove the line noise from EEG signal channels. This plugin uses a sliding window to estimate sine wave amplitude to decrease, and in comparison with a notch filter, it does not make a hole in the EEG spectrum. EEG data were cleaned visually by the “reject continuous data by eye” section to remove the motion artifacts (that existed in all channels). After relative cleanliness, independent component analysis (ICA) was utilized to clean the data from blinking and head movements. In the end, we hold 150 seconds of all subjects to unify the data.
Effective connectivity
Effective connectivity provides information on the causal interaction relationship between the time series of EEG signals and characterizes the directed information flow (Olejarczyk & Jernajczyk, 2017). Effective connectivity is extracted by the SIFT open-source plugin (Delorme et al., 2011) in the EEGLAB toolbox. The Granger causality (GC) is widely used to calculate effective brain connectivities. The directed transfer function (DTF) is a GC-based scale defined in the frequency domain and could be computed based on a multivariate autoregressive model (MVAR) (Kaminski & Blinowska, 1991). For an X(t) as -channel multivariate time series, it obtains (Equations 1 and 2):
Coefficients of A and E(t) are k×k -sized matrices and -size vectors, respectively. Then, the model is transformed into a multivariate autoregressive in the frequency domain to obtain the system transfer matrix (Equation 3):
The filter coefficients matrix H(f) is known as the system transfer matrix. The transfer matrix makes it possible to find cross-spectra and partial coherences (Equation 4):
, Where Cij(f) is partial coherence and is a minor of the spectral matrix, and the DTF modification (Fij2(f)) concerns the function normalization to make the denominator independent of frequency. The dDTF (χij(f)) indicates direct propagation from channel j to i (Equation 5):
There exists a direct causal relationship between channels j→i when both functions Fij2(f) and Cij2(f) are non-zero. So, the dDTF method has compensated for the lack of other effective connectivities by combining the advantages of DTF and partial coherence methods and has indicated more reliable effective connectivity.
Graph analysis
Graph theory analysis has been used to obtain a new perspective on complex networks like the brain. The brain’s nervous system is a complex network that can be modeled as a graph. The EEG channels (brain regions) are nodes, and the edges represent the brain connections calculated by the dDTF method. As a result, brain function based on graph indices can be assessed (Rubinov & Sporns, 2010). For each obtained graph, the local indices have been calculated (Bullmore & Sporns, 2009; Rubinov & Sporns, 2010). The first index is degree; the node’s degree represents the number of neighbors connected to the given node. This index can be computed as inward and outward links, in-degree and out-degree, respectively. Each edge (link) has a weight that indicates whether the connection is strong or weak. Strength is the sum of all neighboring link weights. Furthermore, the strength of nodes can be computed inward and outward links as in-strength and out-strength. Another important graph-based index is centrality, which makes it possible to assess the node’s importance in interactions with other nodes (Chiang & Haneef, 2014). Betweenness centrality calculates these types of nodes and demonstrates the fraction of all shortest paths in the network that pass across a given node. Graph-based indices are calculated using functions implemented in the BCT open-source toolbox (Rubinov & Sporns, 2010).
Statistical analysis
The statistical analysis assesses the significance of the extracted features. The current study has used the Wilcoxon rank-sum test to examine the sample independence of the two groups (Fay & Proschan, 2010). The area under the receiver operating characteristic curve (AUC-ROC) has been used to evaluate the performance of two group classification algorithms to select the best features (Mamitsuka, 2006).
Overview of the proposed method
The proposed method’s block diagram is summarized in Figure 1. First, the raw EEG data will be processed using the EEGLAB open-source toolbox. The preprocessing block removes the environmental and subject artifacts to extract the pure brain activity, including frequency filtering and line noise cancellation, artifacts removal, ICA (to remove blinking and head movements), and time correction. Then, the effective brain connectivity between 19 EEG signal channels is calculated using the dDTF method in all frequency bands of the δ, θ, α, β, and γ and used as the extracted feature using the SIFT plugin (Mullen, 2010) in the EEGLAB toolbox. The connectivity matrix (dDTF) is 19×19 per patient. In the following, brain function is modeled as a graph by the dDTF method and examined with the local graph theory indices such as degree, out-degree, in-degree, strength, out-strength, in-strength, and betweenness centrality. Finally, the Wilcoxon rank-sum test (P) and AUC-ROC are utilized to identify the best indices and significant biomarkers to predict the rTMS treatment outcome in MDD patients refractory to drugs.
3. Results
After preprocessing, each EEG data was segmented into a window length of 10 seconds. The dDTF values indicate a causal relationship between different brain areas based on the parameters of the MVAR model. The dDTF brain connectivity features have been extracted in the δ (1-4 Hz), θ (4-8 Hz), α (8-12 Hz), β (12-30 Hz), and γ (30-40 Hz) frequency bands, separately. The MVAR model parameters have been selected according to the autocorrelation function and portmanteau tests (model order=12). Autocorrelation function and portmanteau tests have been used to pass the order selection criteria (whiteness, consistency, and stability). The dDTF method calculated the connectivity matrix by 10-s windows, and the mean values of the 15 windows (150 s) from the whole signal were assigned as a connectivity matrix for each patient. Then, the brain is modeled as a graph so that nodes represent EEG channels (brain regions) and edges represent the brain connections determined by the dDTF method. Figure 2 illustrates the normalized mean values of brain connectivity matrices and the causal relationship between different brain areas calculated by the dDTF method for responding and non-responding MDD patients in δ, θ, α, β, and γ frequency bands separately.
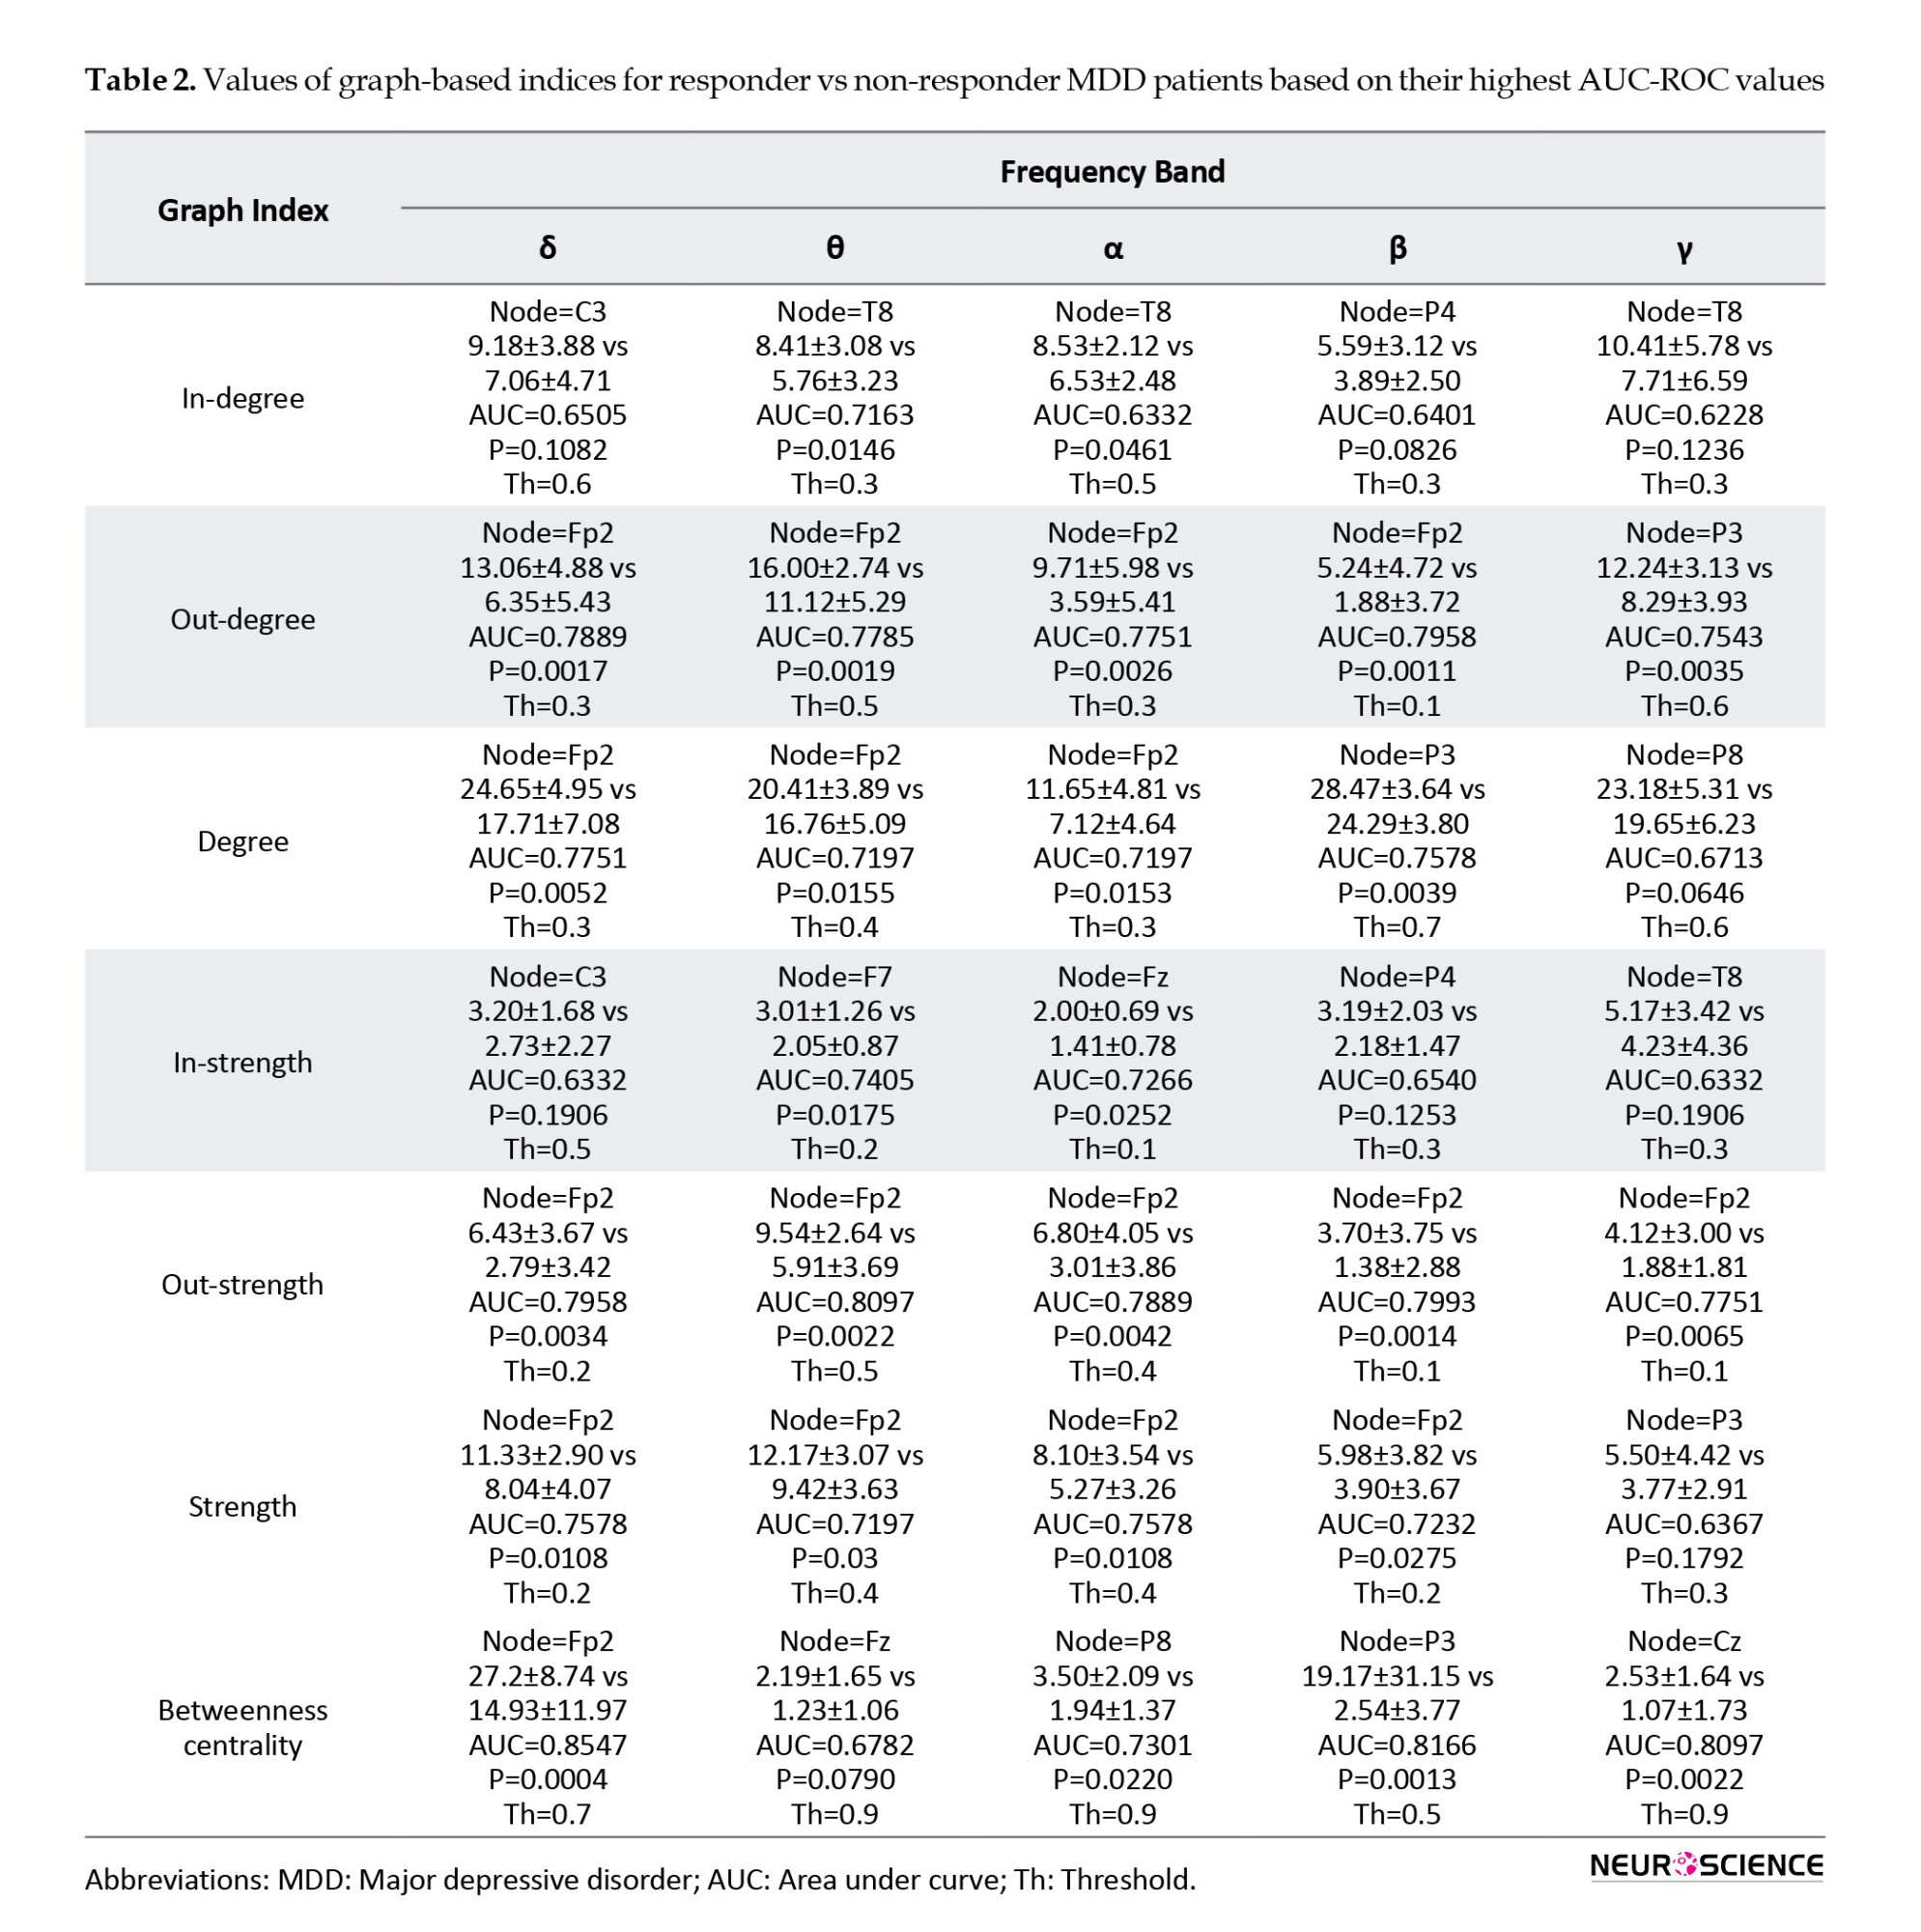
Next, the brain function is examined with the graph theory indices using the embedded functions in the BCT open-source toolbox. Local indices, including degree, out-degree, in-degree, strength, out-strength, in-strength, and betweenness centrality, were calculated for each obtained graph. Graph theory indices for each node (EEG channels) were calculated for all frequency bands at different thresholds (for example, at the 70% threshold, 30% of the weakest connections in the brain connectivity matrix were removed). The Wilcoxon rank-sum test (P) and the AUC-ROC were used to identify the best indices that predict the rTMS treatment outcome. The results of this process, including the Mean±SD values of the graph theory indices for responder versus non-responder MDD patients for each frequency band with the highest AUC-ROC, are reported in Table 2 separately. In other words, each graph theory index has been calculated at different nodes and thresholds, and the best one based on the highest AUC-ROC is reported in Table 2.
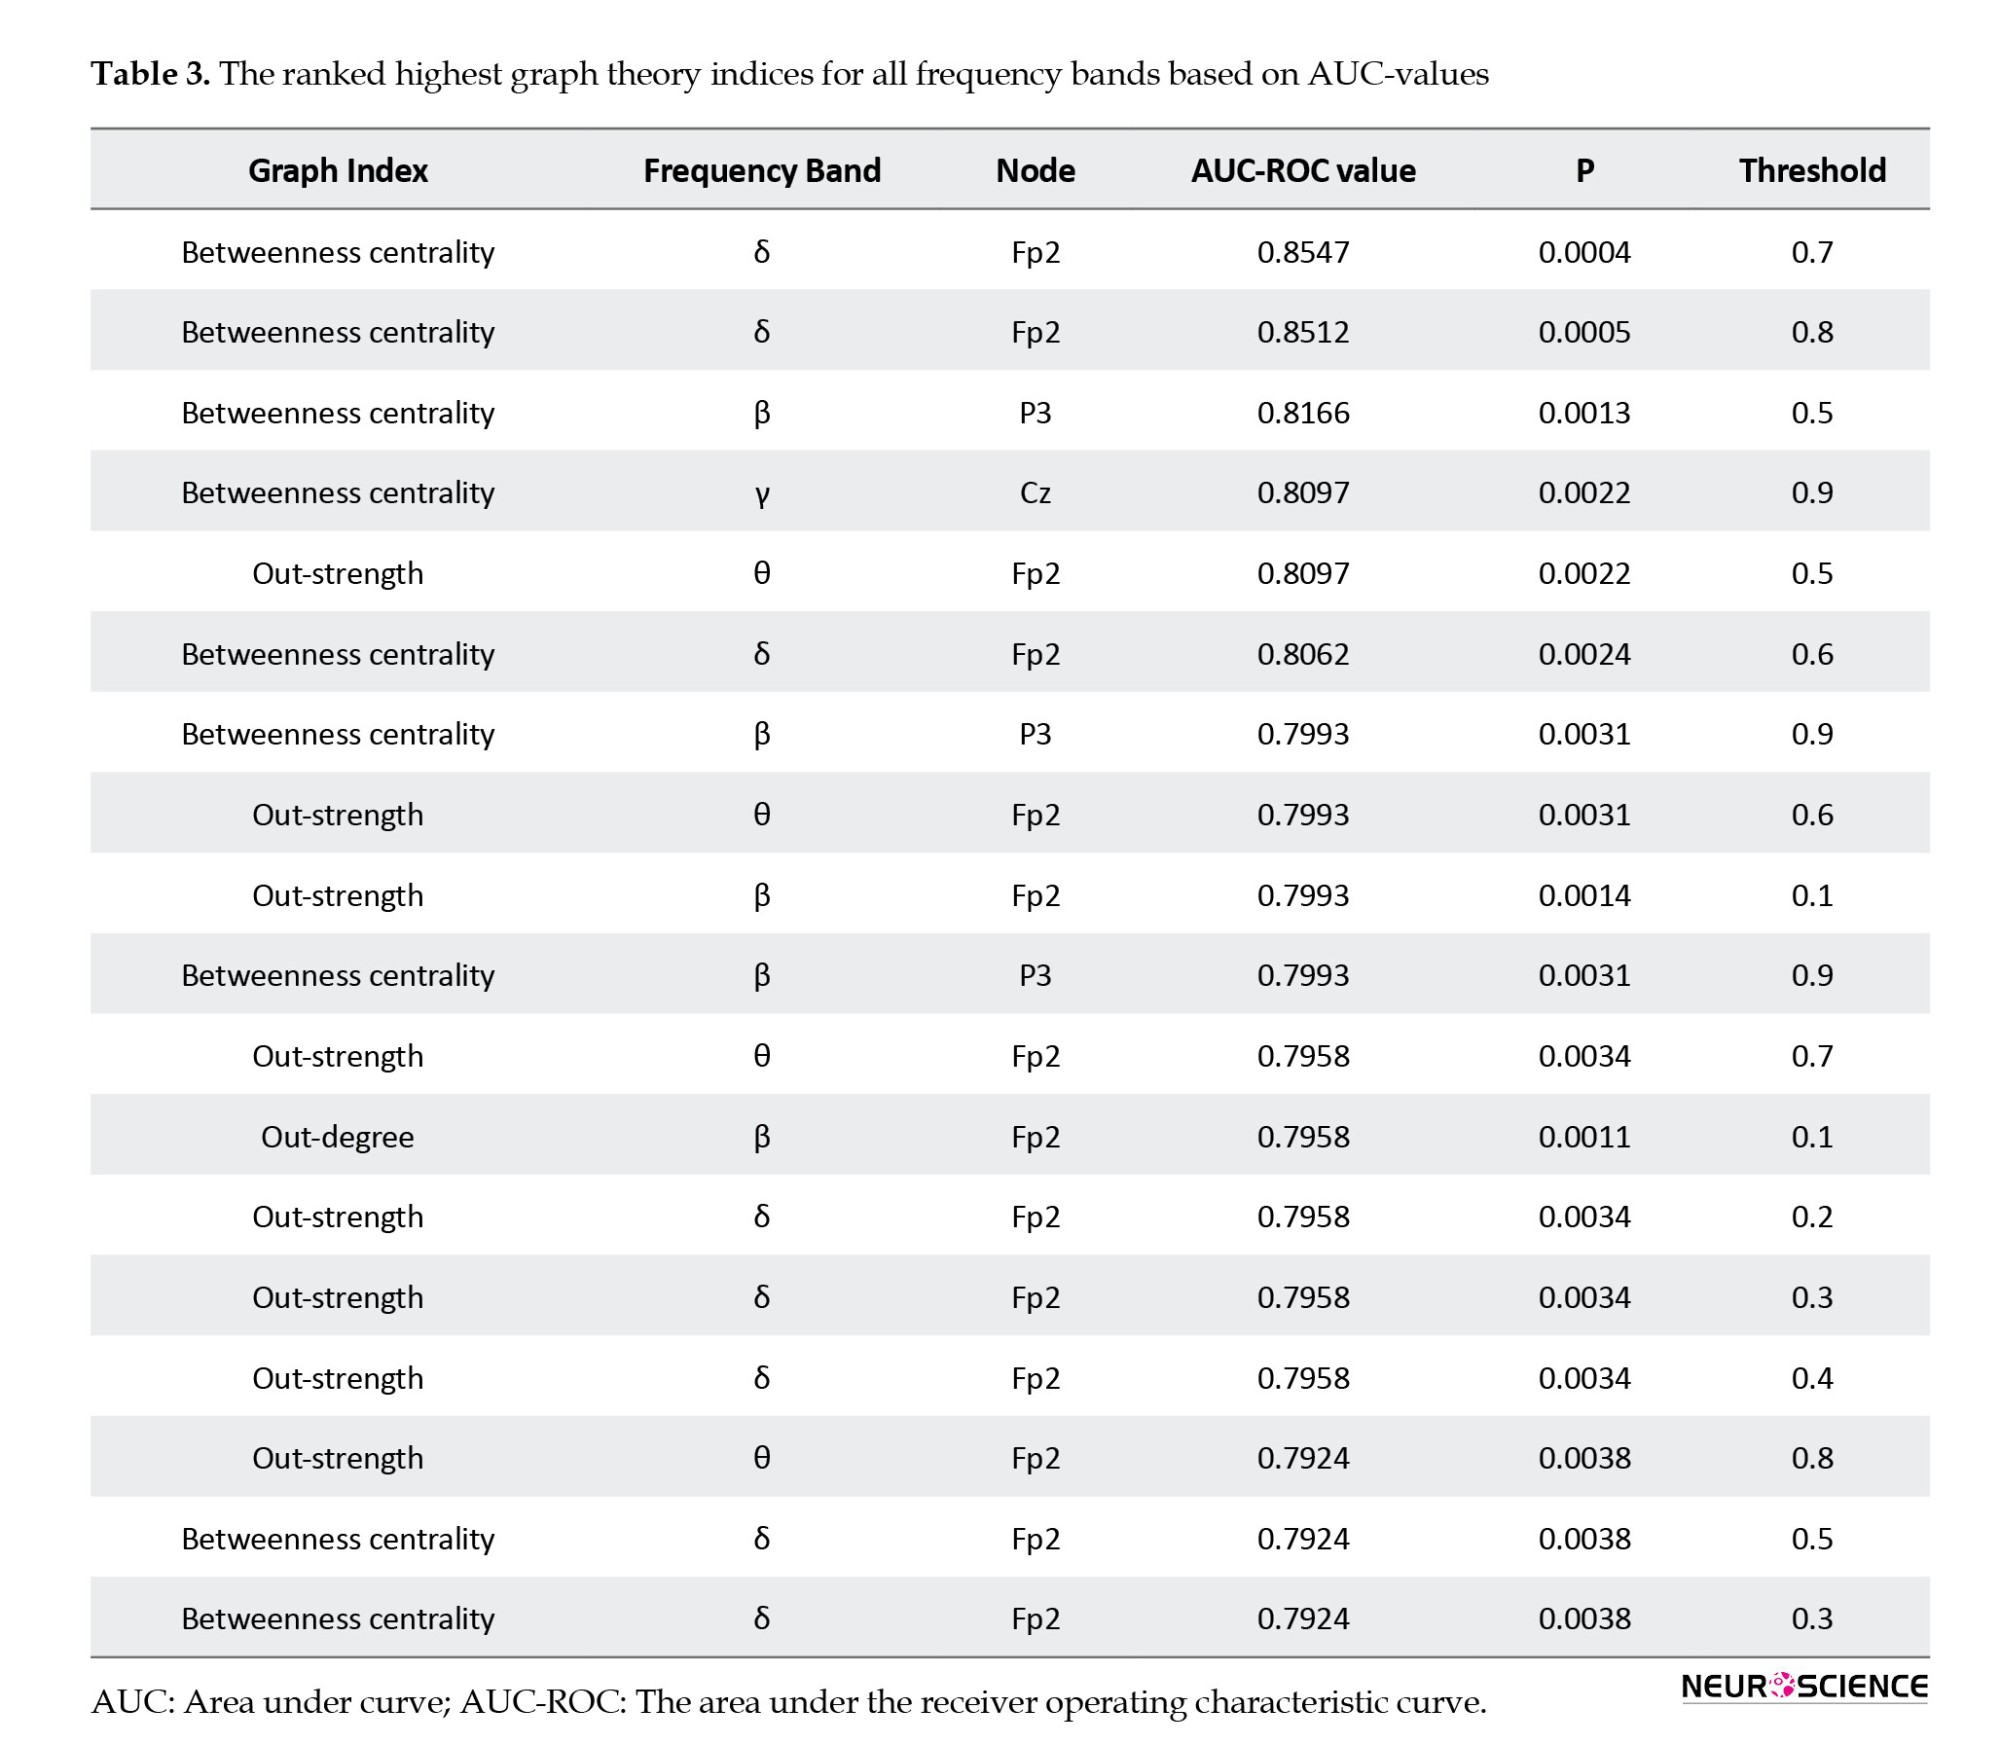
For example, in betweenness centrality at the δ band, the Fp2 node at the threshold of 0.7 have the highest AUC-ROC (0.85) and P<0.001. Also, the best graph theory indices for all frequency bands based on AUC-ROC are reported in Table 3. According to Table 2, graph theory indices have the highest AUC-ROC values in the δ and θ bands. By examining the AUC-ROC values of graph theory indices, it is notable that the degree, strength, and betweenness centrality in the δ frequency band and in-degree, out-strength, and in-strength in the θ frequency band have the highest AUC-ROC values. Also, by assessing the most notable brain areas, the Fp2 node has the highest AUC-ROC values (Tables 2 and 3). According to Table 2, degree, strength, out-degree, out-strength, and betweenness centrality in the Fp2 area have the highest AUC-ROC values. The Fp2 area is a source of information for this target, and therefore, out-degree and out-strength indices have higher AUC-ROC values than in-degree and in-strength indices. In Table 3, out of the 18 highest-rated indices, 14 were in the Fp2 area as the best brain area to predict the rTMS treatment outcome. Finally, from the graph theory indices perspective, the betweenness centrality has the highest AUC-ROC values (Tables 2 and 3). In summary, with the assessment of all graph theory indices, the betweenness centrality in the Fp2 area and the δ frequency band has the highest AUC-ROC value of 0.854 and the P<0.001 in the threshold of 0.7.
4. Discussion
Effective brain connectivity and graph theory criteria were used in this study to predict the rTMS treatment outcome in drug-refractory MDD patients. We calculated most local graph theory indices and found the prefrontal region, especially the Fp2 area in the δ frequency band, a critical brain region for this aim.
The dDTF method provides the best effective brain connectivity. This method calculates direct directed connections and excludes indirect and false connections from the connectivity matrix, unlike the Granger-Geweke causality. This method is one of the multivariate methods based on multichannel AR models that can identify the causal relationships between signals and determine the direct flow of activity between time series. The definition of dDTF measure in the frequency domain allows us to study the role of different EEG rhythms in information processing. Also, the DTF method is based on the phase difference between the time series, so it is insensitive to the effect of volume conductance and robust to noise. Based on the advantages of the dDTF method, it can be concluded that the dDTF method used in this study provides the most effective brain connectivity. Also, physiological evidence shows their efficiency in other brain studies (Blinowska, 2011).
Among all calculated graph theory indices, the betweenness centrality index in the Fp2 area and the δ frequency band have the highest AUC-ROC values (Tables 2 and 3). The betweenness centrality indicates the node connecting different parts of the network, usually characterized by a high centrality. Thus, an area with the highest betweenness centrality mediates the connection of nodes in other brain areas. Therefore, each node with the highest betweenness centrality is more active than the others. The more activity in prefrontal regions in the δ and θ band, especially the Fp2 area in the δ frequency band, indicated the most significant biomarker.
Out-degree and out-strength indices have the highest AUC-ROC values after the betweenness centrality index. These indices represent the source of information and identify the area that is the cause of information flow in the brain network. In Figures 2, the individual node that sends the highest values of brain connectivity has the highest out-degree and out-strength values. A high AUC-ROC value in out-degree and out-strength indicates significant differences between two groups of responders and non-responders to the rTMS treatment. The prefrontal region in the δ and θ band, and in particular the Fp2 region in the δ band, is the source of information, which is expressed by higher differences between out-degree and out-strength indices, corresponding to higher AUC-ROC values in two groups for this target. Other indices, such as in-degree and in-strength indices, specify the network nodes where information flow is imported from other areas. Table 2 indicates that only the T8 node has this property, but since it has a low AUC-ROC value, it is disregarded as an effective biomarker. Consequently, considerable information for distinguishing between responder and non-responder MDD groups is available in the prefrontal region, especially in the Fp2 area. Other brain regions are less involved in this type of disorder. Graph theory indices of this region have significant differences in the δ and θ frequency bands used as one of the rTMS treatment outcome predictors in drug-resistant MDD patients.
The obtained results from graph theory indices indicate that the greatest differences between indices were observed in the δ frequency band and that the significant differences between indices were found in θ and β frequency bands and suitable biomarkers for distinguishing between responder and non-responder groups to rTMS treatment in MDD patients (Tables 2 and 3). As in previous studies (Hunter et al., 2007; Knott et al., 2000; Mumtaz et al., 2017), the indices calculated in δ and θ frequency bands have shown higher efficiency than other frequency bands in classifying the two groups. The considerable changes in connectivity in δ and θ frequency bands in the frontal cortex of MDD patients can be explained from a neurobiological point of view using θ current density in the rostral anterior cingulate cortex (rACC) (Korb et al., 2009; Mulert et al., 2007; Pizzagalli et al., 2001). This region is the cause of the response to different types of medication for depression. The rACC is the hub in the brain default network and is associated with self-focused processing. Besides, the rACC resting-state activity affects rumination, memory, and planning (Simpson et al., 2001). Reflective pondering and brooding are essential elements of rumination and are mechanisms for responding to distress. Increasing the rACC activity may lead to less self-focused and better response to the treatment due to adaptive self-referential functions. Also, the MRI data in depressed patients indicated better functional connectivity discrimination in the rACC than in the other brain regions (Zeng et al., 2014).
5. Conclusion
This study investigated the significant biomarkers that can be used to obtain the rTMS treatment response in drug-resistant MDD patients. Personal medicine approaches will reduce the cost of treatment and increase the treatment method’s effectiveness in psychiatric disorders. With the assessment of several graph theory indices, it is shown that the Fp2 region plays the most significant role in the prediction of the rTMS treatment response in drug-resistance MDD, especially the betweenness centrality in Fp2 and the δ frequency band are the best and have the highest AUC value of 0.854.
For future work, it is suggested that more EEG channels be used to calculate graph theory indices, then feature selection methods, machine learning, and deep learning methods be used to classify the MDD patients who respond to the rTMS.
Ethical Considerations
Compliance with ethical guidelines
The study was approved by the Ethics Committee of Shahid Beheshti University of Medical Sciences (Code: IR.SBMU.MSP.REC.1400. 656).
Funding
This research is financially supported by the Research Department of the School of Medicine, Shahid Beheshti University of Medical Sciences (Grant No.: 29611).
Authors' contributions
Conceptualization, methodology, validation and the original draft preparation: Behrouz Nobakhsh and Ahmad Shalbaf; Supervision and project administration: Ahmad Shalbaf; Software and formal analysis: Behrouz Nobakhsh; Resources and data curation: Reza Rostami and Reza Kazemi; Investigation, review and editing: All authors.
Conflict of interest
The authors declared no conflict of interest.
Acknowledgments
The authors would like to thank Research Department of the School of Medicine, Shahid Beheshti University of Medical Sciences.
References
Arns, M., Cerquera, A., Gutiérrez, R. M., Hasselman, F., & Freund, J. A. (2014). Non-linear EEG analyses predict non-response to rTMS treatment in major depressive disorder. Clinical Neurophysiology, 125(7), 1392–1399. [DOI:10.1016/j.clinph.2013.11.022] [PMID]
American Psychiatric Association. (2000). Diagnostic criteria from dsM-iV-tr. Washington: American Psychiatric Association. [Link]
Beck, A. T., Ward, C. H., Mendelson, M., Mock, J., & Erbaugh, J. (1961). An inventory for measuring depression. Archives of General Psychiatry, 4, 561–571. [DOI:10.1001/archpsyc.1964.01720240015003] [PMID]
Berlim, M. T., Fleck, M. P., & Turecki, G. (2008). Current trends in the assessment and somatic treatment of resistant/refractory major depression: An overview. Annals of Medicine, 40(2), 149-159. [DOI:10.1080/07853890701769728] [PMID]
Beuzon, G., Timour, Q., & Saoud, M. (2017). Predictors of response to repetitive transcranial magnetic stimulation (rTMS) in the treatment of major depressive disorder. L'Encephale, 43(1), 3–9. [DOI:10.1016/j.encep.2016.11.002] [PMID]
Blinowska K. J. (2011). Review of the methods of determination of directed connectivity from multichannel data. Medical & Biological Engineering & Computing, 49(5), 521–529.[DOI:10.1007/s11517-011-0739-x] [PMID] [PMCID]
Brunoni, A. R., Chaimani, A., Moffa, A. H., Razza, L. B., Gattaz, W. F., & Daskalakis, Z. J., et al. (2017). Repetitive transcranial magnetic stimulation for the acute treatment of major depressive episodes: A systematic review with network meta-analysis. JAMA Psychiatry, 74(2), 143–152. [DOI:10.1001/jamapsychiatry.2016.3644] [PMID]
Bullmore, E., & Sporns, O. (2009). Complex brain networks: Graph theoretical analysis of structural and functional systems. Nature Reviews Neuroscience, 10(3), 186-198. [DOI:10.1038/nrn2575] [PMID]
Carpenter, L. L., Janicak, P. G., Aaronson, S. T., Boyadjis, T., Brock, D. G., & Cook, I. A., et al. (2012). Transcranial magnetic stimulation (TMS) for major depression: A multisite, naturalistic, observational study of acute treatment outcomes in clinical practice. Depression and Anxiety, 29(7), 587–596. [DOI:10.1002/da.21969] [PMID]
Chiang, S., & Haneef, Z. (2014). Graph theory findings in the pathophysiology of temporal lobe epilepsy. Clinical Neurophysiology, 125(7), 1295–1305. [DOI:10.1016/j.clinph.2014.04.004] [PMID] [PMCID]
Ciobanu, C., Girard, M., Marin, B., Labrunie, A., & Malauzat, D. (2013). rTMS for pharmacoresistant major depression in the clinical setting of a psychiatric hospital: Effectiveness and effects of age. Journal of Affective Disorders, 150(2), 677–681. [DOI:10.1016/j.jad.2013.03.024] [PMID]
Delorme, A., & Makeig, S. (2004). EEGLAB: An open source toolbox for analysis of single-trial EEG dynamics including independent component analysis. Journal of Neuroscience Methods, 134(1), 9–21. [DOI:10.1016/j.jneumeth.2003.10.009] [PMID]
Delorme, A., Mullen, T., Kothe, C., Akalin Acar, Z., Bigdely-Shamlo, N., & Vankov, A., et al. (2011). EEGLAB, SIFT, NFT, BCILAB, and ERICA: New tools for advanced EEG processing. Computational Intelligence and Neuroscience, 2011, 130714. [DOI:10.1155/2011/130714] [PMID] [PMCID]
Erguzel, T. T., Ozekes, S., Tan, O., & Gultekin, S. (2015). Feature selection and classification of electroencephalographic signals: An artificial neural network and genetic algorithm based approach. Clinical EEG and Neuroscience, 46(4), 321–326. [DOI:10.1177/1550059414523764] [PMID]
Fay, M. P., & Proschan, M. A. (2010). Wilcoxon-mann-whitney or t-test? On assumptions for hypothesis tests and multiple interpretations of decision rules. Statistics Surveys, 4, 1–39. [DOI:10.1214/09-SS051] [PMID] [PMCID]
Fink, M. (2001). Convulsive therapy: A review of the first 55 years. Journal of Affective Disorders, 63(1-3), 1-15. [DOI:10.1016/S0165-0327(00)00367-0]
First, M. B. (1997). Structured clinical interview for DSM-IV axis I disorders SCID-I. Washington: American Psychiatric Press. [Link]
Fregni, F., Marcolin, M. A., Myczkowski, M., Amiaz, R., Hasey, G., & Rumi, D. O., et al. (2006). Predictors of antidepressant response in clinical trials of transcranial magnetic stimulation. The International Journal of Neuropsychopharmacology, 9(6), 641–654. [DOI:10.1017/S1461145705006280] [PMID]
Friston K. J. (2011). Functional and effective connectivity: A review. Brain Connectivity, 1(1), 13–36. [DOI:10.1089/brain.2011.0008] [PMID]
Hasanzadeh, F., Mohebbi, M., & Rostami, R. (2019). Prediction of rTMS treatment response in major depressive disorder using machine learning techniques and nonlinear features of EEG signal. Journal of Affective Disorders, 256, 132–142. [DOI:10.1016/j.jad.2019.05.070] [PMID]
Huang, C. C., Wei, I. H., Chou, Y. H., & Su, T. P. (2008). Effect of age, gender, menopausal status, and ovarian hormonal level on rTMS in treatment-resistant depression. Psychoneuroendocrinology, 33(6), 821–831. [DOI:10.1016/j.psyneuen.2008.03.006] [PMID]
Hunter, A. M., Cook, I. A., & Leuchter, A. F. (2007). The promise of the quantitative electroencephalogram as a predictor of antidepressant treatment outcomes in major depressive disorder. The Psychiatric Clinics of North America, 30(1), 105–124. [DOI:10.1016/j.psc.2006.12.002] [PMID]
Im, C.H., & Lee, C. (2006). Computer-aided performance evaluation of a multichannel transcranial magnetic stimulation system. IEEE Transactions on Magnetics, 42(12), 3803-3808. [DOI:10.1109/TMAG.2006.883913]
Kamiński, M. J., & Blinowska, K. J. (1991). A new method of the description of the information flow in the brain structures. Biological Cybernetics, 65(3), 203–210. [DOI:10.1007/BF00198091] [PMID]
Knott, V., Mahoney, C., Kennedy, S., & Evans, K. (2000). Pre-treatment EEG and it's relationship to depression severity and paroxetine treatment outcome. Pharmacopsychiatry, 33(6), 201–205. [DOI:10.1055/s-2000-8356] [PMID]
Korb, A. S., Hunter, A. M., Cook, I. A., & Leuchter, A. F. (2009). Rostral anterior cingulate cortex theta current density and response to antidepressants and placebo in major depression. Clinical Neurophysiology, 120(7), 1313–1319. [DOI:10.1016/j.clinph.2009.05.008] [PMID] [PMCID]
Mamitsuka, H. (2006). Selecting features in microarray classification using ROC curves. Pattern Recognition, 39(12), 2393-2404. [DOI:10.1016/j.patcog.2006.07.010]
Mayberg, H. S., Brannan, S. K., Tekell, J. L., Silva, J. A., Mahurin, R. K., & McGinnis, S., et al. (2000). Regional metabolic effects of fluoxetine in major depression: Serial changes and relationship to clinical response. Biological Psychiatry, 48(8), 830–843. [DOI:10.1016/S0006-3223(00)01036-2] [PMID]
Milev, R. V., Giacobbe, P., Kennedy, S. H., Blumberger, D. M., Daskalakis, Z. J., & Downar, J., et al. (2016). Canadian network for mood and anxiety treatments (CANMAT) 2016 clinical guidelines for the management of adults with major depressive disorder: Section 4. Neurostimulation treatments. Canadian Journal of Psychiatry. Revue Canadienne de Psychiatrie, 61(9), 561–575. [DOI:10.1177/0706743716660033] [PMID] [PMCID]
Mulert, C., Juckel, G., Brunnmeier, M., Karch, S., Leicht, G., & Mergl, R., et al. (2007). Rostral anterior cingulate cortex activity in the theta band predicts response to antidepressive medication. Clinical EEG and Neuroscience, 38(2), 78–81. [DOI:10.1177/155005940703800209] [PMID]
Mullen, T. (2010). Source information flow toolbox (SIFT). San Diego: Swartz Center for Computational Neuroscience. [Link]
Mullen, T. (2012). CleanLine EEGLAB plugin. San Diego, CA: Neuroimaging Informatics Toolsand Resources Clearinghouse (NITRC). [Link]
Mumtaz, W., Xia, L., Mohd Yasin, M. A., Azhar Ali, S. S., & Malik, A. S. (2017). A wavelet-based technique to predict treatment outcome for major depressive disorder. Plos One, 12(2), e0171409. [DOI:10.1371/journal.pone.0171409] [PMID] [PMCID]
O'Reardon, J. P., Solvason, H. B., Janicak, P. G., Sampson, S., Isenberg, K. E., & Nahas, Z., et al. (2007). Efficacy and safety of transcranial magnetic stimulation in the acute treatment of major depression: A multisite randomized controlled trial. Biological Psychiatry, 62(11), 1208–1216. [DOI:10.1016/j.biopsych.2007.01.018] [PMID]
Olejarczyk, E., & Jernajczyk, W. (2017). Graph-based analysis of brain connectivity in schizophrenia. Plos One, 12(11), e0188629. [DOI:10.1371/journal.pone.0188629] [PMID] [PMCID]
World Health Organization (WHO). Depression. Retrieved from: [Link]
Pizzagalli, D., Pascual-Marqui, R. D., Nitschke, J. B., Oakes, T. R., Larson, C. L., & Abercrombie, H. C., et al. (2001). Anterior cingulate activity as a predictor of degree of treatment response in major depression: Evidence from brain electrical tomography analysis. The American Journal of Psychiatry, 158(3), 405–415. [DOI:10.1176/appi.ajp.158.3.405] [PMID]
Rostami, R., Kazemi, R., Nitsche, M. A., Gholipour, F., & Salehinejad, M. A. (2017). Clinical and demographic predictors of response to rTMS treatment in unipolar and bipolar depressive disorders. Clinical Neurophysiology, 128(10), 1961–1970. [DOI:10.1016/j.clinph.2017.07.395] [PMID]
Rubinov, M., & Sporns, O. (2010). Complex network measures of brain connectivity: Uses and interpretations. NeuroImage, 52(3), 1059–1069. [DOI:10.1016/j.neuroimage.2009.10.003] [PMID]
Shalbaf, A., Bagherzadeh, S., & Maghsoudi, A. (2020). Transfer learning with deep convolutional neural network for automated detection of schizophrenia from EEG signals. Physical and Engineering Sciences in Medicine, 43(4), 1229–1239. [DOI:10.1007/s13246-020-00925-9] [PMID]
Shalbaf, A., Shalbaf, R., Saffar, M., & Sleigh, J. (2020). Monitoring the level of hypnosis using a hierarchical SVM system. Journal of Clinical Monitoring and Computing, 34(2), 331–338. [DOI:10.1007/s10877-019-00311-1] [PMID]
Shalbaf, R., Brenner, C., Pang, C., Blumberger, D. M., Downar, J., & Daskalakis, Z. J., et al. (2018). Non-linear entropy analysis in EEG to predict treatment response to repetitive transcranial magnetic stimulation in depression. Frontiers in Pharmacology, 9, 1188. [DOI:10.3389/fphar.2018.01188] [PMID] [PMCID]
Shiozawa, P., Raza, R., Cordeiro, Q., & Brunoni, A. R. (2015). Clinical applications of neuromodulation in psychiatry. In H. Knotkova., & D. Rasche (Eds.), Textbook of neuromodulation (pp. 171-185). Berlin: Springer. [DOI:10.1007/978-1-4939-1408-1_14]
Silverstein, W. K., Noda, Y., Barr, M. S., Vila-Rodriguez, F., Rajji, T. K., & Fitzgerald, P. B., et al. (2015). Neurobiological predictors of response to dorsolateral prefrontal cortex repetitive transcranial magnetic stimulation in depression: A systematic review. Depression and Anxiety, 32(12), 871–891. [DOI:10.1002/da.22424] [PMID]
Simpson, J. R., Jr, Snyder, A. Z., Gusnard, D. A., & Raichle, M. E. (2001). Emotion-induced changes in human medial prefrontal cortex: I. during cognitive task performance. Proceedings of the National Academy of Sciences of the United States of America, 98(2), 683–687. [DOI:10.1073/pnas.98.2.683] [PMID] [PMCID]
van den Heuvel, M. P., & Hulshoff Pol, H. E. (2010). Exploring the brain network: A review on resting-state fMRI functional connectivity. European Neuropsychopharmacology, 20(8), 519–534. [DOI:10.1016/j.euroneuro.2010.03.008] [PMID]
Zeng, L. L., Shen, H., Liu, L., & Hu, D. (2014). Unsupervised classification of major depression using functional connectivity MRI. Human Brain Mapping, 35(4), 1630–1641. [DOI:10.1002/hbm.22278] [PMID] [PMCID]
Type of Study: Original |
Subject:
Cognitive Neuroscience
Received: 2022/12/22 | Accepted: 2023/07/2 | Published: 2024/03/1
Received: 2022/12/22 | Accepted: 2023/07/2 | Published: 2024/03/1
Send email to the article author
| Rights and permissions | |
 |
This work is licensed under a Creative Commons Attribution-NonCommercial 4.0 International License. |
![]()
Copyright © The Author(s);
This is an open access article distributed under the terms of the Creative Commons Attribution License (CC-By-NC), which permits use, distribution, and reproduction in any medium, provided the original work is properly cited and is not used for commercial purposes.
Contact Information
