

Volume 16, Issue 5 (September & October 2025)
BCN 2025, 16(5): 975-986 |
Back to browse issues page


Download citation:
BibTeX | RIS | EndNote | Medlars | ProCite | Reference Manager | RefWorks
Send citation to:


BibTeX | RIS | EndNote | Medlars | ProCite | Reference Manager | RefWorks
Send citation to:
Mohammadian A, Khosrowabadi R, Yarali B. Developmental Changes of Brain Oscillatory Pattern in Children With and Without Epilepsy. BCN 2025; 16 (5) :975-986
URL: http://bcn.iums.ac.ir/article-1-2563-en.html
URL: http://bcn.iums.ac.ir/article-1-2563-en.html


1- Institute for Cognitive Science Studies, Tehran, Iran.
2- Institute for Cognitive and Brain Sciences, Shahid Beheshti University, Tehran, Iran.
3- Children’s Medical Center, Tehran University of Medical Sciences, Tehran, Iran.
2- Institute for Cognitive and Brain Sciences, Shahid Beheshti University, Tehran, Iran.
3- Children’s Medical Center, Tehran University of Medical Sciences, Tehran, Iran.
Full-Text [PDF 10560 kb]
| Abstract (HTML)
Full-Text:
Introduction
Studying the developmental pattern of changes in brain structure and function has been a long-standing area of research interest (Sporns, 2014). Researchers are increasingly interested in understanding the procedures and factors that shape and happen in a healthy brain and its typical changes during normal development. They believe such a pattern will help recognize and prognose abnormal brain developments, such as neurodevelopmental disorders, and may help find clues on how the brain could be treated. Undoubtedly, most changes occur during the infancy period and are followed by significant changes in childhood, which gradually decrease as one grows up (Huelke, 1998). Therefore, it seems necessary to investigate the normal growth pattern and its changes in neurodevelopmental disorders. However, as far as we know, there is limited information about the typical developmental pattern in children with epilepsy.
In this regard, advanced neuroimaging technologies can help us measure and track topographical changes in brain networks. Various types of neuroimaging techniques could be employed, among them electroencephalography (EEG), which, due to its low running cost and good temporal resolution, could be a practical choice. Additionally, it is believed that information processing in the brain is a result of the convergence and divergence of neural oscillations (Hermann, 2002). As a result, understanding the pattern of changes in brain waves during development helps in understanding diseases. On the other hand, it is not well recognized whether the pattern of developmental changes in epileptic children is similar to that in typically developing children (Stam et al., 2007).
Epilepsy is one of the most common and important neurodevelopmental problems (Lebel et al., 2008). Since epilepsy is characterized by changes in the electrical activity of the brain that cause sudden changes in behavior, we hypothesized that seizures occur only at a moment in time and have no long-term effects. We aim to show that epilepsy disorder may affect the pattern of neurodevelopmental changes. For this purpose, we used a cross-sectional study to compare changes in brain waves across various brain regions in a group of epileptic children with an age- and gender-matched group of typically developing children, as explained in the following section.
Materials and Methods
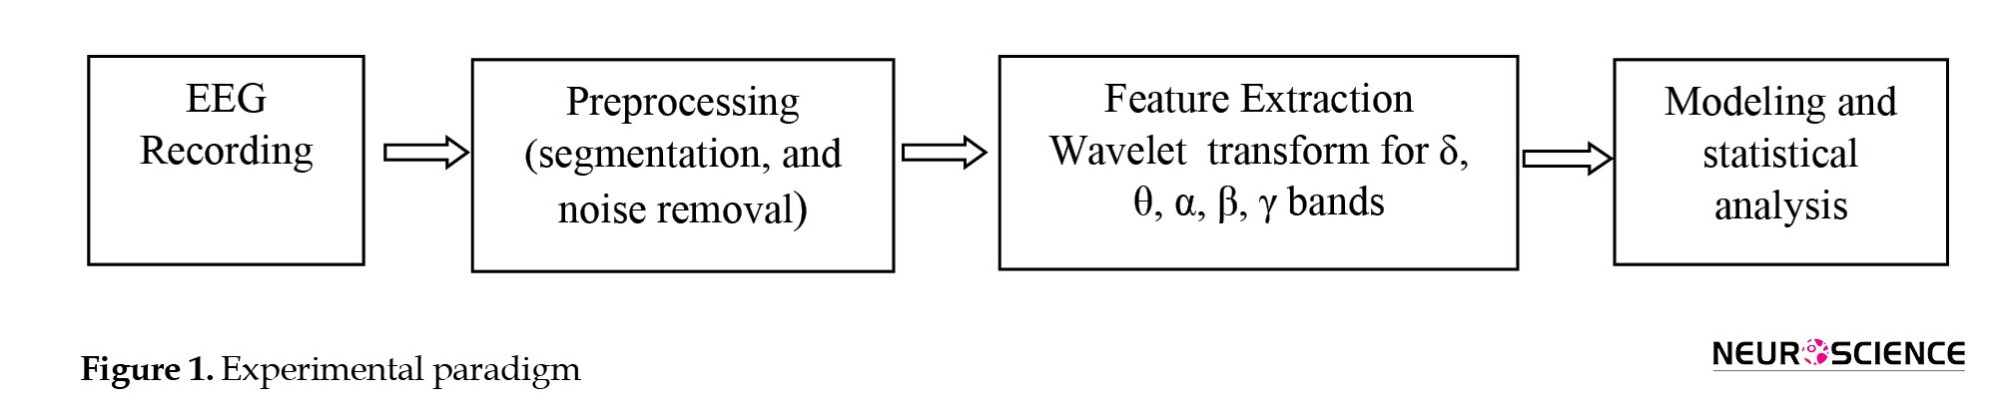
The implementation of the study comprises three basic parts: Signal recording, required preprocessing and feature extraction, and modeling (Figure 1).
Study participants
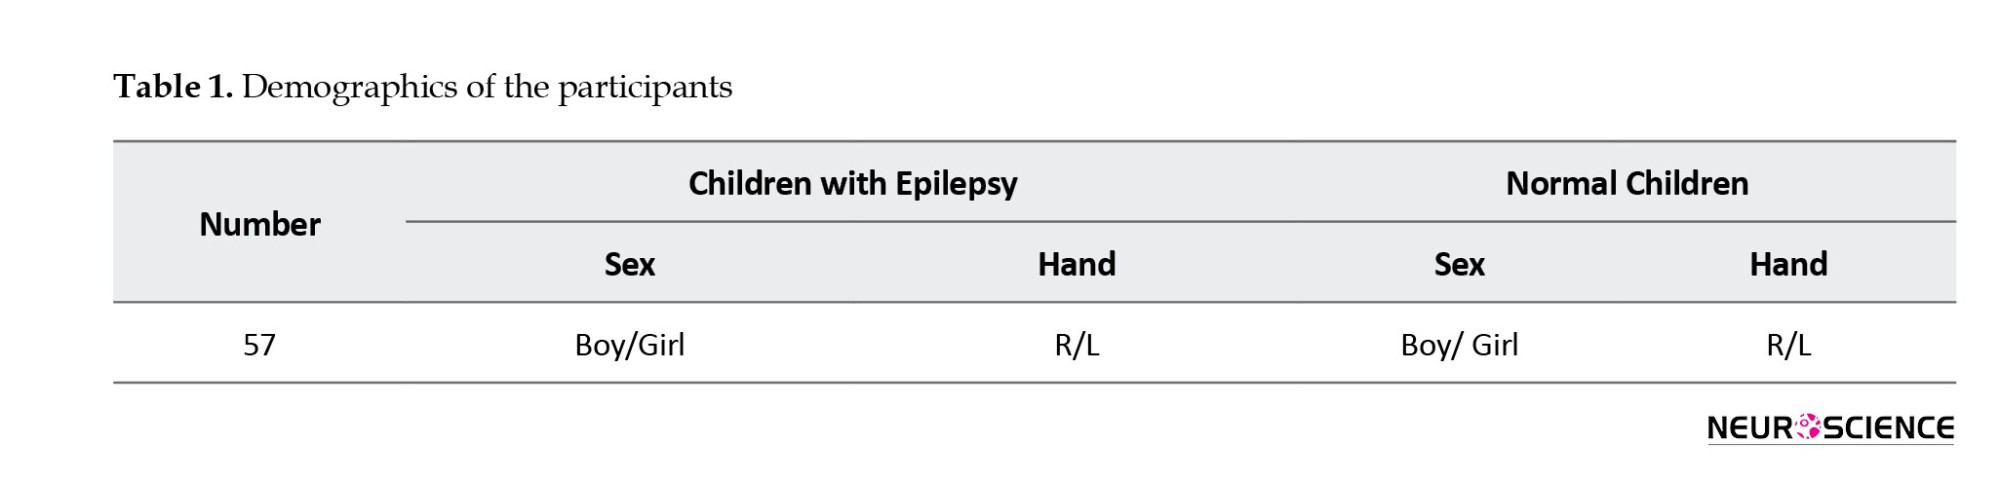
In this study, EEG signals were recorded from 57 children with epilepsy and 57 age- and gender-matched typically developed children. Typically developed children did not have any neurological disorders or other illnesses and did not take any medication. These children, aged 6 to 12, participated in the study with their parents’ or caregivers’ consent. Children with epilepsy were diagnosed with epilepsy by a pediatric neurologist based on clinical interview and examination using an EEG device. All participants were resting in a quiet environment while the signal was recorded.
EEG data recording
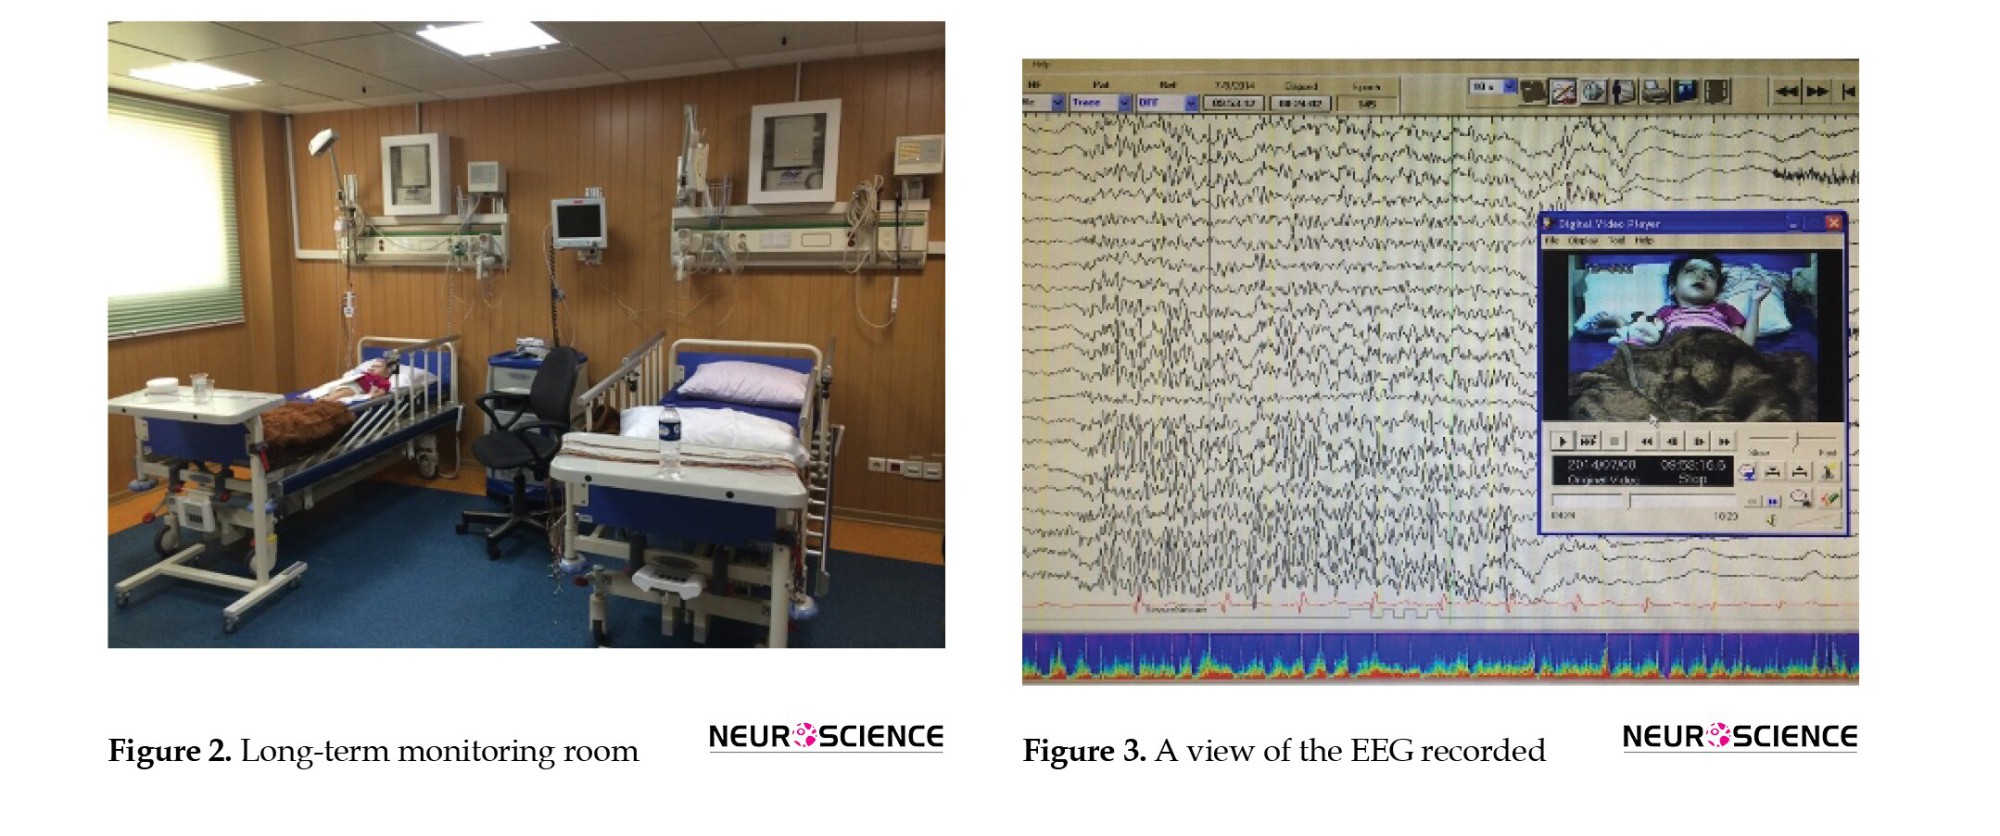
Before data recording, participants were informed of the procedure, and an agreement was obtained from their parents. A Nihon Kohden amplifier with a 28-electrode cap was used to record the EEG signal. Signal acquisition was performed for 57 healthy children while their eyes were open during 60 minutes of long-term monitoring at the Department of Neurology, Children’s Medical Center. The use of PEMU (pediatric EEG monitoring usage) is to determine the nature of seizures in children, as well as to localize their focus, and to take preoperative measures for epilepsy surgery (Figure 2).
This ward features a double room for patients and technicians, as well as a room for the pediatric neurologist. The patient’s room is equipped with two cameras for live imaging of the patient and an EEG device with 28 channels for recording. In this room, the nurse and the patient’s companion have the opportunity to report any suspicious activity by the patient in real-time. In this room, the nurses can watch a live ECG as well as a video of the patient. The doctor’s room features a server computer capable of storing data for an extended period and a computer equipped with one of the most advanced systems available. Using this software, doctors can review the images and data of the EEG online and offline, and prepare the final report (Figure 3).
Signal analysis and preprocessing
Signals related to each person have been recorded for an hour in the mentioned state, and then, the parts with the least amount of noise were selected from the artifact-free signals. Specifically, ocular and motion artifacts, as well as electromyograms, were removed by a skilled operator under the supervision of a neurologist. For initial signal preparation, the artifact effect and the city’s electrical interference were removed through the software. The information from 28 EEG electrodes, available in an array format, was converted to be readable in MATLAB. The EEG signals were then filtered in the range of 0.1 to 70 Hz using a FIR filter.
Feature extraction
Extracting appropriate features from EEG signals is of special importance. By selecting these features correctly and paying attention to the presented model, we can demonstrate the brain’s better functioning. In this study, the energy of the EEG signal was calculated using the wavelet transform at conventional frequency bands, including δ, θ, α, β, and γ bands. Finally, the obtained values were provided as input to the proposed model.
A wavelet is a set of mathematical functions used to decompose a continuous signal into its frequency components, and the resolution of each element equals its scale. Considering the better performance and discrimination of the wavelet transform in epilepsy activity compared to the short-time Fourier transform, we use the discrete wavelet transform to extract the features of the signals (Liu et al., 2012). The EEG signal is divided into sub-frequency bands (Table 1).
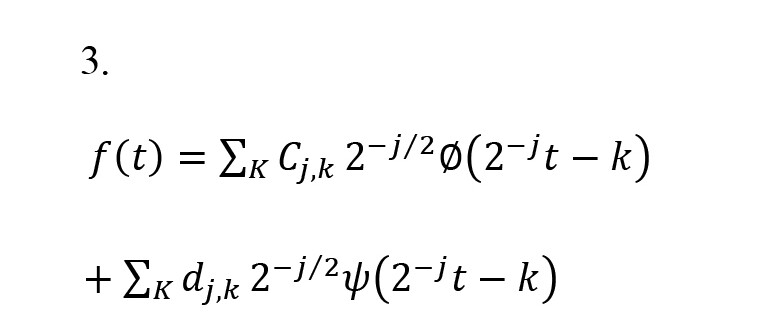
A discrete wavelet transform is used to analyze the signal at different frequency bands with varying resolutions by decomposing the signal into cumulative estimation (Cj, k) and detailed analysis (dj, k). These coefficients are calculated by Equations 1 and 2.
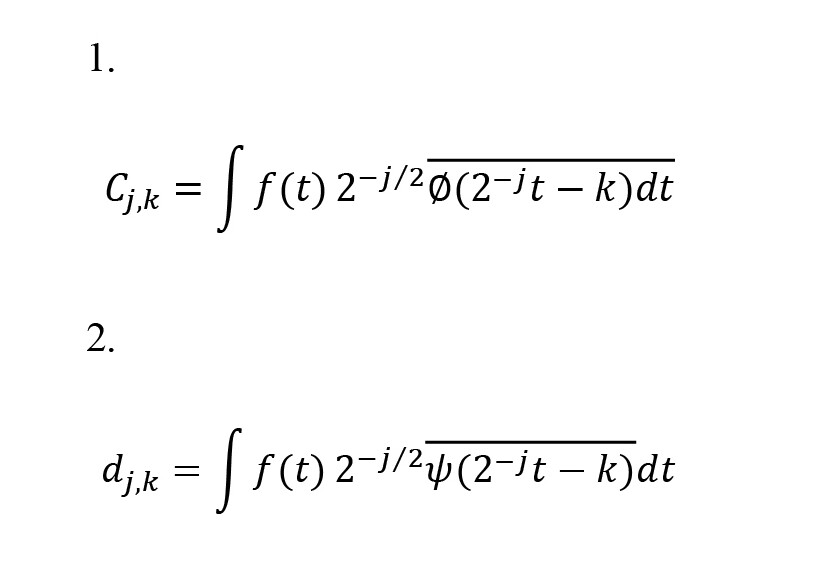
(t) indicates the basic scaling, ψ(t) indicates the mother wavelet, k indicates the translation parameter, and j indicates the scale index. The inverse discrete wavelet transform is calculated by Equation 3.
In signal processing, the total energy of the discrete time signal x [n] at distance n1≤n≤n2 is defined as (Equation 4):
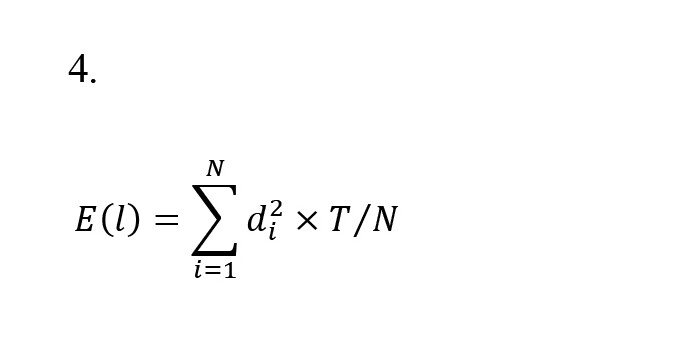
So that N is the number of di coefficients on the scale l and T is the sampling interval. In this study, the energy of each subband is calculated based on its corresponding energy. The associated energy calculates the signal strength at each time interval. The associated signal energy Er(l) is calculated by Equation 5.
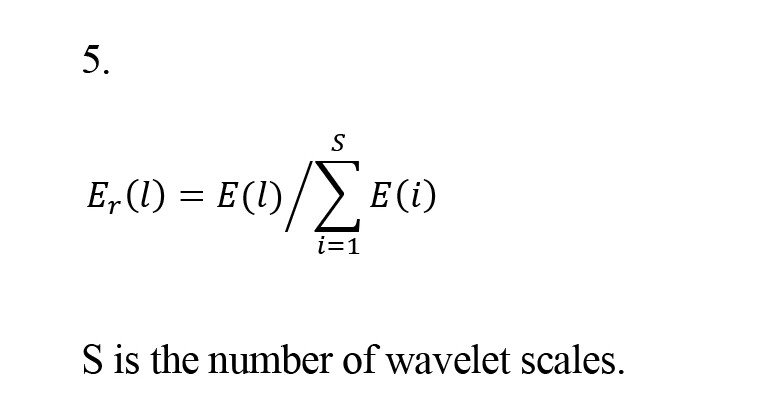
S is the number of wavelet scales.
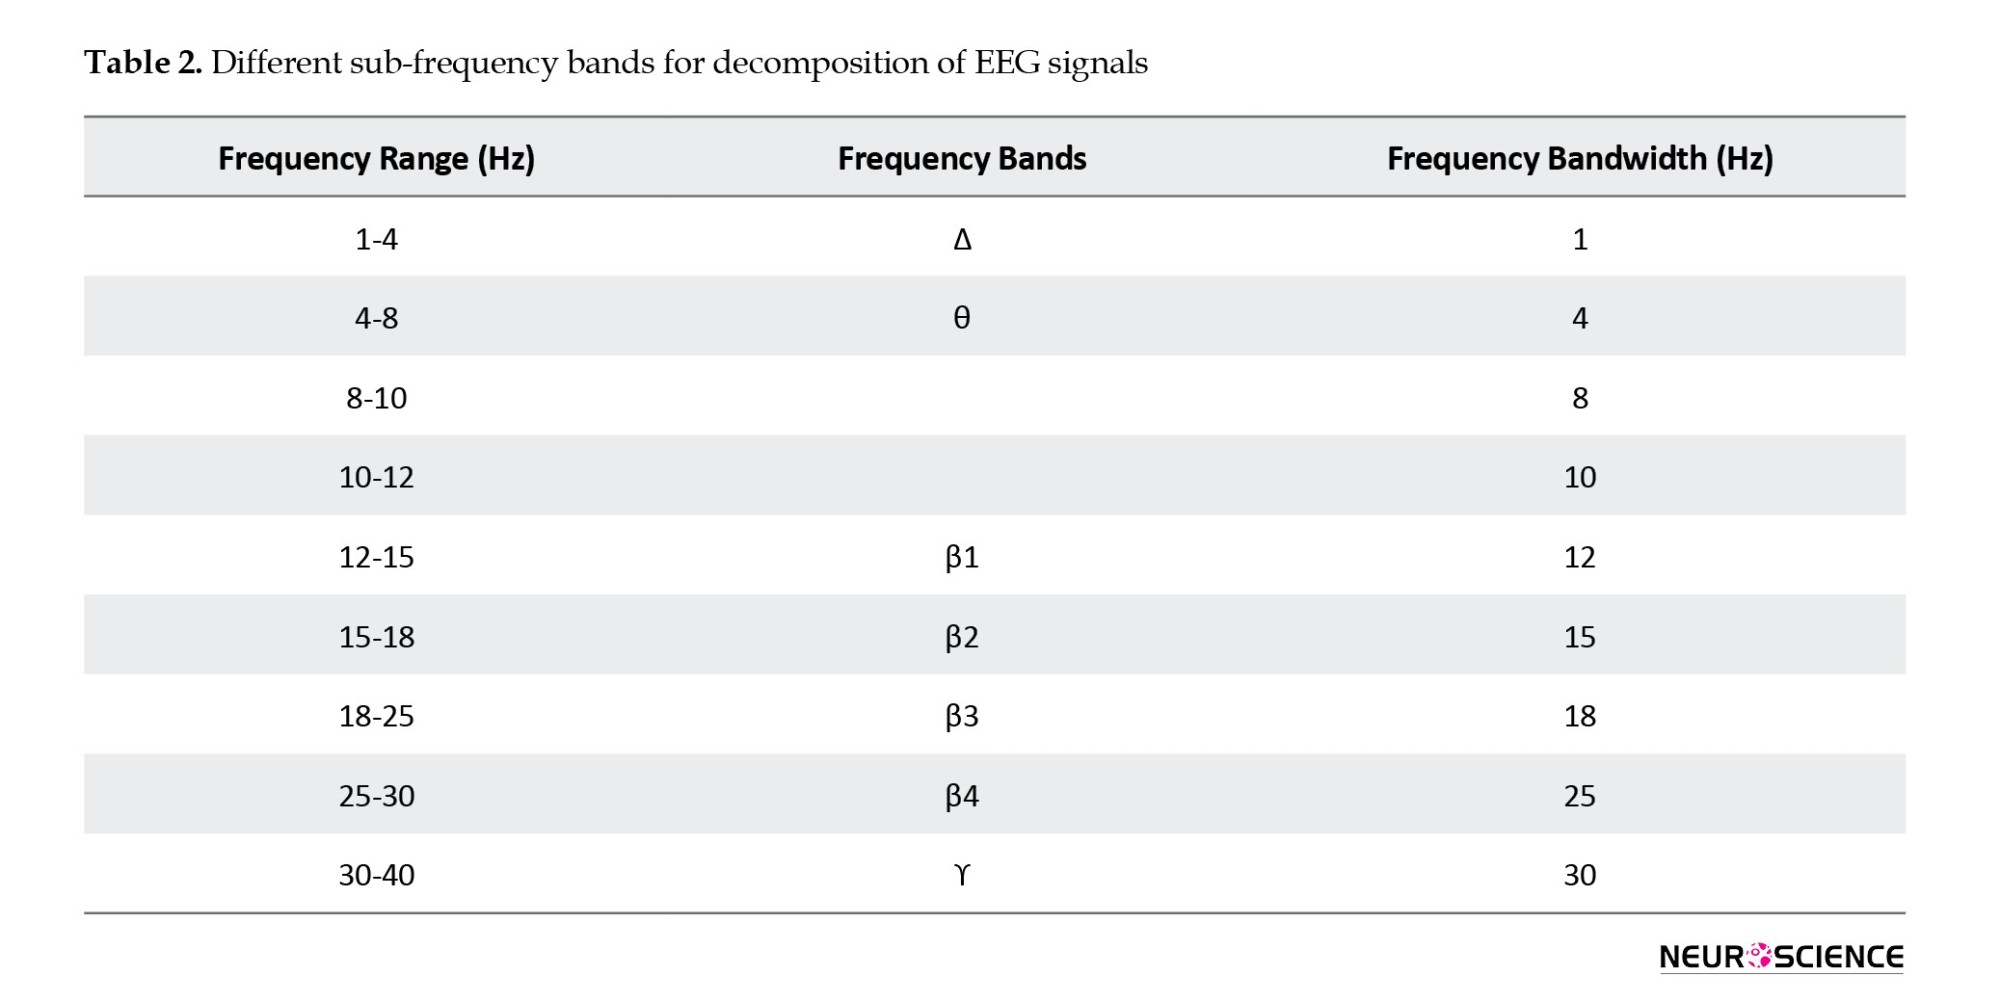
Examining frequency bands separately plays a crucial role in obtaining high-quality results. The choice of frequency bands was made based on the results of the power spectrum analysis. Using the fast Fourier transform (FFT), the power of the EEG signal spectrum is converted from the time domain to the frequency domain. By calculating the ratio of the power spectrum of each frequency band to the total power in the range of 1 to 40 Hz, with a frequency separation of 0.001 Hz, the relative spectral power of all 28 channels is obtained. The paradigm of power spectral analysis, based on frequency changes in frequency bands described in Table 2, was selected for further analysis (Samimi Sabet et al., 2019).
Statistical analysis
After performing the Kolmogorov-Smirnov normalization test, analysis of variance with a post hoc test using the t-test was applied to the power spectrum features. The power spectrum was calculated with a frequency resolution of 1 Hz, and for each frequency, band comparisons were made separately.
Results
The power spectra of resting-state EEG data from epileptic and typically developing children were statistically compared in two separate age ranges: 6-9 and 9-12 years.
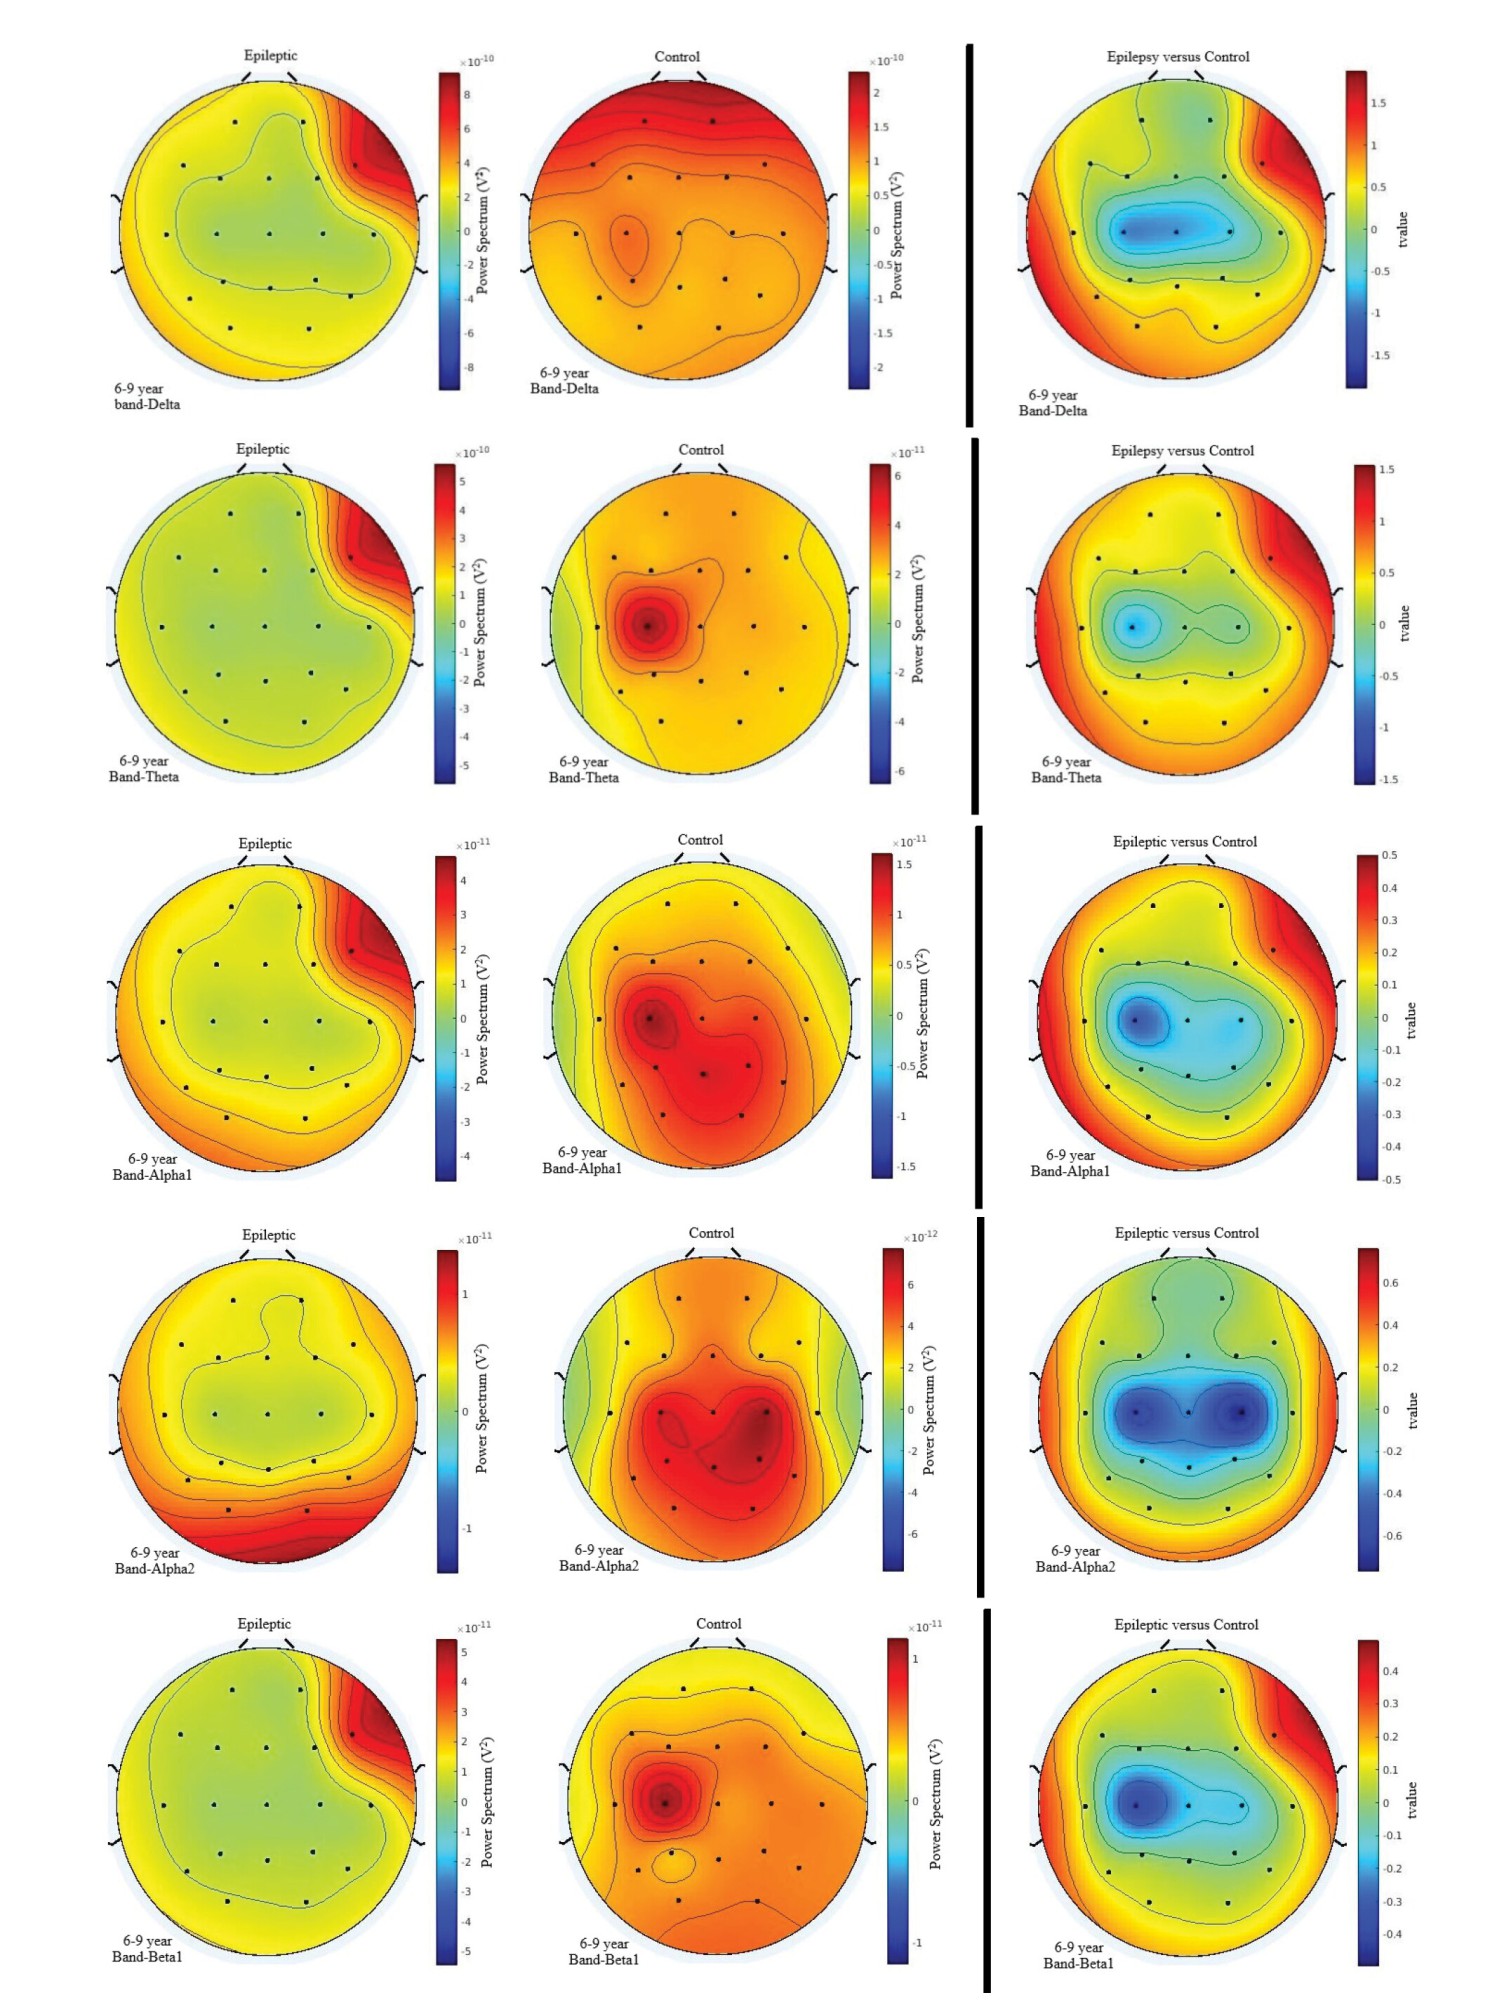
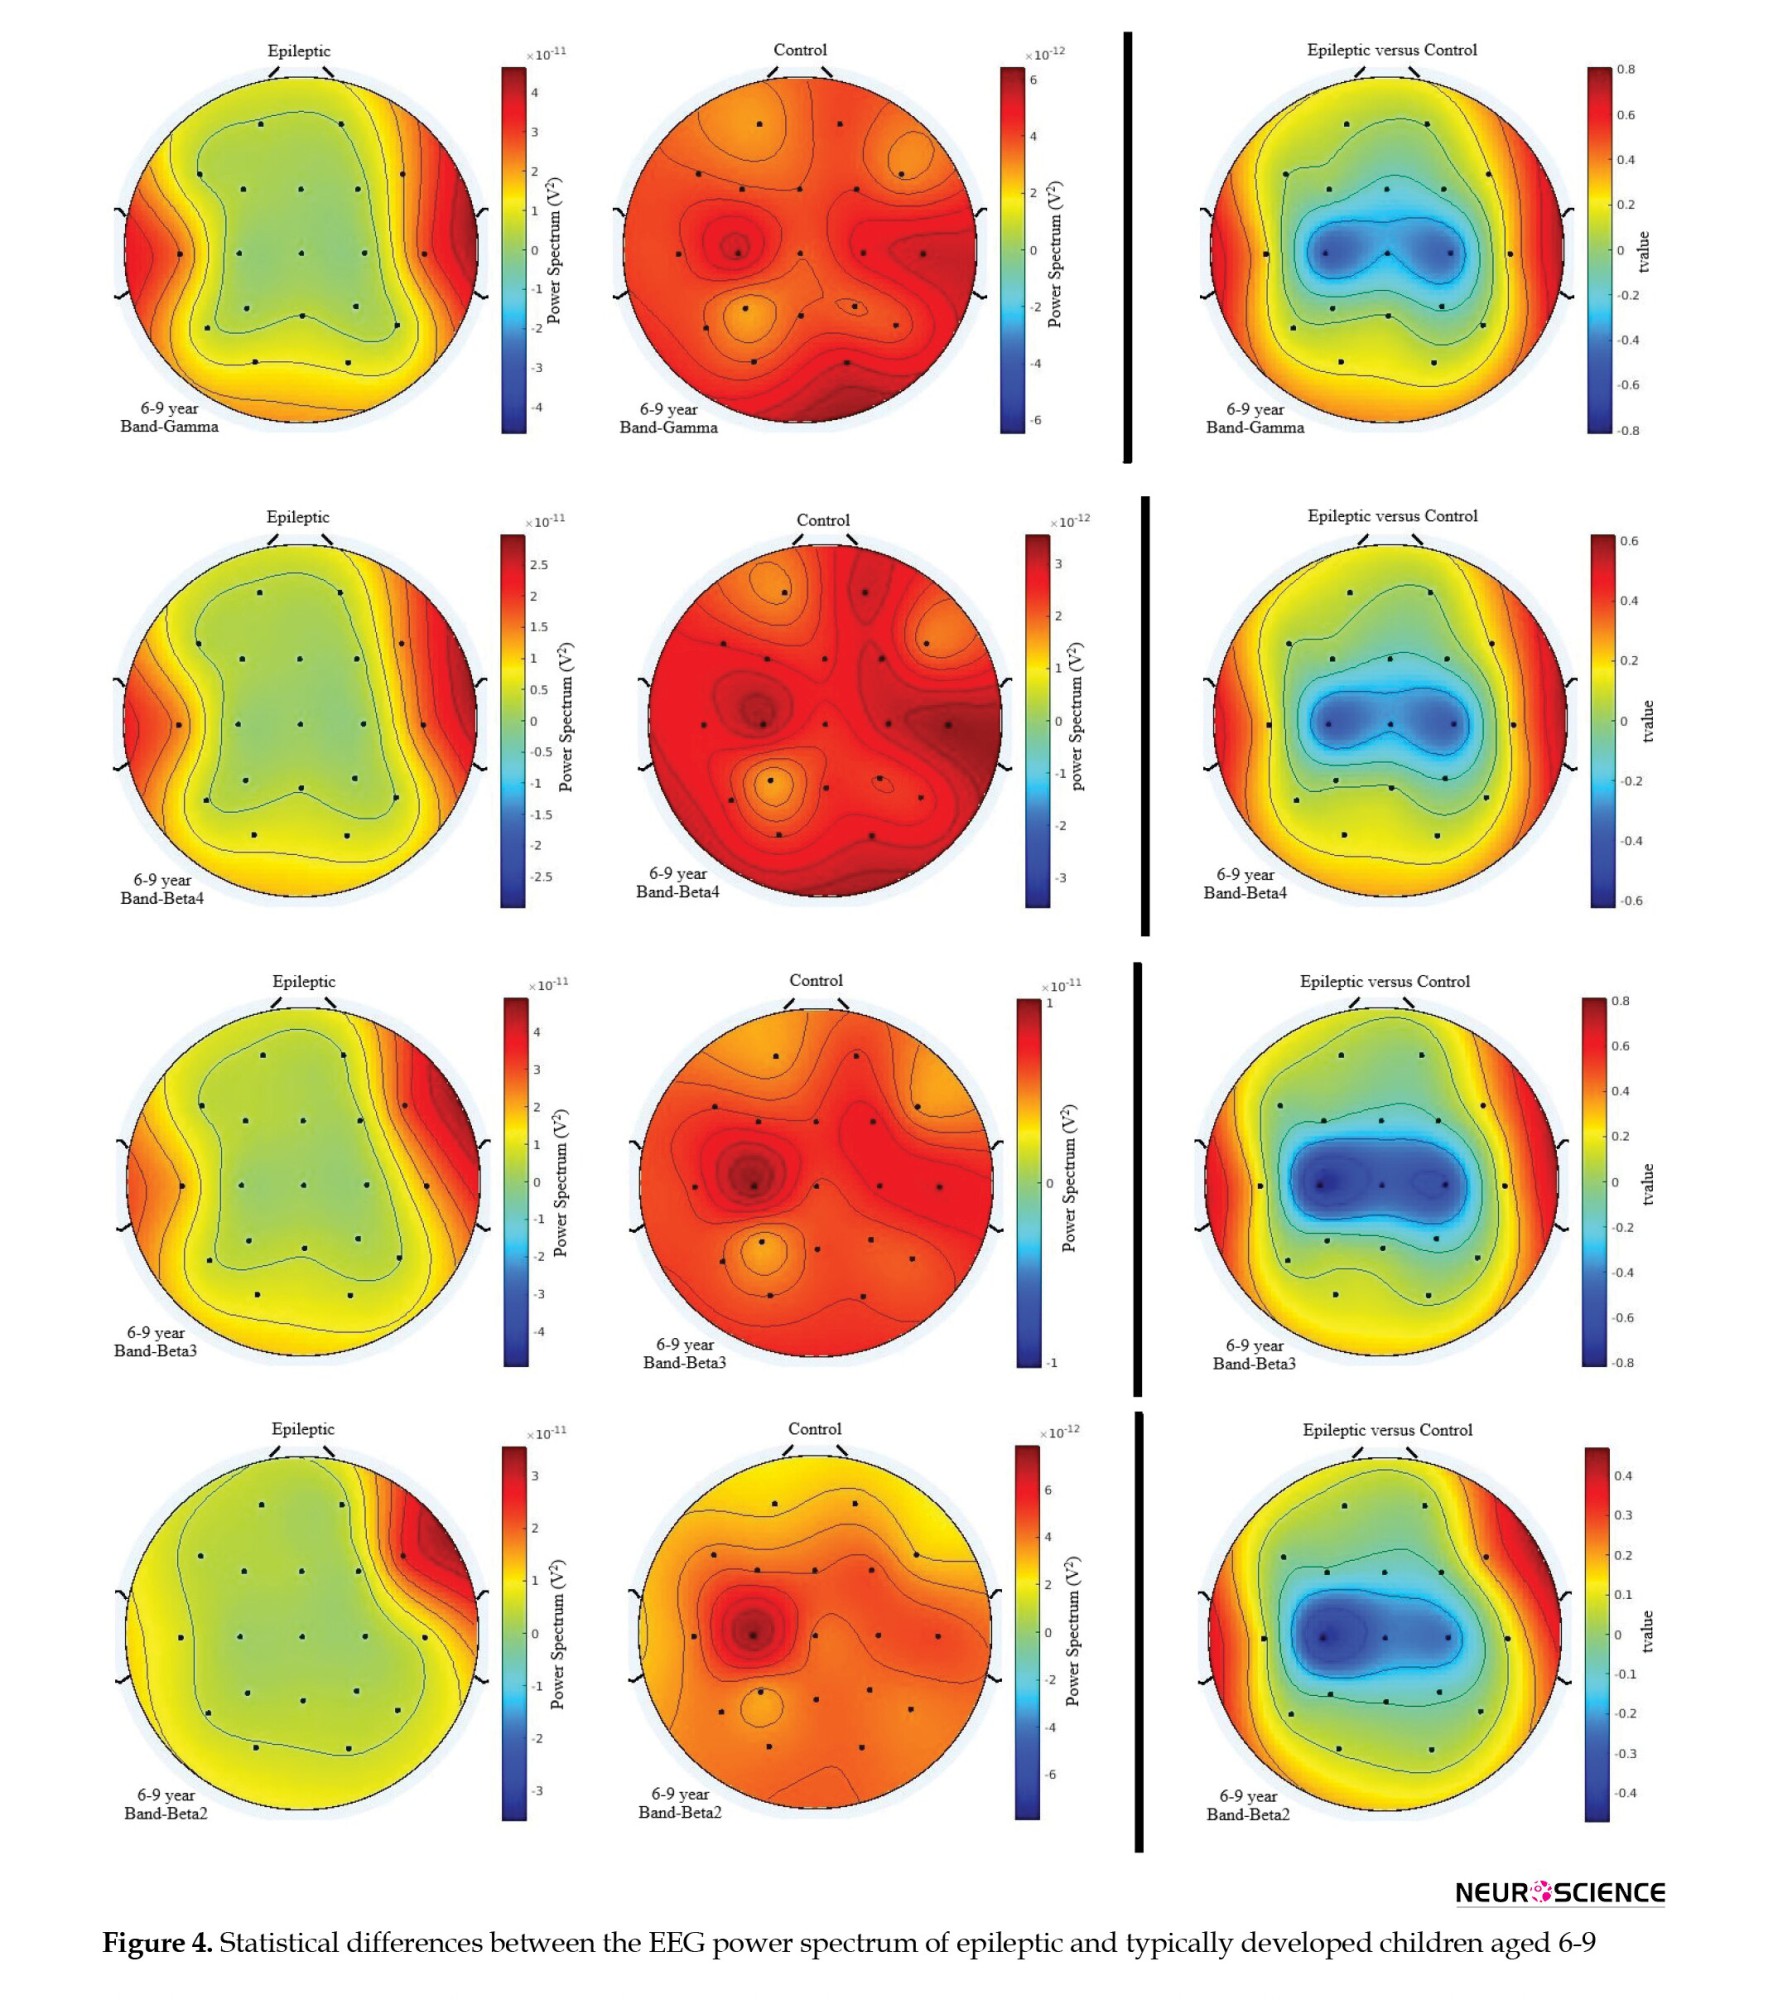
Comparison between epileptic and normal children (6-9 years)
As presented in Figure 4, smaller lower-frequency activities were observed in epileptic children at C3, C4, and Cz in the frequency range of 1-4 Hz. For the theta, lower alpha, β1, and β2 frequency bands, lower activity was also observed at C3 in epileptic children. However, this effect was bilateral at C3 and C4 for the upper alpha band and β3 and lower gamma frequencies.
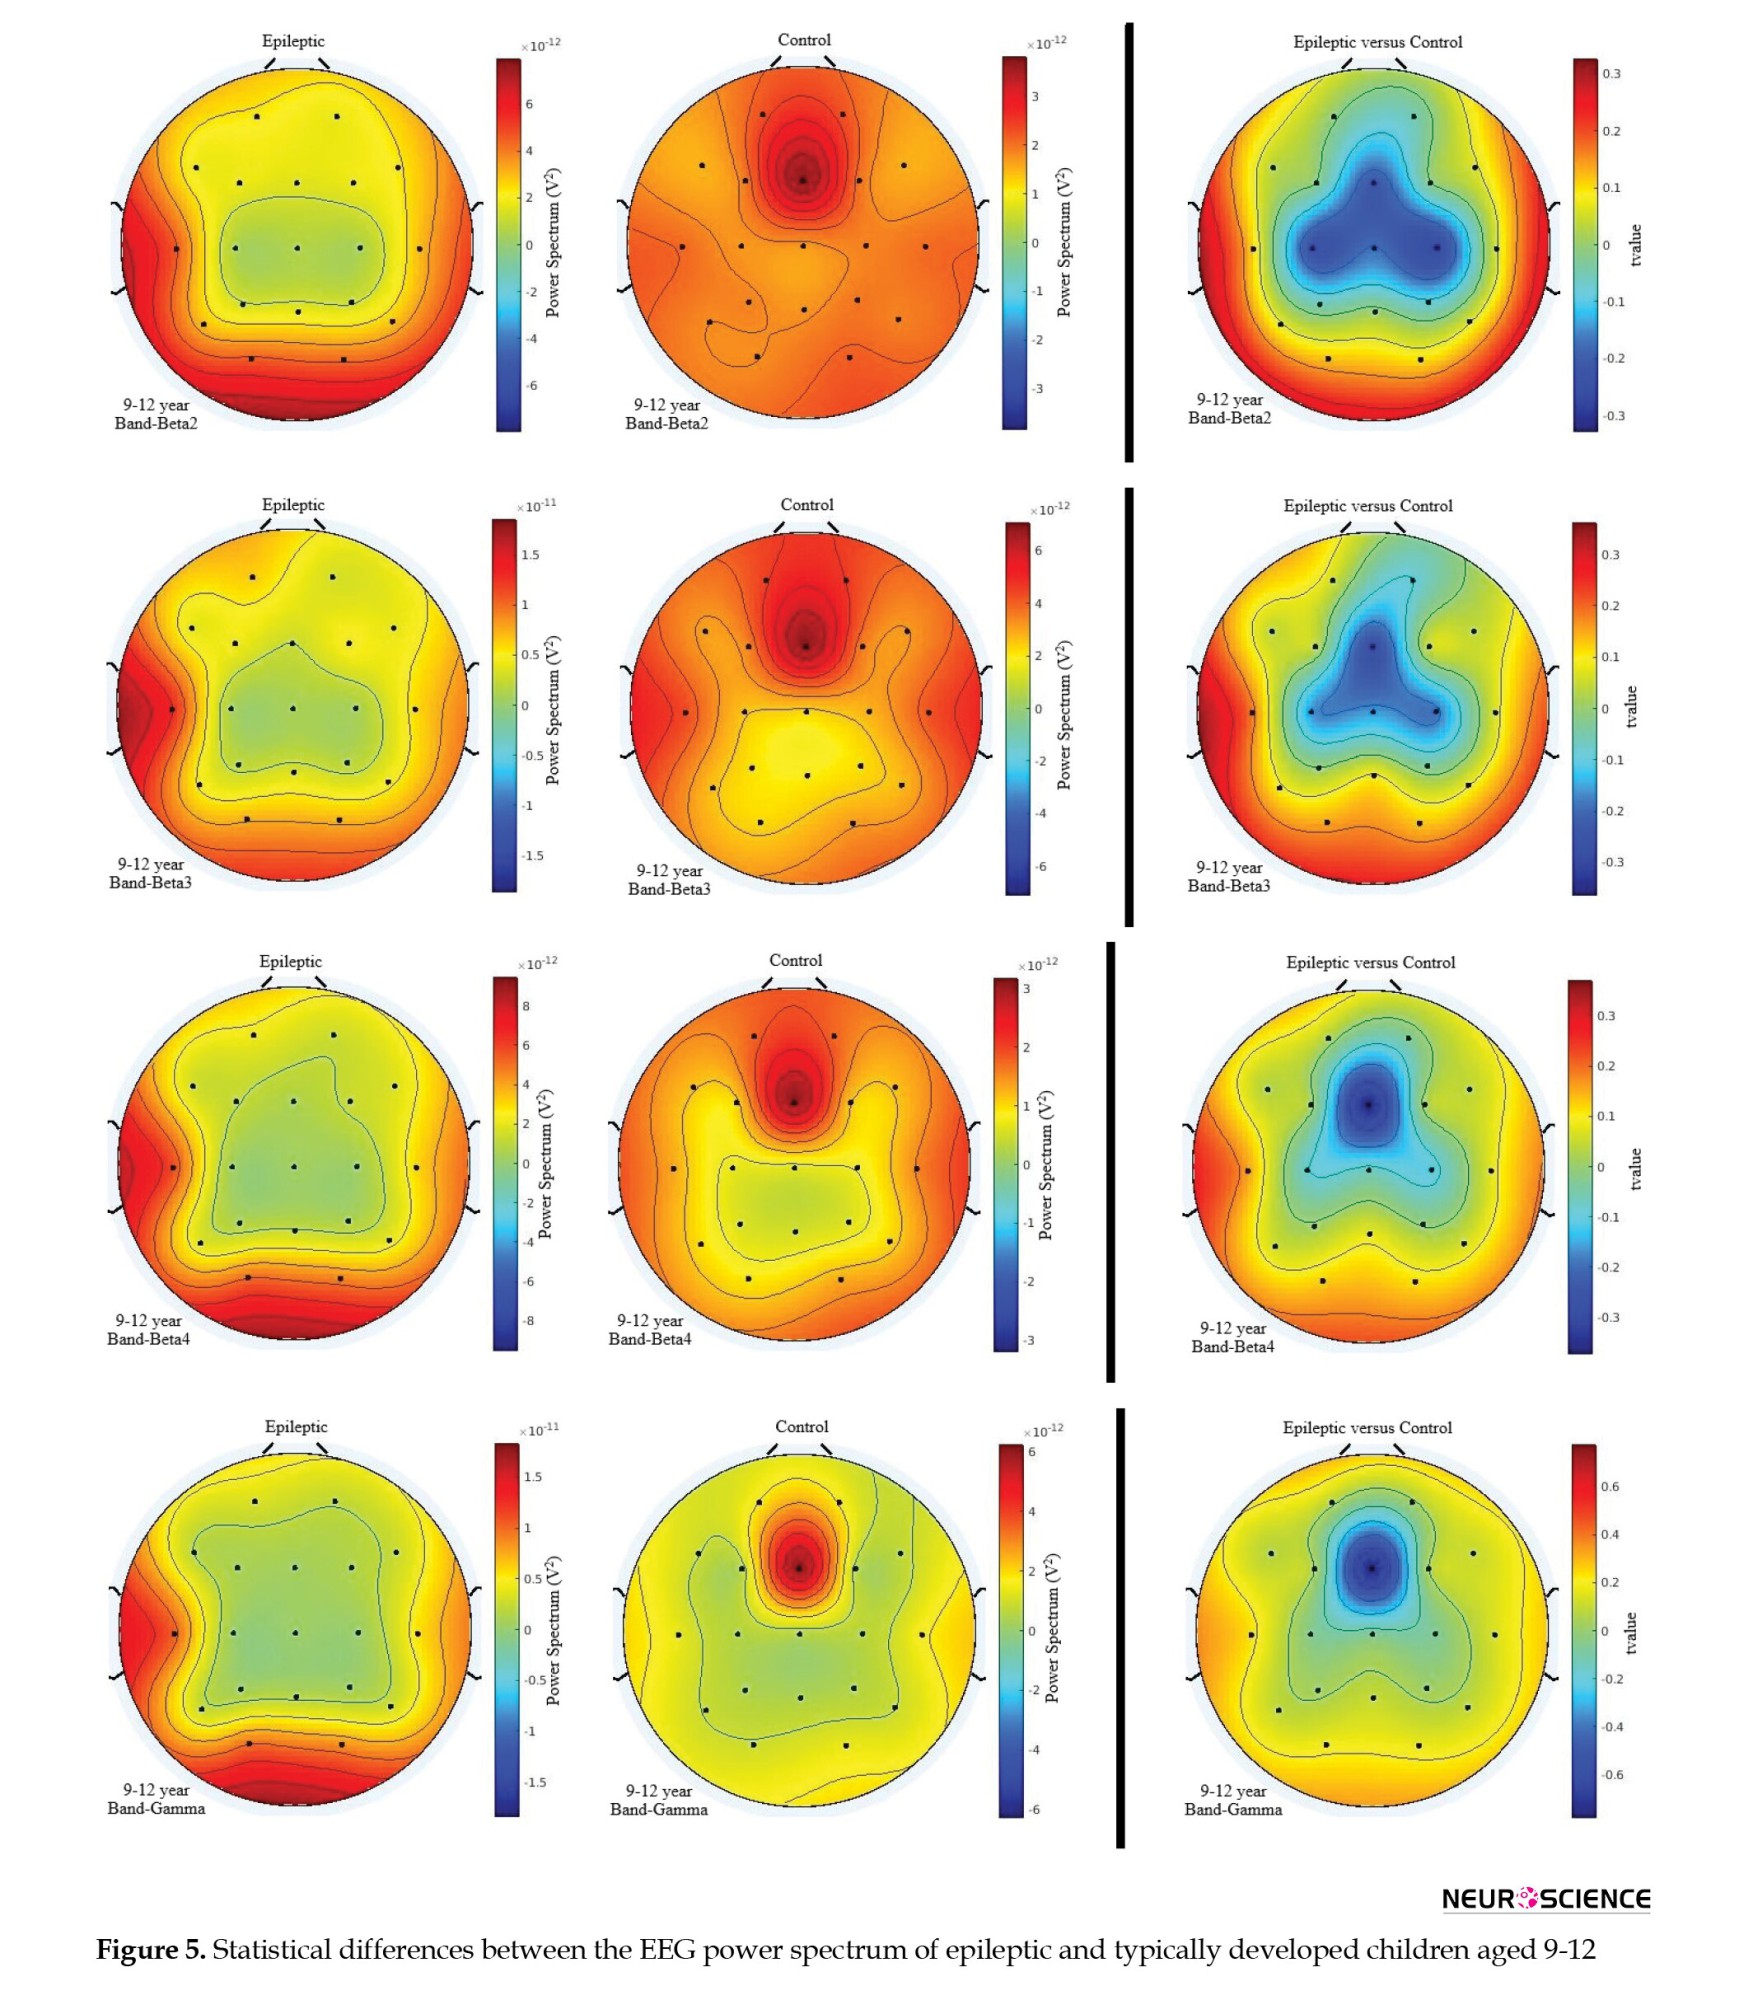
Comparison between epileptic and normal children (9-12 years)
As presented in Figure 5, smaller, lower-frequency activities were observed in epileptic children at the middle frontal region (Fz) in the frequency range of 1-4 Hz, specifically in the β4 and lower gamma band activities. For the theta, β1, β2, and β3 frequency bands, lower activities were also observed at the Fz, C3, and C4 sites in epileptic children. While this effect was bilateral at C3 and C4, it was observed for the alpha band frequencies.

Discussion
Studies of functional brain connectivity in humans have shown that most studies indicate a small-world pattern for functional connectivity, although scale-free networks have also been described (Eguiluz et al., 2005). The architecture of functional brain networks may reflect genetic factors and is related to cognitive performance. Different types of brain disease can sometimes give rise to more random networks, which may be associated with cognitive problems as well as a lower threshold for seizures (pathological hypersynchronization) (Stam et al., 2007). According to previous studies on the modern theory of networks, particularly in large-scale networks such as the brain, the following reasons can be put forward for the use of brain network modeling. First, the new theory of powerful realistic models of complex networks gives us access to the brain. Second, a large number of efforts to study the topological and dynamical properties of these networks continue to grow. Third, this theory enables us to understand better the correlations between network structure and the processes occurring within these networks, particularly synchronization processes. Fourth, by relating structure to function, network changes can be investigated. Ultimately, these investigations offer insights into how complex networks may evolve and respond to various types of diseases.
Other studies have demonstrated that the small-world topology of functional brain networks is highly consistent across various techniques, conditions, and frequency bands. Furthermore, the architecture of functional brain networks may reflect genetic factors and be related to cognitive function. Different types of brain diseases can disrupt the optimal pattern of the small world, sometimes causing more random networks that may be associated with cognitive problems, as well as a lower threshold for seizures (pathological hypersynchrony). It has been shown in studies that various types of brain disease, such as Alzheimer disease, schizophrenia, brain tumors, and epilepsy, may be associated with deviations of the functional network topology from the optimal small-world pattern (Stam et al., 2007). Developmental studies on the activity patterns and organization of the brain have indicated a specific association between brain structural and functional organization and abnormalities observed in neurodevelopmental diseases. Considering that the developmental process leads to significant changes in network topology, it provides a possibility to investigate optimal changes in typically developed children and compare them with other network topologies, such as those found in neurodevelopmental disorders. If we consider brain signals as the language of the brain, through which the brain provides us with reliable information about some of its activities and interactions, certain information and features can be extracted by accurately recording EEG signals and processing them effectively.
The brain exhibits significant growth over time on both macroscopic and microscopic scales. At the cellular level, the brain begins to grow an abundance of synaptic connections, with almost half of them lost by the age of around 6. This pruning process could potentially influence the brain’s oscillatory patterns, and deviations from them may cause drastic changes in behavior and cognitive functions. The question raised in this study was whether this process differs in typically developed and epileptic children. Therefore, in a cross-sectional study, the brain oscillatory pattern of the two groups was statistically compared.
In fact, epilepsy is known as a brain network disease that is manifested by sudden and temporary electrical discharge of a group of interconnected neurons. Our goal was to determine whether this effect is also temporal or if it may influence the typical developmental process. Our results showed a significant difference in the power of brain oscillation at the delta frequency band in the middle frontal region (aged 9-12). Based on these results, we believe this effect is more likely to be temporal and may not significantly impact the brain’s oscillatory pattern. Therefore, it appears that the backbone of the brain’s functional network remains intact. However, more investigation using more sophisticated algorithms, such as the investigation of brain functional networks using graph theory, is proposed. Meanwhile, we believe the effect observed in the local addresses is somehow easier to treat.
Although we had a similar number of boys and girls in this study, an investigation of the gender effect with a larger population is proposed for future work. Moreover, structure and hemodynamics also play a major role and should be taken into account. Therefore, a longitudinal study, combined with functional magnetic resonance imaging (fMRI) data, could potentially enhance insight into the findings.
Conclusion
It is believed that behavior and cognitive functions are based on divergence and convergence of oscillatory activities in the brain. Since this oscillatory pattern follows a typical trend during development, it is interesting to know whether this pattern is influenced by abnormal development. In this regard, in a cross-sectional study, two groups of normal and epileptic children at the ages of 6-9 and 9-12 were compared. The results did not show significant changes in power brain waves, and the effect of epilepsy appears to be temporal, with no lasting impact. The results are interesting, but more investigation at the network level using functional connectivity approaches is required. Regional and global parameters of the brain functional connectome may provide a better insight. Nevertheless, based on the current results, it seems that the backbone of the brain functional network is untouched in epileptic children and the disease only targets local addresses. If it is correct, it will be very influential in planning the treatment process and bring hope of incorporating brain stimulation techniques to compensate for the negative effects.
Ethical Considerations
Compliance with ethical guidelines
The experiment was conducted in accordance with the ethical principles for medical research as stated in the Declaration of Helsinki. This study was approved by the Ethics Committee of Iran University of Medical Sciences, Tehran, Iran (Code: IR.IUMS.REC.1401.495).
Funding
This study was extracted from the PhD dissertation of Abdollah Mohammadian, Approved by the Department of Neurology, School of Medicine, Iran University of Medical Sciences, Tehran, Iran. This research did not receive any grant from funding agencies in the public, commercial, or non-profit sectors.
Authors' contributions
Conceptualization, supervision, funding acquisition and resources: Reza Khosrowabadi; Methodology, investigation, data collection, and writing: All authors; Data analysis: Abdollah Mohammadian and Reza Khosrowabadi;
Conflict of interest
The authors declared no conflict of interest.
Acknowledgments
The authors would like to express their gratitude to all participants that contributed in this study and special thanks to the Department of Neurology, Children’s Medical Center, Tehran, Iran, for their technical support during data recording.
References
Studying the developmental pattern of changes in brain structure and function has been a long-standing area of research interest (Sporns, 2014). Researchers are increasingly interested in understanding the procedures and factors that shape and happen in a healthy brain and its typical changes during normal development. They believe such a pattern will help recognize and prognose abnormal brain developments, such as neurodevelopmental disorders, and may help find clues on how the brain could be treated. Undoubtedly, most changes occur during the infancy period and are followed by significant changes in childhood, which gradually decrease as one grows up (Huelke, 1998). Therefore, it seems necessary to investigate the normal growth pattern and its changes in neurodevelopmental disorders. However, as far as we know, there is limited information about the typical developmental pattern in children with epilepsy.
In this regard, advanced neuroimaging technologies can help us measure and track topographical changes in brain networks. Various types of neuroimaging techniques could be employed, among them electroencephalography (EEG), which, due to its low running cost and good temporal resolution, could be a practical choice. Additionally, it is believed that information processing in the brain is a result of the convergence and divergence of neural oscillations (Hermann, 2002). As a result, understanding the pattern of changes in brain waves during development helps in understanding diseases. On the other hand, it is not well recognized whether the pattern of developmental changes in epileptic children is similar to that in typically developing children (Stam et al., 2007).
Epilepsy is one of the most common and important neurodevelopmental problems (Lebel et al., 2008). Since epilepsy is characterized by changes in the electrical activity of the brain that cause sudden changes in behavior, we hypothesized that seizures occur only at a moment in time and have no long-term effects. We aim to show that epilepsy disorder may affect the pattern of neurodevelopmental changes. For this purpose, we used a cross-sectional study to compare changes in brain waves across various brain regions in a group of epileptic children with an age- and gender-matched group of typically developing children, as explained in the following section.
Materials and Methods
The implementation of the study comprises three basic parts: Signal recording, required preprocessing and feature extraction, and modeling (Figure 1).
Study participants
In this study, EEG signals were recorded from 57 children with epilepsy and 57 age- and gender-matched typically developed children. Typically developed children did not have any neurological disorders or other illnesses and did not take any medication. These children, aged 6 to 12, participated in the study with their parents’ or caregivers’ consent. Children with epilepsy were diagnosed with epilepsy by a pediatric neurologist based on clinical interview and examination using an EEG device. All participants were resting in a quiet environment while the signal was recorded.
EEG data recording
Before data recording, participants were informed of the procedure, and an agreement was obtained from their parents. A Nihon Kohden amplifier with a 28-electrode cap was used to record the EEG signal. Signal acquisition was performed for 57 healthy children while their eyes were open during 60 minutes of long-term monitoring at the Department of Neurology, Children’s Medical Center. The use of PEMU (pediatric EEG monitoring usage) is to determine the nature of seizures in children, as well as to localize their focus, and to take preoperative measures for epilepsy surgery (Figure 2).
This ward features a double room for patients and technicians, as well as a room for the pediatric neurologist. The patient’s room is equipped with two cameras for live imaging of the patient and an EEG device with 28 channels for recording. In this room, the nurse and the patient’s companion have the opportunity to report any suspicious activity by the patient in real-time. In this room, the nurses can watch a live ECG as well as a video of the patient. The doctor’s room features a server computer capable of storing data for an extended period and a computer equipped with one of the most advanced systems available. Using this software, doctors can review the images and data of the EEG online and offline, and prepare the final report (Figure 3).
Signal analysis and preprocessing
Signals related to each person have been recorded for an hour in the mentioned state, and then, the parts with the least amount of noise were selected from the artifact-free signals. Specifically, ocular and motion artifacts, as well as electromyograms, were removed by a skilled operator under the supervision of a neurologist. For initial signal preparation, the artifact effect and the city’s electrical interference were removed through the software. The information from 28 EEG electrodes, available in an array format, was converted to be readable in MATLAB. The EEG signals were then filtered in the range of 0.1 to 70 Hz using a FIR filter.
Feature extraction
Extracting appropriate features from EEG signals is of special importance. By selecting these features correctly and paying attention to the presented model, we can demonstrate the brain’s better functioning. In this study, the energy of the EEG signal was calculated using the wavelet transform at conventional frequency bands, including δ, θ, α, β, and γ bands. Finally, the obtained values were provided as input to the proposed model.
A wavelet is a set of mathematical functions used to decompose a continuous signal into its frequency components, and the resolution of each element equals its scale. Considering the better performance and discrimination of the wavelet transform in epilepsy activity compared to the short-time Fourier transform, we use the discrete wavelet transform to extract the features of the signals (Liu et al., 2012). The EEG signal is divided into sub-frequency bands (Table 1).
A discrete wavelet transform is used to analyze the signal at different frequency bands with varying resolutions by decomposing the signal into cumulative estimation (Cj, k) and detailed analysis (dj, k). These coefficients are calculated by Equations 1 and 2.
(t) indicates the basic scaling, ψ(t) indicates the mother wavelet, k indicates the translation parameter, and j indicates the scale index. The inverse discrete wavelet transform is calculated by Equation 3.
In signal processing, the total energy of the discrete time signal x [n] at distance n1≤n≤n2 is defined as (Equation 4):
So that N is the number of di coefficients on the scale l and T is the sampling interval. In this study, the energy of each subband is calculated based on its corresponding energy. The associated energy calculates the signal strength at each time interval. The associated signal energy Er(l) is calculated by Equation 5.
S is the number of wavelet scales.
Examining frequency bands separately plays a crucial role in obtaining high-quality results. The choice of frequency bands was made based on the results of the power spectrum analysis. Using the fast Fourier transform (FFT), the power of the EEG signal spectrum is converted from the time domain to the frequency domain. By calculating the ratio of the power spectrum of each frequency band to the total power in the range of 1 to 40 Hz, with a frequency separation of 0.001 Hz, the relative spectral power of all 28 channels is obtained. The paradigm of power spectral analysis, based on frequency changes in frequency bands described in Table 2, was selected for further analysis (Samimi Sabet et al., 2019).
Statistical analysis
After performing the Kolmogorov-Smirnov normalization test, analysis of variance with a post hoc test using the t-test was applied to the power spectrum features. The power spectrum was calculated with a frequency resolution of 1 Hz, and for each frequency, band comparisons were made separately.
Results
The power spectra of resting-state EEG data from epileptic and typically developing children were statistically compared in two separate age ranges: 6-9 and 9-12 years.
Comparison between epileptic and normal children (6-9 years)
As presented in Figure 4, smaller lower-frequency activities were observed in epileptic children at C3, C4, and Cz in the frequency range of 1-4 Hz. For the theta, lower alpha, β1, and β2 frequency bands, lower activity was also observed at C3 in epileptic children. However, this effect was bilateral at C3 and C4 for the upper alpha band and β3 and lower gamma frequencies.
Comparison between epileptic and normal children (9-12 years)
As presented in Figure 5, smaller, lower-frequency activities were observed in epileptic children at the middle frontal region (Fz) in the frequency range of 1-4 Hz, specifically in the β4 and lower gamma band activities. For the theta, β1, β2, and β3 frequency bands, lower activities were also observed at the Fz, C3, and C4 sites in epileptic children. While this effect was bilateral at C3 and C4, it was observed for the alpha band frequencies.
Discussion
Studies of functional brain connectivity in humans have shown that most studies indicate a small-world pattern for functional connectivity, although scale-free networks have also been described (Eguiluz et al., 2005). The architecture of functional brain networks may reflect genetic factors and is related to cognitive performance. Different types of brain disease can sometimes give rise to more random networks, which may be associated with cognitive problems as well as a lower threshold for seizures (pathological hypersynchronization) (Stam et al., 2007). According to previous studies on the modern theory of networks, particularly in large-scale networks such as the brain, the following reasons can be put forward for the use of brain network modeling. First, the new theory of powerful realistic models of complex networks gives us access to the brain. Second, a large number of efforts to study the topological and dynamical properties of these networks continue to grow. Third, this theory enables us to understand better the correlations between network structure and the processes occurring within these networks, particularly synchronization processes. Fourth, by relating structure to function, network changes can be investigated. Ultimately, these investigations offer insights into how complex networks may evolve and respond to various types of diseases.
Other studies have demonstrated that the small-world topology of functional brain networks is highly consistent across various techniques, conditions, and frequency bands. Furthermore, the architecture of functional brain networks may reflect genetic factors and be related to cognitive function. Different types of brain diseases can disrupt the optimal pattern of the small world, sometimes causing more random networks that may be associated with cognitive problems, as well as a lower threshold for seizures (pathological hypersynchrony). It has been shown in studies that various types of brain disease, such as Alzheimer disease, schizophrenia, brain tumors, and epilepsy, may be associated with deviations of the functional network topology from the optimal small-world pattern (Stam et al., 2007). Developmental studies on the activity patterns and organization of the brain have indicated a specific association between brain structural and functional organization and abnormalities observed in neurodevelopmental diseases. Considering that the developmental process leads to significant changes in network topology, it provides a possibility to investigate optimal changes in typically developed children and compare them with other network topologies, such as those found in neurodevelopmental disorders. If we consider brain signals as the language of the brain, through which the brain provides us with reliable information about some of its activities and interactions, certain information and features can be extracted by accurately recording EEG signals and processing them effectively.
The brain exhibits significant growth over time on both macroscopic and microscopic scales. At the cellular level, the brain begins to grow an abundance of synaptic connections, with almost half of them lost by the age of around 6. This pruning process could potentially influence the brain’s oscillatory patterns, and deviations from them may cause drastic changes in behavior and cognitive functions. The question raised in this study was whether this process differs in typically developed and epileptic children. Therefore, in a cross-sectional study, the brain oscillatory pattern of the two groups was statistically compared.
In fact, epilepsy is known as a brain network disease that is manifested by sudden and temporary electrical discharge of a group of interconnected neurons. Our goal was to determine whether this effect is also temporal or if it may influence the typical developmental process. Our results showed a significant difference in the power of brain oscillation at the delta frequency band in the middle frontal region (aged 9-12). Based on these results, we believe this effect is more likely to be temporal and may not significantly impact the brain’s oscillatory pattern. Therefore, it appears that the backbone of the brain’s functional network remains intact. However, more investigation using more sophisticated algorithms, such as the investigation of brain functional networks using graph theory, is proposed. Meanwhile, we believe the effect observed in the local addresses is somehow easier to treat.
Although we had a similar number of boys and girls in this study, an investigation of the gender effect with a larger population is proposed for future work. Moreover, structure and hemodynamics also play a major role and should be taken into account. Therefore, a longitudinal study, combined with functional magnetic resonance imaging (fMRI) data, could potentially enhance insight into the findings.
Conclusion
It is believed that behavior and cognitive functions are based on divergence and convergence of oscillatory activities in the brain. Since this oscillatory pattern follows a typical trend during development, it is interesting to know whether this pattern is influenced by abnormal development. In this regard, in a cross-sectional study, two groups of normal and epileptic children at the ages of 6-9 and 9-12 were compared. The results did not show significant changes in power brain waves, and the effect of epilepsy appears to be temporal, with no lasting impact. The results are interesting, but more investigation at the network level using functional connectivity approaches is required. Regional and global parameters of the brain functional connectome may provide a better insight. Nevertheless, based on the current results, it seems that the backbone of the brain functional network is untouched in epileptic children and the disease only targets local addresses. If it is correct, it will be very influential in planning the treatment process and bring hope of incorporating brain stimulation techniques to compensate for the negative effects.
Ethical Considerations
Compliance with ethical guidelines
The experiment was conducted in accordance with the ethical principles for medical research as stated in the Declaration of Helsinki. This study was approved by the Ethics Committee of Iran University of Medical Sciences, Tehran, Iran (Code: IR.IUMS.REC.1401.495).
Funding
This study was extracted from the PhD dissertation of Abdollah Mohammadian, Approved by the Department of Neurology, School of Medicine, Iran University of Medical Sciences, Tehran, Iran. This research did not receive any grant from funding agencies in the public, commercial, or non-profit sectors.
Authors' contributions
Conceptualization, supervision, funding acquisition and resources: Reza Khosrowabadi; Methodology, investigation, data collection, and writing: All authors; Data analysis: Abdollah Mohammadian and Reza Khosrowabadi;
Conflict of interest
The authors declared no conflict of interest.
Acknowledgments
The authors would like to express their gratitude to all participants that contributed in this study and special thanks to the Department of Neurology, Children’s Medical Center, Tehran, Iran, for their technical support during data recording.
References
Eguiluz, V. M., Chialvo, D. R., Cecchi, G. A., Baliki, M., & Apkarian, A. V. (2005). Scale-free brain functional networks. Physical Review Letters, 94(1), 018102. [DOI:10.1103/PhysRevLett.94.018102]
Hermann, B. P., Seidenberg, M., & Bell, B. (2002). The neurodevelopmental impact of childhood onset temporal lobe epilepsy on brain structure and function and the risk of progressive cognitive effects. Progress in Brain Research, 135, 429–438. [DOI:10.1016/S0079-6123(02)35040-4] [PMID]
Huelke, D. F. (1998). An Overview of Anatomical Considerations of Infants and Children in the Adult World of Automobile Safety Design. Annual Proceedings / Association for the Advancement of Automotive Medicine, 42, 93-113. [PMCID]
Lebel, C., Walker, L., Leemans, A., Phillips, L., & Beaulieu, C. (2008). Microstructural maturation of the human brain from childhood to adulthood. NeuroImage, 40(3), 1044–1055.[DOI:10.1016/j.neuroimage.2007.12.053] [PMID]
Liu, Y., Zhou, W., Yuan, Q., & Chen, S. (2012). Automatic seizure detection using wavelet transform and SVM in long-term intracranial EEG. IEEE Transactions on Neural Systems and Rehabilitation Engineering: A Publication of the IEEE Engineering in Medicine and Biology Society, 20(6), 749–755. [DOI:10.1109/TNSRE.2012.2206054] [PMID]
Newman M. Networks: An introduction. Oxford: Oxford University Press; 2010. [Link]
Samimi Sabet, P. S., Javadi, F., Pouretemad, H., & Khosrowbadi, R. (2019). Developmental changes in backbone of brain functional network during the infancy period. NeuroQuantology, 17(6), 32-41. [DOI:10.14704/NQ.2019.17.06.2387]
Sporns, O., 2014. Contributions and challenges for network models in cognitive neuroscience. Nature Neuroscience, 17(5), 652–660. [DOI:10.1038/nn.3690] [PMID]
Stam, C. J., Nolte, G., & Daffertshofer, A. (2007). Phase lag index: assessment of functional connectivity from multi channel EEG and MEG with diminished bias from common sources. Human Brain Mapping, 28(11), 1178–1193. [DOI:10.1002/hbm.20346] [PMID]
Type of Study: Original |
Subject:
Cognitive Neuroscience
Received: 2022/10/15 | Accepted: 2022/11/21 | Published: 2025/09/1
Received: 2022/10/15 | Accepted: 2022/11/21 | Published: 2025/09/1
Send email to the article author
| Rights and permissions | |
 |
This work is licensed under a Creative Commons Attribution-NonCommercial 4.0 International License. |
![]()
Copyright © The Author(s);
This is an open access article distributed under the terms of the Creative Commons Attribution License (CC-By-NC), which permits use, distribution, and reproduction in any medium, provided the original work is properly cited and is not used for commercial purposes.
Contact Information
