

Volume 14, Issue 6 (November & December 2023)
BCN 2023, 14(6): 827-842 |
Back to browse issues page


Download citation:
BibTeX | RIS | EndNote | Medlars | ProCite | Reference Manager | RefWorks
Send citation to:


BibTeX | RIS | EndNote | Medlars | ProCite | Reference Manager | RefWorks
Send citation to:
Saraiepour S, Kahrizi S, Ghabaee M, Bazrgari B. Mapping the Cortical Representation of Paraspinal Muscles Using Transcranial Magnetic Stimulation Optimized in People With Chronic Back Pain. BCN 2023; 14 (6) :827-842
URL: http://bcn.iums.ac.ir/article-1-2511-en.html
URL: http://bcn.iums.ac.ir/article-1-2511-en.html


1- Department of Physiotherapy, Faculty of Medical Sciences, Tarbiat Modares University, Tehran, Iran.
2- Department of Neurology, Faculty of Medical Sciences, Iranian Center of Neurological Research, Neuroscience Institute, Tehran University of Medical Sciences, Tehran, Iran.
3- Department of Biomedical Engineering, University of Kentucky, Lexington, United States.
2- Department of Neurology, Faculty of Medical Sciences, Iranian Center of Neurological Research, Neuroscience Institute, Tehran University of Medical Sciences, Tehran, Iran.
3- Department of Biomedical Engineering, University of Kentucky, Lexington, United States.
Keywords: Brain mapping, Paraspinal muscles, Cortical representation, Transcranial magnetic stimulation, Chronic low back pain, Motor evoked potential
Full-Text [PDF 1166 kb]
| Abstract (HTML)
Full-Text:
1. Introduction
Chronic lower back pain (CLBP) is the leading cause of disability worldwide (GBD 2015 disease and injury incidence and prevalence collaborators, 2016), with annual health costs estimated to be over 100 billion dollars (Katz, 2006). Yet uncertainty about the etiology of low back pain (LBP) chronification hampers its proper resolution (Wand & O’Connell, 2008). According to the International Association for the Study of Pain (IASP), CLBP is defined when the LBP lasts beyond normal tissue healing time (Merske, 1986), i.e. more than 12 weeks (Hoy et al., 2014) and previous treatments have been incapable of its management (Wand et al., 2011). More than 500 theories have been proposed to explain the process of transition from the acute to the chronic stage in CLBP. In one of these theories, the perpetuation of motor control deficits of back muscles after the acute phase of LBP has been blamed for the persistence of LBP (Tsao et al., 2008). The central nervous system (CNS) is in charge of providing the motor control of the back muscles and maintaining the stability of the spine (Hodges & Moseley, 2003) in terms of the order of the recruitment of back muscles and the rate of force production in them (Vogt et al., 2003).
It has been suggested that at least some sort of LBP may happen as a result of shortcomings in the CNS to provide suitable motor control of back muscles due to pain syndromes (Janda, 1978). It is believed that improper control of back muscles can lead to repeated microtrauma, joint injury, and ongoing stimulation of the nociceptors in the back (Farfan, 1973; Panjabi, 1992). There is some debate about the origin of these control deficiencies in the CNS. Although changes in excitability have been documented at different levels of neuroaxis from motor neurons (Cram & Steger, 1983) to motor cortex (Strutton et al., 2005) in the presence of experimental LBP, inter-individual variability observed in motor control deficits among people with CLBP (Van Dieën et al., 2019) suggests the involvement of supraspinal mechanisms in areas involved in motor planning in the development of such deficits (Hodges & Moseley, 2003). As the role of the primary motor cortex (M1) has been established in the execution and formulation of movements, dysfunction of M1 has also been suggested as a possible culprit for motor control deficits observed among people with CLBP (Chang et al., 2018). For decades, knowledge about the CNS was provided only by autopsy material (May, 2008). Nowadays, the functional organization of the M1 can be studied using transcranial magnetic stimulation (TMS), noninvasively and painlessly in vivo (Barker et al., 1985).
Preliminary studies have demonstrated some alterations in the representational fields of back muscles in M1 in people with CLBP, which include a reduced number of discrete peaks and smudging of the cortical representation of back muscles in people with CLBP (Tsao et al., 2011b), which has been related to the severity of back pain (Schabrun et al., 2017). It is noteworthy to mention that cortical maps of back muscles are separated and contain at least two peaks in normal healthy volunteers (O’Connell et al., 2007; Tsao et al., 2011a). Although researchers argue that these alterations in representational fields of back muscles in M1 in people with CLBP may explain the loss of differential function in superficial and deep layers of back muscles and their en masse recruitment (Tsao et al., 2011a), a definite interpretation of these findings warrants further replication of TMS mapping studies targeting representation of back muscles to explore their behavioral relevance (Massé‐Alarie et al., 2017b). However, mapping the cortical representation of trunk muscles, especially back muscles, via TMS is challenging (O’Connell et al., 2007).
Depending on the frequency of delivery, TMS can either activate or disrupt the activity of cortical neurons temporarily (Savoy, 2001). Any response to TMS may be used to map the functional organization of the brain (Novikov et al., 2018). When TMS is applied to M1 with ample intensity, cortical motor neurons are depolarized, and when the action potential resulting from this depolarization reaches spinal motor neurons, a motor response is generated in peripheral muscles known as motor evoked potential (MEP), which can be recorded by electromyography (EMG) (Zewdie & Kirton, 2016). The MEP amplitudes are then used to construct the cortical maps of different skeletal muscles by outlining the cortical territory in M1 where its stimulation via TMS results in MEP production in the corresponding muscle (Rossini et al., 2015), considering the point where its stimulation in M1 evokes the largest and most consistent MEP amplitudes as the peak or hotspot of the cortical map (Zewdie & Kirton, 2016).
However, MEPs from paraspinal muscles are more polyphasic with fewer evident positive or negative peaks (Groppa et al., 2012), which can be easily missed in the background noise of EMG (Fuhr et al., 1991b) compared to MEPs from distal limb muscles. Figure 1 depicts this difference. On the other hand, the area devoted to controlling back muscles in M1 or, in other words, their cortical representation in M1 is much smaller compared to hand muscles (Penfield & Boldrey, 1937), receive fewer corticospinal projections (Kiers et al., 1993) and cortical points, which can evoke a MEP in paraspinal muscles are situated closer together in M1 (Capaday et al., 2013). This item raises the motor threshold of the cortical representation of back muscles to TMS, i.e. the TMS intensity needed to stimulate the cortical maps of back muscles to evoke measurable MEPs (≥50 µv) (Julkunen et al., 2016), which is much higher compared to distal hand muscles (Kiers et al., 1993).

To overcome these challenges, previous studies have tried to activate back muscles at 20% of maximal voluntary contraction (MVC) and used maximum stimulator output (100% MSO) (Ferbert et al., 1992; O’Connell et al., 2007; Kuppuswamy et al., 2008; Tsao et al., 2011a; Tsao et al., 2011b). It has been shown that both increasing the TMS stimulator intensity and activating the muscles increase the corticospinal excitability (CSE) toward the muscle that is going to be mapped and results in recordings larger and more visible from that muscle (Van De Ruit & Grey, 2016). Despite taking these measures, still, mapping failure in some of the participants has been reported in the abovementioned studies because the MTh exceeds the MSO in a subgroup of participants. An obvious flaw in these studies appears to be the use of 20% MVC for mapping the cortical representation of back muscles, which is based on studies demonstrating that CSE to upper (Hess et al., 1987) and lower limb (Turton & Lemon, 1999) muscles peak at 20% MVC and then plateaus.
Meanwhile, it has been shown that CSE to back muscles has a more linear relationship with MVC% and reaches its maximum at 90-100% of MVC (Lagan et al., 2008; Jaberzadeh et al., 2013). Furthermore, increases in MVC have been shown to significantly decrease MEP amplitude variability (Kiers et al., 1993) and increase MEP size in paraspinal muscles (Jaberzadeh et al., 2013). Moreover, the results of a recent counterintuitive study have shown that CSE to paraspinal muscles is task-specific and the largest MEPs can be recorded from these muscles while they are engaged in an anticipatory postural adjustment activity (APA) (Chiou et al., 2016). These factors, while they can be a game changer for obtaining measurable MEPs from paraspinal muscles suitable for cortical mapping, have not been taken into consideration in designing mapping protocols for back muscles.
Finally, single monophasic TMS pulses (spTMS), which are commonly used for brain mapping due to their higher recovery rate (Pitkänen et al., 2018), have been shown to be impractical and not potent enough to stimulate M1 in cases with severely diminished CSE (Sollmann et al., 2020). This can be implied for people with CLBP as lowered CSE has also been documented in this group of patients (Strutton et al., 2005). Biphasic TMS pulses, which are stronger and can induce similar effects but with less intensity have become available recently (Pitkänen et al., 2018). In a recent study, a combination of biphasic TMS pulses with paired-pulse (ppTMS) paradigms that induce short-term intracortical facilitation (SICF) (Ortu et al., 2008) was successfully employed to map the cortical representation of upper extremity muscles in people with severely diminished CSE who harbored brain tumors (Sollmann et al., 2020). Despite the potential advantage of biphasic ppTMS for mapping thecortical representation of back muscles in people with CLBP, this method has not been put into trial for people with CLBP.
In this study, in a pilot attempt to map the cortical representation of back muscles in a cohort of people with CLBP, MEPs were not recognizable from the background noise in any of our participants. We assumed that it might be due to the double baseline noise reported for the TMS stimulator we used compared to the stimulator used by previous studies (MagVenture vs Magstim) (Van Doren et al., 2015), which had possibly obscured the inherently small MEPs from paraspinal muscles (Fuhr et al., 1991a). We hypothesized that by tailoring a mapping protocol specifically designed to meet the unique requirements of the cortical representation of the back muscles, we would be able to facilitate mapping the cortical representation of the paraspinal muscles.
2. Materials and Methods
Subjects
This study included eighteen patients (eight males and ten females) aged 36.53±6.52 years with unilateral non-specific CLBP who had experienced LBP for more than three months. Previous studies had suggested that unilateral pain sensations may play a role in the reorganization of the motor cortical representation of the affected side through transcallosal connections of M1 areas between two hemispheres (Murase et al., 2004; Krause et al., 2006). Thus, the inclusion criteria were having unilateral nonspecific CLBP defined as any pain, muscle tension, or stiffness below the costal margins and above the inferior gluteal folds with or without leg pain (sciatica) (Koes et al., 2006) lasting longer than three months, including periods of exacerbation and remission of pain, with pain more intense on one side and severe enough to interfere with daily activities (Von Korff et al., 1990). Patients went through a medical history taking and brief physical examination (Van Tulder et al., 2006) and were asked to rate their current pain, mean pain over the previous week, and the maximum pain they felt at the onset of their first episode of LBP on a 100 mm visual analog scale (VAS) between 0 and 10, with zero indicating no pain at all and ten indicating the maximum perceivable pain. Participants were only brain-mapped if they were in remission and their current pain was less than two on the VAS on the trial day, allowing them to withstand the cortical mapping process without exacerbating their symptoms.
The exclusion criteria were non-mechanical LBP or specific LBP, which symptoms were caused by specific, recognizable known pathophysiological mechanisms, such as osteoporosis, tumor, infection, malignancy, fracture, rheumatoid arthritis, structural deformities, cauda equina syndrome, or radicular neuropathies (Koes et al., 2006), back surgery, recent lumbar infiltration, any major circulatory, orthopedic or neurological disorder, pregnancy, and any contraindication to TMS, such as a family history of epilepsy, metallic implants in the head or jaw, a history of brain concussion, surgery, ear tinnitus, cardiac implants, or taking any medication that increased the risk of seizure. TMS contraindications are covered in greater detail elsewhere (Rossi et al., 2009).
TMS mapping
The MagVenture Company’s butterfly coil coolb-65 and MagPro X100 TMS machines were used to stimulate M1 in the contralateral hemisphere to the most painful side of the lower back pain in one-centimeter steps from 2 cm posterior to the vertex (CZ) to 5 cm anterior and from vertex to 5 cm lateral on a 5×7 cm plastic grid that was assembled on a snug swimming cap worn by participants with reference to CZ (0, 0).
The coil handle was positioned along the sagittal plane to create an electrical current in the brain in the postero-anterior (PA) direction (Tsao et al., 2011b). For mapping, a paired-pulse paradigm for SICF was adopted, with a test stimulus (TS) at 100% of resting motor threshold (rMT) preceding a conditioning stimulus (CS) at 90% of rMT and an inter-stimulus interval (ISI) of 1 ms (Ziemann et al., 1998; Ortu et al., 2008; Massé-Alarie et al., 2016). The rMT was defined as the lowest TMS stimulator output or intensity that could evoke MEPs with ≥50µv in five out of ten consecutive TMS trials (Massé-Alarie & Schneider, 2016). Because calculating the rMT and/or active motor threshold for paravertebral muscles using single monophasic or biphasic TMS pulses via butterfly coli cool b65 from MagVenture was impossible, the rMT for abductor pollicis brevis (APB) muscle was calculated, following the manufacturer’s instructions (Tonika Electronic A/S 2010), to be used in the paired-pulse paradigm for SICF of cortical representation of paraspinal muscles. Choosing the rMT of APB was based on studies using APB rMT as a general reference for CSE for mapping multiple muscles (Krieg et al., 2012; Krieg et al., 2013; Krieg et al., 2015; Bulubas et al., 2016; Sollmann et al., 2017a; Sollmann et al., 2017b). To map the cortical representation of paraspinal muscles, three paired-pulse were administered to each cross-section of the grid with a delay of 10 seconds, as shorter time lags were associated with a lower chance of evoking MEPs demonstrated in the pilot trial.
Participants were instructed to sit on the edge of an armless chair with their feet flat on the ground and arch their back with maximal voluntary contraction i.e. contracting the back muscles by keeping them in lordosis with as much effort as possible with minimal pain or discomfort, and simultaneously elevating the contralateral arm to the painful side of the back to 90° of shoulder flexion as quickly as possible upon hearing the “go” command from the TMS operator.
The operator delivered the TMS pulses at pre-marked scalp sites coincident with commanding “go” at time zero. It has been shown that in the time window of 0–120 ms after the “go” command, CSE to paraspinal muscles increases, and larger MEPs can be recorded during this period (Petersen et al., 2009). This is due to the release of cortical inhibition before trunk muscle activation onset, which occurs with a time lag of 150–180 ms after the “go” command (Hodges & Richardson, 1997; Massé-Alarie et al., 2018).
Under the supervision of the physiotherapist, the correct form of paravertebral muscles’ contraction was rehearsed by the participants several times before the initiation of the mapping procedure with the help of verbal cues, palpation, and imagery techniques (Massé-Alarie et al., 2017a).
EMG
MEPs were recorded from paravertebral muscles ipsilateral to the most painful side of the back, using the MEP monitor of the MagVenture Magprox100 TMS machine, which has a built-in one-channel EMG device mounted on the back of this device, via disposable self-adhesive Ag/Agcl FDA registered surface electrodes from INTCO Company. The MEP monitor of MagVenture manifests only post-TMS stimulus events and not real-time EMG. EMG data were amplified 5000 times, band pass filtered between 20 and 1000 Hz, sampled at 100 kHz, and saved to a USB drive for later analysis.
With the ground electrode on the sacrum, MEPs from the painful side of the back were recorded using two active electrodes laid parallel to the spine 2 cm lateral to the spinous process of the third lumbar vertebra (L3) on the bulk of paravertebral muscles with an inter-electrode distance of 2 cm (Criswell, 2010).
TMS data analysis
The most pronounced MEP out of the three was chosen. MEPs were not averaged due to the enormous variability (Kiers et al., 1993) seen between trials. MEP latencies, expressed in milliseconds, indicated the time it took for TMS-induced descending impulses to reach the paraspinal muscles (Abbruzzese & Trompetto, 2017) and were defined as the moment of initial upward or downward deflection of the MEP response from the baseline observed in EMG (Oh et al., 2017). MEP amplitudes were calculated as the voltage difference between the most negative and most positive peak of the MEP signal in the MEP time window (12-50 msec) (Ferbert et al., 1992; O’Connell et al., 2007; Smith et al., 2019; Jenkins et al., 2021). MEP amplitudes were normalized with respect to the peak MEP amplitude recorded and rescaled between 0 and 100 (Tsao et al., 2011a) by MATLAB software, version 2020B. The MEP with the largest amplitude was attained by delivering TMS to the hotspot, which is a cortical point that evokes the largest MEP in a given muscle (Uy et al., 2002). The hotspot was found by moving the stimulating coil to different positions on the pre-marked grid on the scalp to find the point with the lowest threshold that evoked the largest MEP (Wassermann et al., 1992). MEP amplitudes that were <25% of the peak amplitude were discarded, as it has been demonstrated that discarding MEP values <25% of the peak MEP amplitude does not affect TMS maps significantly (Tsao et al., 2011b). Normalized MEP’s amplitudes were superimposed on the respective scalp sites for map construction (Tsao et al., 2011a; Tsao et al., 2011b). For the constructed maps, the following items were calculated: Map area (number of scalp active sites), a scalp point was considered active if it evoked MEPs were >25% of the peak MEP (Schabrun et al., 2017), map volume (sum of MEP amplitudes recorded from all active scalp sites) (Wassermann et al., 1992), coordinates of the center of gravity (CoG) or amplitude weighted center of the map, which was defined as the spatial mean of the motor cortical maps (Uy et al., 2002) weighted by the amplitude of the MEPs evoked from different scalp sites and calculated using the Equation 1:

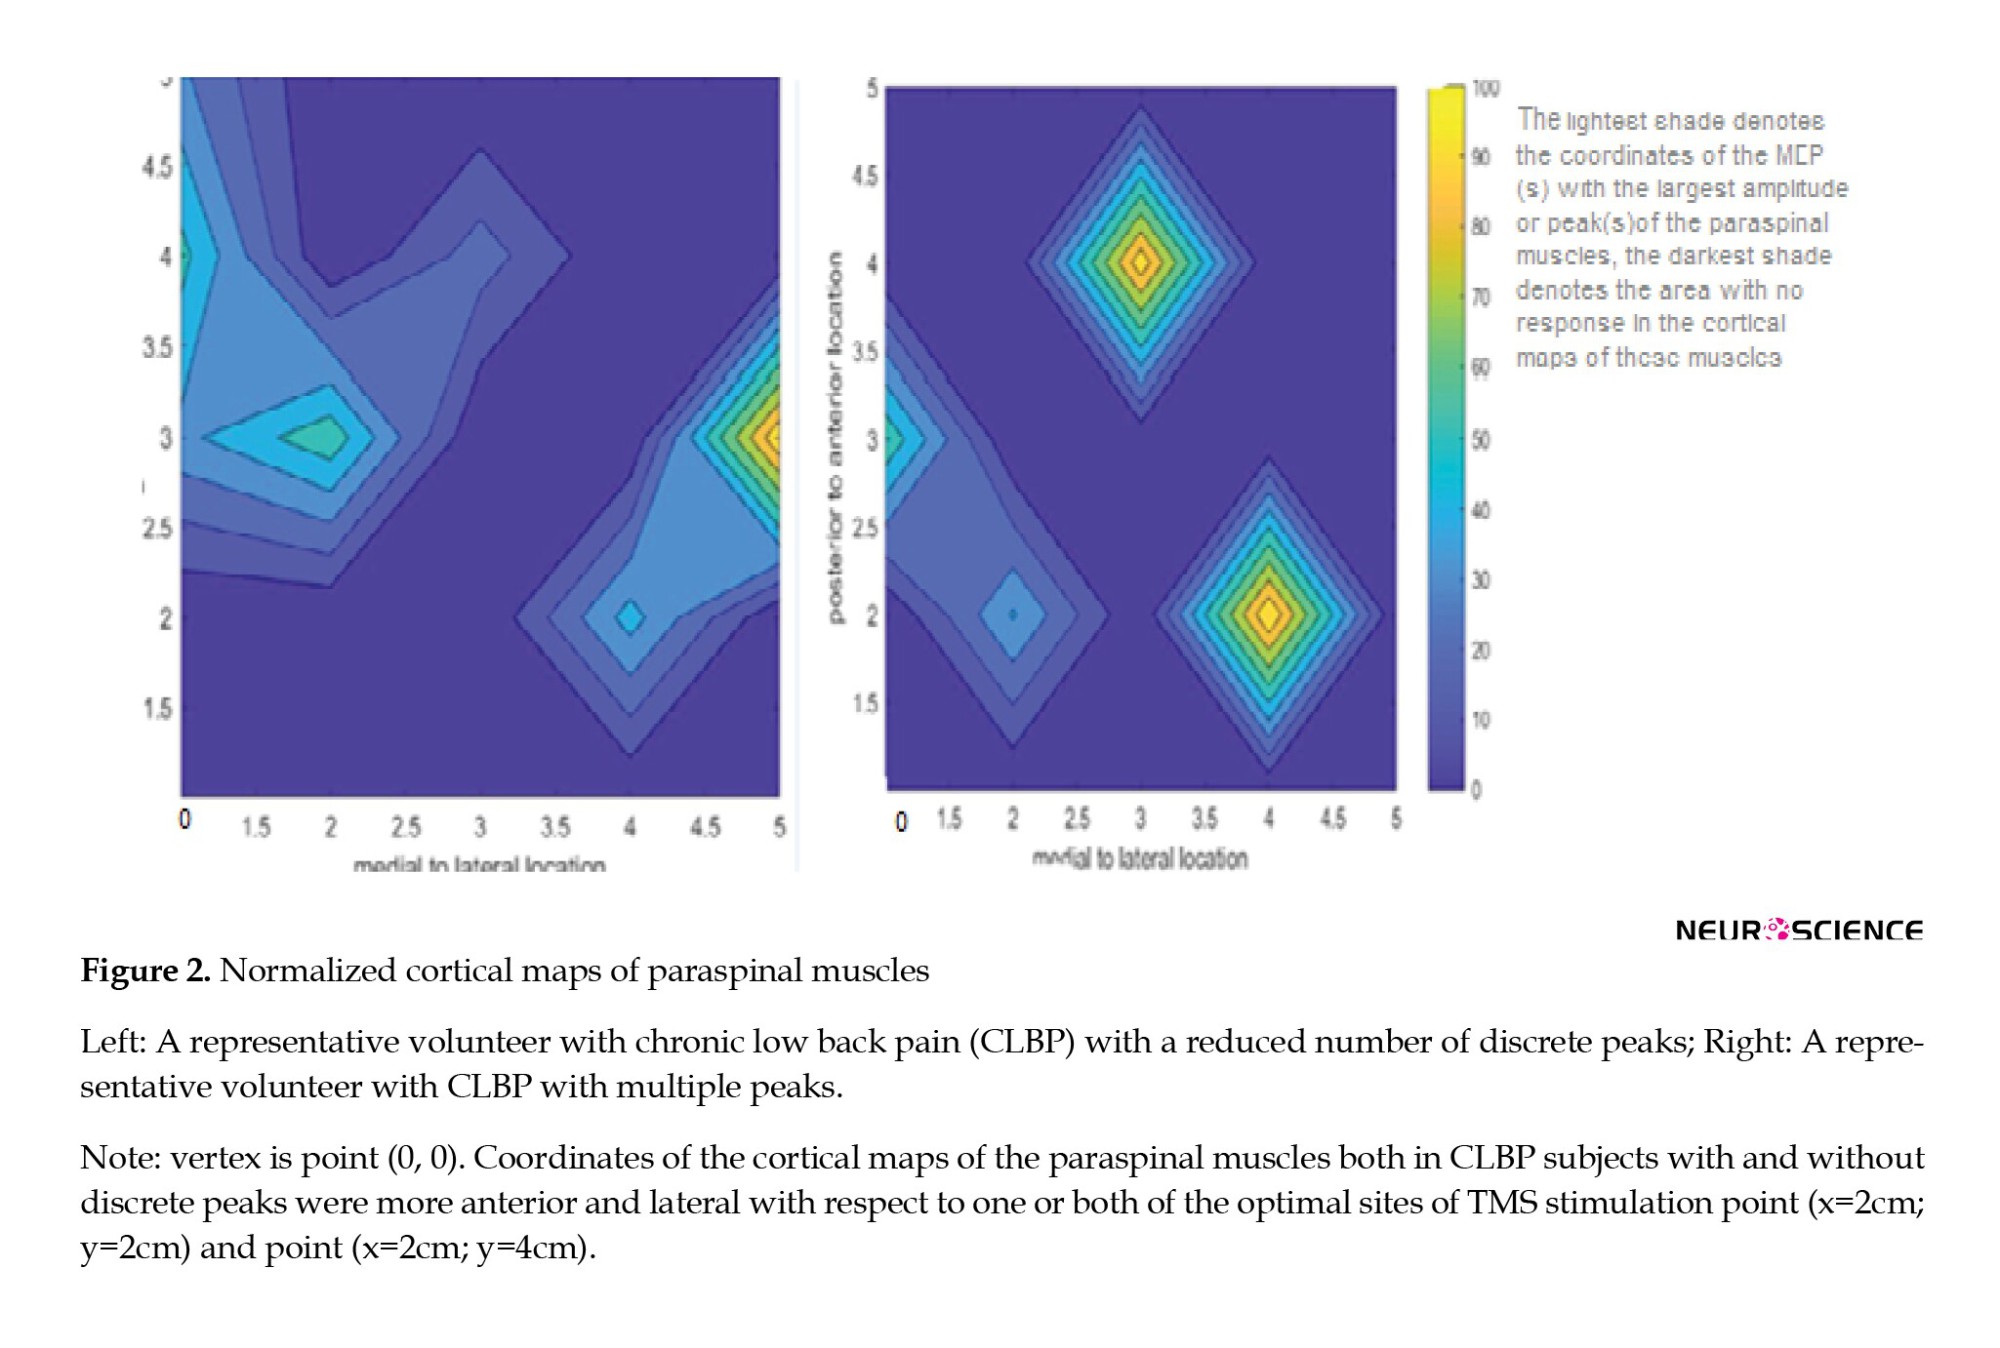
(Vi is normalized MEP amplitude at each point with coordinates xi as medio-lateral direction and yi as anteroposterior direction) (Tsao et al., 2011b), and the number of discrete peaks based on the criterion suggested earlier for identification of separate peaks (Schabrun et al., 2017). Maps constructed for two representative subjects with and without discrete peaks are depicted in Figure 2.
Statistical analysis
SPSS software, version 26 was used for statistical analysis. Continuous data are represented as Mean±SD, whereas categorical data are represented as percentages. Both mean and maximum pain intensity and disability were regarded as continuous data. The Shapiro-Wilk test was used to assess the normality of our data. When data were not normally distributed, the independent t-test was used to compare mapping outcomes between the two recognized subgroups of CLBP. A Mann-Whitney U test was used as a surrogate for the t-test. Hedges’ g was used to calculate the effect size for scale data, and odd ratios (Eta squared) were used to calculate the effect size for categorical data. The Pearson correlation coefficient was used to assess the possible relationships between the mapping outcomes and the continuous demographic characteristics of the participants. To compare categorical data, the chi-squared test was used for a similar purpose. The level of significance was set at α≤0.05. One-sample t-test was used to compare the data with the normative data presented by previous studies in the field of COG delay and position in people with acute back pain. The P reported are from the t-test for all parameters except maximum pain experienced at the onset of LBP and sex (Mann Whitney U and chi-square tests, respectively). The level of significance was set at α≤0.05 for all tests. Mean and maximal pain were considered continuous data. Since the onset of LBP, the pain duration included both stages of remission and exacerbation. effect size for scale data was measured by Hedges’ g, and the effect size for categorical data was calculated via an odd ratio.
3. Results
Mapping the cortical representation of paraspinal muscles was possible in all participants with CLBP with TMS intensities as low as the motor threshold of the APB muscle, i.e. 49%±0.08% MSO. A reduced number of discrete peaks was demonstrated in 33% of the participants, while the rest (67%) showed discrete peaks in their cortical map of the paraspinal muscles. All variables were normally distributed except for the maximum pain experienced at the onset of LBP (P=0.00) and the mean latency at all active sites (P=0.008). We did not find any statistically significant correlation between the mapping parameters and symptom-related outcomes (pain intensity or duration and self-reported disability).
Pain duration from the onset of the first episode of LBP was longer in CLBP participants with reduced cortical peaks (Table 1), although this was not statistically significant (P>0.05) and the effect size was low to medium (Hedges’g=0.37).

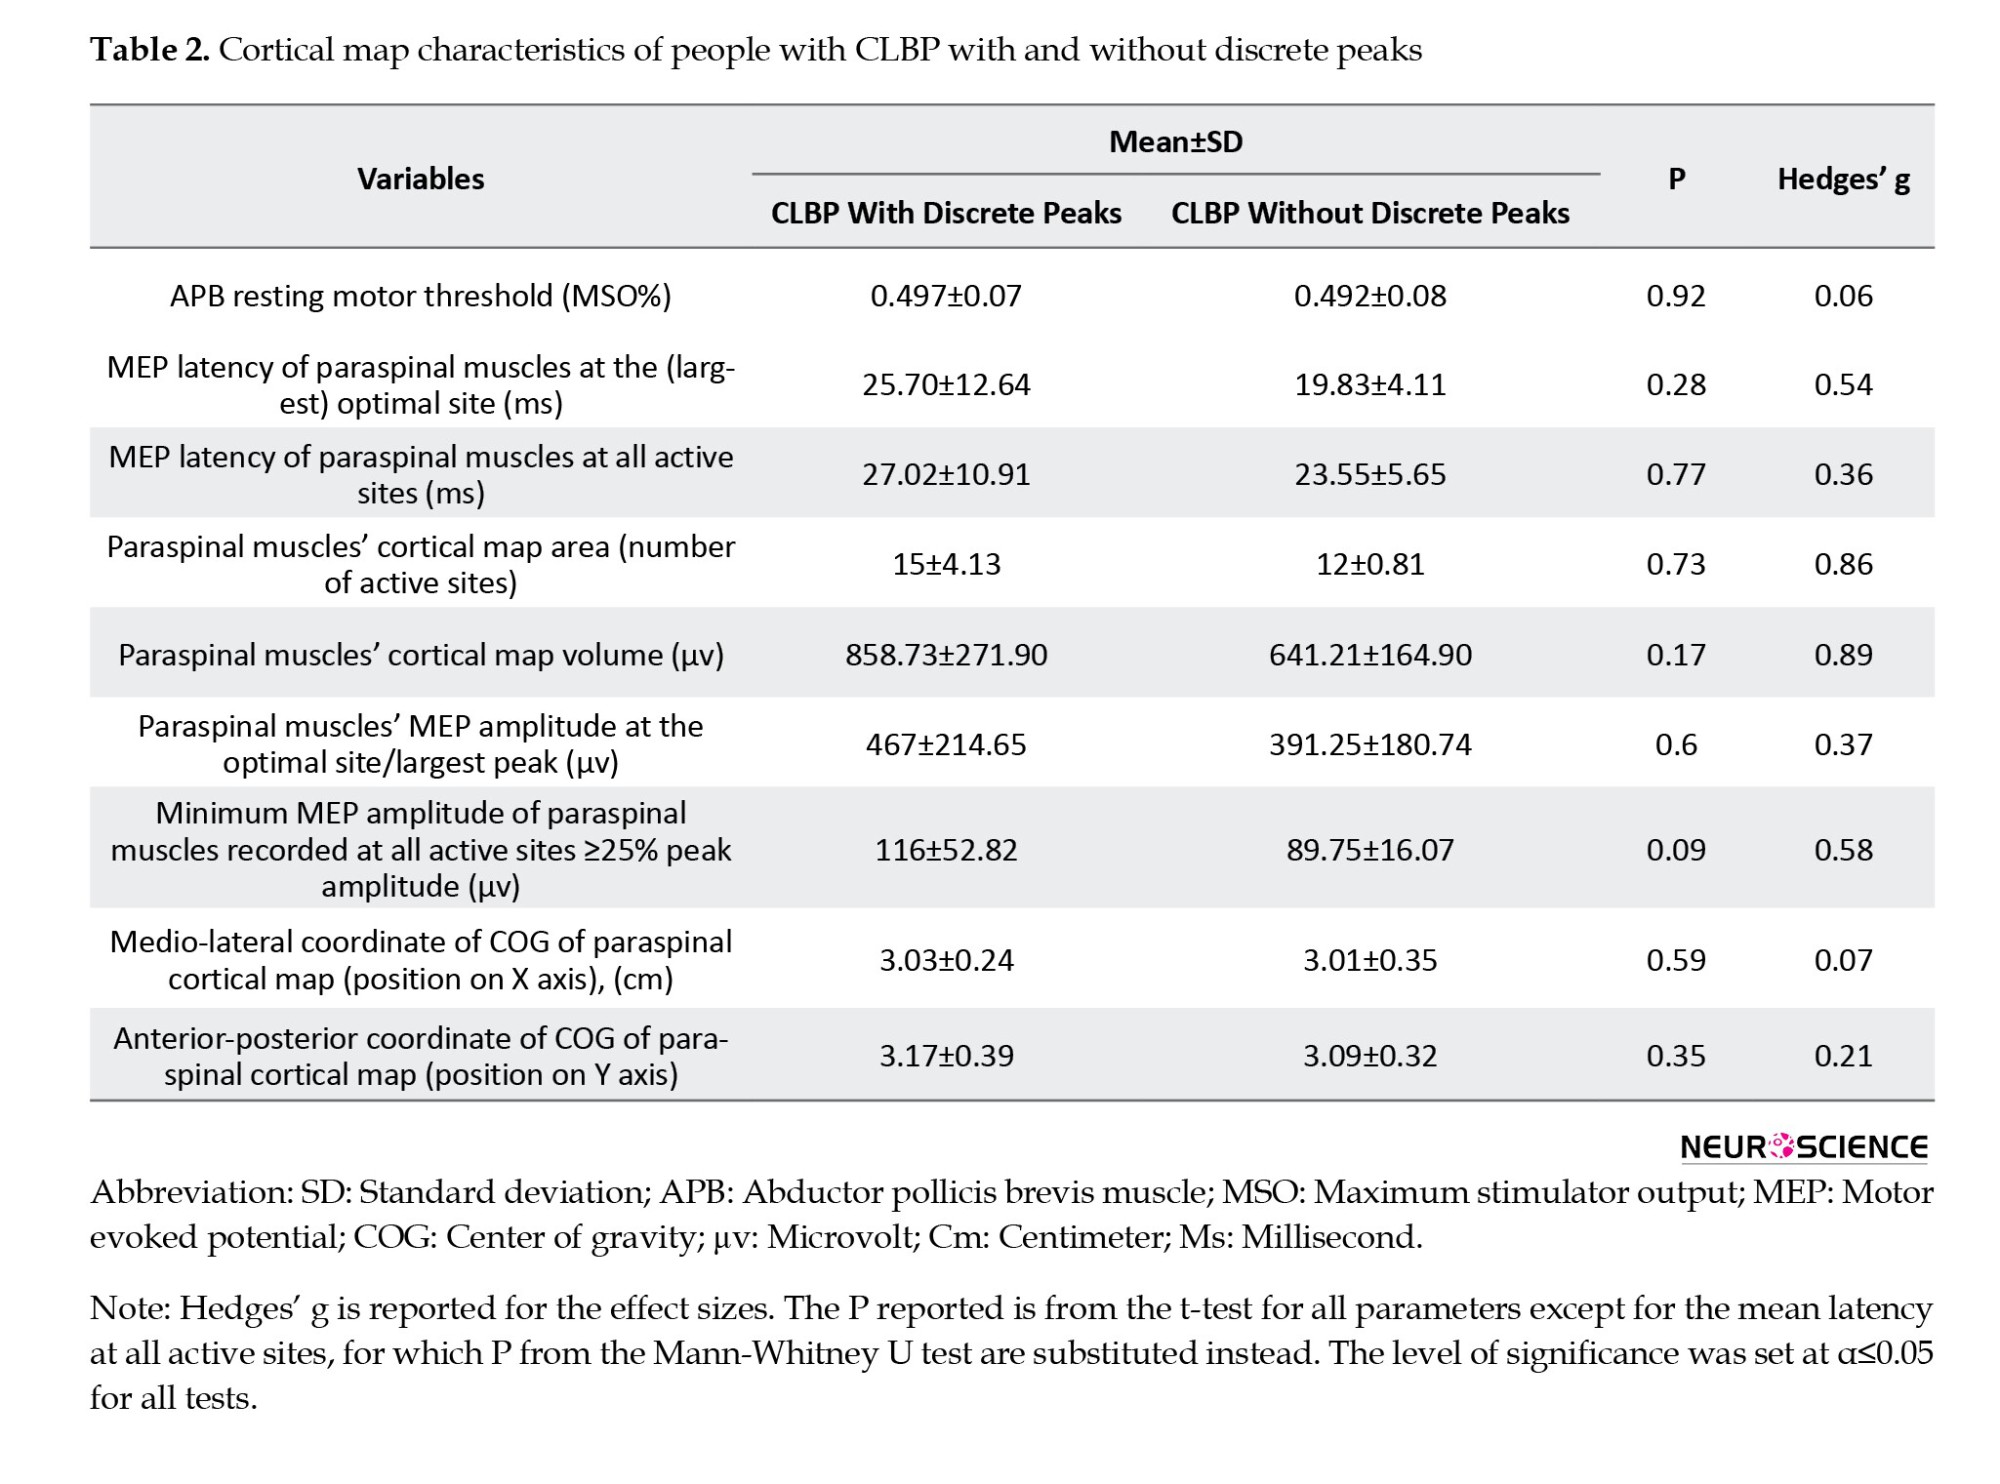
Body mass index (BMI) was also greater in CLBP participants with reduced cortical peaks and disability as measured by the oswestry disability index (ODI) was less in these group of participants (Table 1), but these differences were not statistically significant and the effect sizes were lower than medium (Hedges’g <0.5). Map volume, map area, peak MEP amplitudes, and the minimum MEP amplitudes recorded at active sites were relatively larger in people with CLBP with discrete peaks (Table 2), and pain duration from the onset of the first episode of LBP was longer in CLBP participants with reduced cortical peaks (Table 1), although this was not statistically significant (P>0.05) and the effect size was low to medium (Hedges’ g=0.37). BMI was also greater in CLBP participants with reduced cortical peaks, and disability as measured by the ODI was less in this group of participants (Table 1), but these differences were not statistically significant, and the effect sizes were lower than medium (Hedges’g <0.5). Map volume, map area, peak MEP amplitudes, and the minimum MEP amplitudes recorded at active sites were relatively larger in people with CLBP with discrete peaks (Table 2), and MEP latencies both at optimal sites and all active sites were relatively shorter in people with CLBP without discrete peaks (Table 2). The effect size was large for map volume (Hedges’g=0.89) and map area (Hedges’g=0.86), medium for MEP latency evoked from hot spots (Hedges’g=0.54), and minimum MEP evoked from all active sites (Hedges’g=0.37), but none of these differences were statistically significant (all P>0.05) (Table 2). The large and medium effect sizes demonstrated that there was a practically significant difference between the two subsets of people with CLBP with and without discrete peaks regarding the aforementioned mapping outcomes, such as volume and area, which did not reach the level of significance in statistical testing. This can be due to the comparison of the two groups of participants with CLBP with and without discrete peaks with unequal sample sizes, which could have lowered the statistical power of our statistical analysis (Grace-Martin, 2017). It is noteworthy to mention that this sampling occurred naturally as a result of TMS data analysis, and we had no control over that.
The only statistically significant difference observed between the two subgroups of participants with CLBP with and without discrete peaks, was the dominant sex in each group, as recognized by the chi-square test (P=0.043) so that the number of male participants in the CLBP subgroup without discrete peaks was 83% (five out of six) versus 25% (three out of 12) in the CLBP subgroup with discrete peaks. The effect size for gender difference between the two subgroups of CLBP with and without discrete peaks was very large (η2=0.306).
As confirmed by a one-sample t-test, latency at the optimal site (22.66±10.15 ms) was not significantly different from the normative data presented for healthy humans (19.3±4.78 ms) (O’Connell et al., 2007), but latency at all the other active sites of our subjects with CLBP (25.87±9.54 ms) significantly differed from data provided in this regard for normal subjects earlier (19.72±4.41 ms) (O’Connell et al., 2007) (P=0.013).
Comparing our mapping results with those from previous studies showed that the COG of the cortical map of paraspinal muscles in our CLBP subjects (X=3.02±0.31 cm, Y=3.12±0.49 cm) was significantly shifted anteriorly and laterally compared to values reported for the COG in healthy (X=2.5±0.6 cm, Y=-0.3±0.9 cm), acute LBP (X=2.3±0.6 cm, Y=-0.1±0.1 cm) (Chang et al., 2019), and CLBP patients (x=2.4±0.8 cm, Y=1.3±1.1 cm) (Elgueta-Cancino et al., 2018) constructed via spTMS (all P=0.000).
4. Discussion
TMS brain mapping has been underutilized for purposes other than presurgical monitoring of the motor and eloquent areas (Krieg, 2017), despite the fact that it offers a promising noninvasive approach for tracking cortical reorganization in pathologies, after training or surgery, during rehabilitation, or any other longitudinal studies (Novikov et al., 2018). This could be due to the lack of standardized methodologies (Novikov et al., 2018) that meet the variable and unique requirements of different conditions or muscle groups. Using a “one size fits all” method for mapping the cortical reorganization in different conditions and muscle groups may cause researchers and clinicians some difficulties. Addressing these issues may pave the way for further mapping studies to discover the pathophysiological basis of chronic conditions such as CLBP and track the cortical plastic changes after rehabilitation and training (Novikov et al., 2018). In this study, implementing a paired-pulse TMS paradigm with two consecutive TMS pulses with a test (first) TMS stimulus set at 100% MTh followed by subthreshold conditioning (second) TMS pulse set at 90% MTh with an interstimulus interval of 1 ms (Ziemann et al., 1998; Ortu et al., 2008), along with active engagement of paraspinal muscles both in an APA activity (Chiou et al., 2016) and MVC (Lagan et al., 2008; Jaberzadeh et al., 2013), made it possible to decrease the energy needed for stimulating/mapping the cortical representation of paraspinal muscles up to 50% MSO. The rMT for APB was used to formulate the paired-pulse paradigm, and the rMT for APB muscle was found to be≈50% MSO (49%±0.07% MSO) (Mean±SD [pooled]) in the participants with CLBP in this study (Table 2). The intensity of the first pulse was 100% (50% MSO), which equaled 50% MSO, and the intensity of the second pulse was 90% (50% MSO), which equaled≈45% MSO. Consequently, it was possible to stimulate the cortical maps of paraspinal muscles with such low TMS intensities as rMT for the hand muscles (APB), i.e. ≤50% MSO, using this paired-pulse TMS paradigm, while it was not possible to stimulate the motor cortical maps of the paraspinal muscles using single-pulse TMS, even at maximum stimulator output (100% MSO). As mentioned earlier, the rMT of the APB muscle was used because calculating resting or active motor threshold directly for paraspinal muscles was not possible using single-pulse TMS, and the APB rMT has been implemented as a general estimate of cortical excitability in studies mapping multiple muscles (Sollmann et al., 2017a).
This method appears to improve the feasibility of TMS mapping in people with CLBP who have reduced CSE (Strutton et al., 2005). It was reflected by no mapping failure in our study compared to previous studies that had reported mapping failure in at least some of their participants (O’Connell et al., 2007; Kuppuswamy et al., 2008; Tsao et al., 2011a; Tsao et al., 2011b), because the MTh to evoke MEPs in paraspinal muscles exceeded the maximum stimulator output in those particular subjects. The TMS intensity needed to stimulate the cortical maps of paraspinal muscles in our study using the paired-pulse paradigm was substantially below the maximum stimulator output limits. This reduced the potential risk of seizure and discomfort from face and neck muscle contractions associated with applying higher TMS pulse intensities (Sollmann et al., 2020), which were inevitable in previous studies using single-pulse TMS (Ferbert et al., 1992; O’Connell et al., 2007; Tsao et al., 2011a; Tsao et al., 2011b; Schabrun et al., 2017).
Analysis of the mapping parameters in the current study demonstrated reorganization of the M1 in terms of shift of the COG of the cortical maps of the paraspinal muscles in all the participants with CLBP; however, a reduced number of discrete peaks in these maps was only evident in a subset of the participants (33%).
COG is a robust measure of cortical representations (Tsao et al., 2008). The COG is closely related to the hotspots of the cortical maps. A “hot spot” is an area with higher excitability in the cortical maps that contains the highest density of cortico-motor neuronal projections to a given muscle (Wassermann et al., 1992). The cortical map of each muscle contains one or more “hot spots,” so-called “optimal stimulation sites,” which can evoke MEPs with the largest amplitudes in that muscle. The shift of the COG, which can also be regarded as the shift of the optimal stimulation site on the scalp to evoke MEPs in a given muscle, is an indicator of cortical reorganization (Uy et al., 2002). The shift of the COG has been documented in other muscle groups (deep abdominal muscles) in CLBP (Tsao et al., 2008) and other chronic pain conditions, such as phantom limb pain (Karl et al., 2001).
The location of the COG in the participants with CLBP in our study was shifted more anteriorly and laterally compared to data for healthy and acute LBP (Chang et al., 2019). Although O’Connell et al. did not calculate the exact coordinates of the COG for the cortical map of the paraspinal muscles, reported two optimal sites for evoking MEPs in paraspinal muscles in healthy people: One optimal site at 2 cm anterior and 2 cm lateral to the vertex point (0, 0), and another optimal site at 4 cm anterior and 2 cm lateral (O’Connell et al., 2007). As demonstrated in Figure 2 for two representative participants in our study, the peaks of the cortical maps of the paraspinal muscles both in CLBP subjects with and without discrete peaks were more anterior and lateral compared to both or one of the optimal sites reported for healthy back subjects by O’Connell et al., (2007). Anterior and lateral shifts of the COG were consistent with previous studies that have reported anterior shifts in the cortical map of paraspinal muscles using surface EMG electrodes (Schabrun et al., 2017; Elgueta-Cancino et al., 2018) in people with CLBP. But the magnitude of the shift in COG was larger in our study compared to previous ones, which may be justified by the use of a paired-pulse biphasic TMS paradigm, which is reported to elongate cortical maps in both anterior-posterior and mediolateral directions (Pitkänen et al., 2018). Although this may not be an important factor when the goal is simply to investigate the cortical reorganization in CLBP, it may have consequences when the precise location of COG is required in other serious conditions, such as in tumor resections (Pitkänen et al., 2018). In future studies, combining functional brain imaging (fMRI) and navigated brain stimulation with both single- and paired-pulse TMS mapping is likely to reduce the variability observed in the COG of the cortical maps (Tsao et al., 2008) and determine which one best resembles the reality of COG in cortical maps. Nevertheless, the best way to accomplish this goal would be to compare paired-pulse TMS mapping with direct cortical stimulation (Pitkänen et al., 2018).
A reduced number of discrete peaks was observed in a smaller subset of CLBP patients (33%), compared to a previous study that reported a reduced number of discrete cortical peaks in 67% of CLBP patients (Schabrun et al., 2017). This could be due to the fact that our participants’ pain was mild at the time of experience (less than 2 on the VAS), whereas, in a previous study (Schabrun et al., 2017), a lower number of discrete peaks was reported to be related to the severity of LBP at the time of exam. The interesting finding was that the pain duration was longer in CLBP patients with overlapped peaks. Thus, a reduced number of peaks may suggest a more chronic stage of CLBP. This is in line with a study that reported a positive relationship between the magnitude of cortical reorganization in the somatosensory cortex and pain chronicity in people with CLBP (Flor et al., 1997).
The mean latency at all active sites was significantly prolonged compared to the normative data presented in this regard (O’Connell et al., 2007), although it was not significant at the optimal site. Prolongation of latency has been implicated in cortico-cortical connections’ pathology in some conditions (Kallioniemi et al., 2015), but it cannot be assured that in our study, prolongation of the latency was due to the pathology because considerably lower amounts of stimulator intensity were needed to evoke MEPs via paired-pulse TMS (Pitkänen et al., 2018), i.e. 50% MSO pulse TMS to evoke MEPs (O’Connell et al., 2007). It has been demonstrated that stimulator intensity has an inverse relationship with MEP latency (Fuhr et al., 1991b). Also, maximum voluntary contraction of paraspinal muscles was utilized in the present study compared to previous studies (O’Connell et al., 2007; Tsao et al., 2011a; Tsao et al., 2011b) that utilized 20% of MVC and Kuppuswamy et al. have reported a prolongation of latency with increased muscle activity (Kuppuswamy et al., 2008).
MEP latency at the optimal site in this study did not differ significantly from normative data, which may be explained by the fact that MEPs that result from stimulation of the optimal site are mainly induced by direct waves (D-waves) (Kallioniemi et al., 2015), but are not affected by CSE, unlike those that result from the stimulation of the other active site and are induced by indirect waves (I-waves), which are enormously impacted by CSE. D-waves result from direct stimulation of the corticospinal tract via TMS, while I-waves indirectly stimulate the corticospinal tract through cortical interneurons when stimulated by TMS (Zewdie & Kirton, 2016). Discovering the exact etiology of the prolongation of MEP latencies warrants further mapping studies using a newly introduced method with matched healthy controls, which were not included in this study.
Map volume and area in the subgroup of CLBP without discrete peaks were smaller, and MEP amplitudes at all active sites were lower, reflecting the reduced CSE to paraspinal muscles in this subgroup of CLBP. Reduced CSE to paraspinal muscles was found earlier in CLBP patients compared to normal subjects (Strutton et al., 2005) and has been suggested as a causal factor for the transition from acute LBP to CLBP (Jenkins et al., 2021). Other chronic pain conditions, such as complex regional pain syndrome, have been linked to smaller cortical map volumes (Krause et al., 2006).
A novel finding of this study was that the number of discrete peaks in the cortical map of paraspinal muscles in participants with CLBP was related to the categorical demographic variable of gender, which has never been reported before. Gender differences have been reported in neuromuscular strategies, postural control, and response to treatment (Nelson-Wong et al., 2012). Thus, the number of discrete peaks can be related to different neuromuscular strategies that different genders adopt in response to LBP. The CNS adopts a new motor control strategy in response to LBP to minimize the adverse effects of pain and injury (Tsao et al., 2011b). The validity of this theory should be further confirmed in future studies comparing neuromuscular strategies adopted by different genders with TMS mapping outcomes for different genders.
No significant relationship was found between symptoms-related outcomes (e.g. pain duration or intensity and rated disability on the ODI) and mapping outcomes, which was similar to the results of some previous studies (Tsao et al., 2011b) and contradictory to the findings of others reporting a relationship between the cortical representation of paraspinal muscles and pain characteristics (Byl et al., 1997; Schabrun et al., 2017; Elgueta-Cancino et al., 2018). This could be because our sample size was relatively small compared to the studies that reported a relationship between these items since correlations usually manifest in larger samples.
5. Conclusion
The facilitation of CSE to paraspinal muscles by engaging them conjunctively both in a postural and a maximal voluntary activity, combined with the application of a more potent biphasic paired-pulse TMS paradigm that induces short-term intracortical facilitation, makes TMS mapping more practical in people with CLBP by substantially cutting the TMS energy needed to stimulate the cortical representation of paraspinal muscles in M1 and thus makes TMS mapping less hazardous in regards to the risk of possible seizures and more tolerable for the patients by decreasing the discomfort that results from the contraction of the facial muscles with the application of high intensities.
Limitations and future directions
First, in this study, we were not able to measure active MTh or resting MTh via single monophasic TMS pulses directly from paraspinal muscles. We reasoned that it might be due to the double baseline noise reported for the MagVenture TMS machine we used vs the Magstim device, which had been used in previous studies that obscured the inherently small MEPs from paraspinal muscles evoked by monophasic spTMS pulses. This shows that the technical differences that exist among the TMS stimulators from different brands may have a non-negligible impact on cortical mapping outcomes and stand in the way of obtaining comparable results from different labs, which has been emphasized as a prerequisite for summing and comparing data from different sources in an open science method. This highlights the importance of future comparative studies between TMS stimulators of different brands to determine the impact of technical differences, such as field strength, wavelength, baseline noise, cooling system, etc. on mapping outcomes and controlling for them as a covariate.
Second, we lacked a matched control group, which appears to be required in future studies to provide normative data on the outcomes of the paired-pulse TMS paradigms in mapping the cortical representation of paraspinal muscles in healthy back subjects in order to distinguish differences caused by different mapping methods from those caused by pure reorganization.
Ethical Considerations
Compliance with ethical guidelines
All procedures performed in this study were in accordance with the ethical standards of the institutional and/or national research committee and with the 1964 Helsinki Declaration and its later amendments or comparable ethical standards. The study was approved by the Ethics Committee of the Tarbiat Modares University of Medical Sciences (Code: IR.MODARES.REC.1397.146). Informed consent was obtained from all participants included in the study.
Funding
This paper was financially supported by the Vice-Chancellor for research at Tarbiat Modares University (Grant No.: MED41265).
Authors' contributions
Conceptualization: Solaleh Saraiepour, Sedighe Kahrizi and Mojdeh Ghabaee; Methodology: Solaleh Saraiepour, Mojdeh Ghabaee and Babak Bazrgari; Formal analysis: Solaleh Saraiepour, Sedighe Kahrizi and Babak Bazrgari; Data curation, investigation and subject recruitment: Solaleh Saraiepour; Supervision and project administration: Sedighe Kahrizi; Validation: Mojdeh Ghabaee; Writing: All authors.
Conflict of interest
The authors declared no conflict of interest.
Acknowledgments
The authors would like to express their gratitude to the Faculty of Medicine, Tarbiat Modares University for their support. The authors also are grateful for the sincere cooperation of the staff of National Brain Mapping Lab of Tehran University's Engineering College, both in operating TMS and assisting in data analysis.
References
Abbruzzese, G., & Trompetto, C. (2017). Motor evoked potential. In J. Stein (Ed.), Reference module in neuroscience and biobehavioral psychology (pp. 194-195), Amsterdam: Elsevier. [DOI:10.1016/B978-0-12-809324-5.00676-3]
Barker, A. T., Jalinous, R., & Freeston, I. L. (1985). Non-invasive magnetic stimulation of human motor cortex. Lancet, 1(8437), 1106–1107. [DOI:10.1016/S0140-6736(85)92413-4] [PMID]
Bulubas, L., Sabih, J., Wohlschlaeger, A., Sollmann, N., Hauck, T., & Ille, S., et al. (2016). Motor areas of the frontal cortex in patients with motor eloquent brain lesions. Journal of Neurosurgery, 125(6), 1431–1442.[DOI:10.3171/2015.11.JNS152103] [PMID]
Byl, N. N., Merzenich, M. M., Cheung, S., Bedenbaugh, P., Nagarajan, S. S., & Jenkins, W. M. (1997). A primate model for studying focal dystonia and repetitive strain injury: Effects on the primary somatosensory cortex. Physical Therapy, 77(3), 269–284. [DOI:10.1093/ptj/77.3.269] [PMID]
Capaday, C., Ethier, C., Van Vreeswijk, C., & Darling, W. G. (2013). On the functional organization and operational principles of the motor cortex. Frontiers in Neural Circuits, 7, 66. [DOI:10.3389/fncir.2013.00066] [PMID] [PMCID]
Chang, W. J., Buscemi, V., Liston, M. B., McAuley, J. H., Hodges, P. W., & Schabrun, S. M. (2019). Sensorimotor cortical activity in acute low back pain: A cross-sectional study. The Journal of Pain, 20(7), 819–829. [DOI:10.1016/j.jpain.2019.01.006] [PMID]
Chang, W. J., O'Connell, N. E., Beckenkamp, P. R., Alhassani, G., Liston, M. B., & Schabrun, S. M. (2018). Altered primary motor cortex structure, organization, and function in chronic pain: A systematic review and meta-analysis. The Journal of Pain, 19(4), 341–359. [DOI:10.1016/j.jpain.2017.10.007] [PMID]
Chiou, S. Y., Gottardi, S. E., Hodges, P. W., & Strutton, P. H. (2016). Corticospinal excitability of trunk muscles during different postural tasks. Plos One, 11(1), e0147650. [DOI:10.1371/journal.pone.0147650] [PMID] [PMCID]
Cram, J. R., & Steger, J. C. (1983). EMG scanning in the diagnosis of chronic pain. Biofeedback and Self-Regulation, 8(2), 229–241. [DOI:10.1007/BF00998853] [PMID]
Criswell, E. (2011). Cram’s introduction to surface electromyography. Sudbury: Jones & Bartlett Learning. [Link]
Elgueta-Cancino, E., Schabrun, S., & Hodges, P. (2018). Is the organization of the primary motor cortex in low back pain related to pain, movement, and/or sensation?. The Clinical Journal of Pain, 34(3), 207–216. [DOI:10.1097/AJP.0000000000000535] [PMID]
Farfan, H. (1973). Mechanical disorders of the low back, Philadelphia. Pennsylvania: Lea & Febiger. [Link]
Ferbert, A., Caramia, D., Priori, A., Bertolasi, L., & Rothwell, J. C. (1992). Cortical projection to erector spinae muscles in man as assessed by focal transcranial magnetic stimulation. Electroencephalography and Clinical Neurophysiology, 85(6), 382–387. [DOI:10.1016/0168-5597(92)90051-C] [PMID]
Flor, H., Braun, C., Elbert, T., & Birbaumer, N. (1997). Extensive reorganization of primary somatosensory cortex in chronic back pain patients. Neuroscience Letters, 224(1), 5–8.[DOI:10.1016/S0304-3940(97)13441-3] [PMID]
Fuhr, P., Agostino, R., & Hallett, M. (1991). Spinal motor neuron excitability during the silent period after cortical stimulation. Electroencephalography and Clinical Neurophysiology, 81(4), 257–262. [DOI:10.1016/0168-5597(91)90011-L] [PMID]
Fuhr, P., Cohen, L. G., Roth, B. J., & Hallett, M. (1991). Latency of motor evoked potentials to focal transcranial stimulation varies as a function of scalp positions stimulated. Electroencephalography and Clinical Neurophysiology, 81(2), 81–89. [DOI:10.1016/0168-5597(91)90001-E] [PMID]
Grace-Martin, K. (2017). When unequal sample sizes are and are not a problem in ANOVA. Retrieved from: [Link]
Groppa, S., Oliviero, A., Eisen, A., Quartarone, A., Cohen, L. G., & Mall, V., et al. (2012). A practical guide to diagnostic transcranial magnetic stimulation: Report of an IFCN committee. Clinical Neurophysiology, 123(5), 858–882. [DOI:10.1016/j.clinph.2012.01.010] [PMID] [PMCID]
Hess, C. W., Mills, K. R., & Murray, N. M. (1987). Responses in small hand muscles from magnetic stimulation of the human brain. The Journal of Physiology, 388, 397–419. [DOI:10.1113/jphysiol.1987.sp016621] [PMID] [PMCID]
Hodges, P. W., & Richardson, C. A. (1997). Feedforward contraction of transversus abdominis is not influenced by the direction of arm movement. Experimental Brain Research, 114(2), 362–370. [DOI:10.1007/PL00005644] [PMID]
Hodges, P. W., & Moseley, G. L. (2003). Pain and motor control of the lumbopelvic region: Effect and possible mechanisms. Journal of Electromyography and Kinesiology, 13(4), 361–370. [DOI:10.1016/S1050-6411(03)00042-7] [PMID]
Hodges, P. W., & Richardson, C. A. (1997). Relationship between limb movement speed and associated contraction of the trunk muscles. Ergonomics, 40(11), 1220–1230. [DOI:10.1080/001401397187469] [PMID]
Hoy, D., March, L., Brooks, P., Blyth, F., Woolf, A., & Bain, C., et al. (2014). The global burden of low back pain: Estimates from the Global Burden of Disease 2010 study. Annals of the Rheumatic Diseases, 73(6), 968–974. [DOI:10.1136/annrheumdis-2013-204428] [PMID]
Jaberzadeh, S., Zoghi, M., Morgan, P., & Storr, M. (2013). Corticospinal facilitation of erector spinae and rectus abdominis muscles during graded voluntary contractions is task specific: A pilot study on healthy individuals. Basic and Clinical Neuroscience, 4(3), 209–216. [PMID] [PMCID]
Janda, V. (1978). Muscles, central nervous motor regulation and back problems. In I. M. Korr (Ed.), The neurobiologic mechanisms in manipulative therapy (pp. 27-41). New York: Springer. [DOI:10.1007/978-1-4684-8902-6_2]
Jenkins, L. C., Chang, W. J., Buscemi, V.,Liston, M., Humburg, P., & Nicholas, M., et al (2021). Cortical function and sensorimotor plasticity are prognostic factors associated with future low back pain after an acute episode: The understanding persistent pain where it resides prospective cohort study. Pain, 164(1), 14-26. [DOI:10.1097/j.pain.0000000000002684]
Julkunen, P., Järnefelt, G., Savolainen, P., Laine, J., & Karhu, J. (2016). Facilitatory effect of paired-pulse stimulation by transcranial magnetic stimulation with biphasic wave-form. Medical Engineering & Physics, 38(8), 813–817. [DOI:10.1016/j.medengphy.2016.04.025] [PMID]
Kallioniemi, E., Pitkänen, M., Säisänen, L., & Julkunen, P. (2015). Onset latency of motor evoked potentials in motor cortical mapping with neuronavigated transcranial magnetic stimulation. The Open Neurology Journal, 9, 62–69. [DOI:10.2174/1874205X01509010062] [PMID]
Karl, A., Birbaumer, N., Lutzenberger, W., Cohen, L. G., & Flor, H. (2001). Reorganization of motor and somatosensory cortex in upper extremity amputees with phantom limb pain. The Journal of Neuroscience, 21(10), 3609–3618. [DOI:10.1523/JNEUROSCI.21-10-03609.2001] [PMID] [PMCID]
Katz J. N. (2006). Lumbar disc disorders and low-back pain: Socioeconomic factors and consequences. The Journal of bone and joint surgery. American Volume, 88(Suppl 2), 21–24. [DOI:10.2106/JBJS.E.01273] [PMID]
Kiers, L., Cros, D., Chiappa, K. H., & Fang, J. (1993). Variability of motor potentials evoked by transcranial magnetic stimulation. Electroencephalography and Clinical Neurophysiology, 89(6), 415–423. [DOI:10.1016/0168-5597(93)90115-6] [PMID]
Koes, B. W., van Tulder, M. W., & Thomas, S. (2006). Diagnosis and treatment of low back pain. BMJ, 332(7555), 1430–1434. [DOI:10.1136/bmj.332.7555.1430] [PMID] [PMCID]
Krause, P., Förderreuther, S., & Straube, A. (2006). TMS motor cortical brain mapping in patients with complex regional pain syndrome type I. Clinical Neurophysiology, 117(1), 169–176. [DOI:10.1016/j.clinph.2005.09.012] [PMID]
Krieg, S. M. (2017). Navigated transcranial magnetic stimulation in Neurosurgery. New York: Springer. [Link]
Krieg, S. M., Shiban, E., Buchmann, N., Gempt, J., Foerschler, A., & Meyer, B., et al. (2012). Utility of presurgical navigated transcranial magnetic brain stimulation for the resection of tumors in eloquent motor areas. Journal of Neurosurgery, 116(5), 994–1001. [DOI:10.3171/2011.12.JNS111524] [PMID]
Krieg, S. M., Shiban, E., Buchmann, N., Meyer, B., & Ringel, F. (2013). Presurgical navigated transcranial magnetic brain stimulation for recurrent gliomas in motor eloquent areas. Clinical Neurophysiology, 124(3), 522–527. [DOI:10.1016/j.clinph.2012.08.011] [PMID]
Krieg, S. M., Sollmann, N., Obermueller, T., Sabih, J., Bulubas, L., & Negwer, C., et al. (2015). Changing the clinical course of glioma patients by preoperative motor mapping with navigated transcranial magnetic brain stimulation. BMC Cancer, 15, 231. [DOI:10.1186/s12885-015-1258-1] [PMID] [PMCID]
Kuppuswamy, A., Catley, M., King, N. K., Strutton, P. H., Davey, N. J., & Ellaway, P. H. (2008). Cortical control of erector spinae muscles during arm abduction in humans. Gait & Posture, 27(3), 478–484. [DOI:10.1016/j.gaitpost.2007.06.001] [PMID]
Lagan, J., Lang, P., & Strutton, P. H. (2008). Measurement of voluntary activation of the back muscles using transcranial magnetic stimulation. Clinical Neurophysiology, 119(12), 2839–2845. [DOI:10.1016/j.clinph.2008.09.013] [PMID]
Massé-Alarie, H., Beaulieu, L. D., Preuss, R., & Schneider, C. (2016). Corticomotor control of lumbar multifidus muscles is impaired in chronic low back pain: Concurrent evidence from ultrasound imaging and double-pulse transcranial magnetic stimulation. Experimental Brain Research, 234(4), 1033–1045. [DOI:10.1007/s00221-015-4528-x] [PMID]
Massé-Alarie, H., Beaulieu, L. D., Preuss, R., & Schneider, C. (2017). Repetitive peripheral magnetic neurostimulation of multifidus muscles combined with motor training influences spine motor control and chronic low back pain. Clinical Neurophysiology, 128(3), 442–453. [DOI:10.1016/j.clinph.2016.12.020] [PMID]
Massé-Alarie, H., Neige, C., Bouyer, L. J., & Mercier, C. (2018). Modulation of corticospinal excitability of trunk muscles in preparation of rapid arm movement. Neuroscience, 369, 231–241. [DOI:10.1016/j.neuroscience.2017.11.024] [PMID]
Massé-Alarie, H., & Schneider, C. (2016). Revisiting the corticomotor plasticity in low back pain: Challenges and perspectives. Healthcare, 4(3), 67. [DOI:10.3390/healthcare4030067] [PMID] [PMCID]
Massé-Alarie, H., Bergin, M. J. G., Schneider, C., Schabrun, S., & Hodges, P. W. (2017). "Discrete peaks" of excitability and map overlap reveal task-specific organization of primary motor cortex for control of human forearm muscles. Human Brain Mapping, 38(12), 6118–6132. [DOI:10.1002/hbm.23816] [PMID] [PMCID]
May A. (2008). Chronic pain may change the structure of the brain. Pain, 137(1), 7–15. [DOI:10.1016/j.pain.2008.02.034] [PMID]
Merskey, H. Classification of chronic pain. Descriptions of chronic pain syndromes and definitions of pain terms. Prepared by the International Association for the Study of Pain, Subcommittee on Taxonomy. (1986). Pain, Supplement3, S1–S226. [PMID]
Murase, N., Duque, J., Mazzocchio, R., & Cohen, L. G. (2004). Influence of interhemispheric interactions on motor function in chronic stroke. Annals of Neurology, 55(3), 400–409. [DOI:10.1002/ana.10848] [PMID]
Nelson-Wong, E., Alex, B., Csepe, D., Lancaster, D., & Callaghan, J. P. (2012). Altered muscle recruitment during extension from trunk flexion in low back pain developers. Clinical Biomechanics, 27(10), 994–998. [DOI:10.1016/j.clinbiomech.2012.07.007] [PMID]
Novey, W. (2019). Are all rTMS machines equal? New research suggests there may be clinically significant differences. Mental Illness, 11(1), 8125. [PMID] [PMCID]
Novikov, P. A., Nazarova, M. A., & Nikulin, V. V. (2018). TMSmap - software for quantitative analysis of TMS mapping results. Frontiers in Human Neuroscience, 12, 239. [DOI:10.3389/fnhum.2018.00239] [PMID] [PMCID]
O'Connell, N. E., Maskill, D. W., Cossar, J., & Nowicky, A. V. (2007). Mapping the cortical representation of the lumbar paravertebral muscles. Clinical Neurophysiology, 118(11), 2451–2455. [DOI:10.1016/j.clinph.2007.08.006] [PMID]
Oh, M. K., Kim, H. R., Kim, W. S., & Shin, H. I. (2017). Relationship between motor evoked potential response and the severity of paralysis in spinal cord injury patients. Annals of Rehabilitation Medicine, 41(2), 211–217. [DOI:10.5535/arm.2017.41.2.211] [PMID] [PMCID]
Ortu, E., Deriu, F., Suppa, A., Tolu, E., & Rothwell, J. C. (2008). Effects of volitional contraction on intracortical inhibition and facilitation in the human motor cortex. The Journal of Physiology, 586(21), 5147–5159. [DOI:10.1113/jphysiol.2008.158956] [PMID] [PMCID]
Panjabi M. M. (1992). The stabilizing system of the spine. Part I. Function, dysfunction, adaptation, and enhancement. Journal of Spinal Disorders, 5(4), 383–397. [DOI:10.1097/00002517-199212000-00001] [PMID]
Penfield, W., & Boldrey, E. (1937). Somatic motor and sensory representation in the cerebral cortex of man as studied by electrical stimulation. Brain, 60(4), 389-443. [DOI:10.1093/brain/60.4.389]
Petersen, T. H., Rosenberg, K., Petersen, N. C., & Nielsen, J. B. (2009). Cortical involvement in anticipatory postural reactions in man. Experimental Brain Research, 193(2), 161–171.[DOI:10.1007/s00221-008-1603-6] [PMID]
Pitkänen, M., Kallioniemi, E., Järnefelt, G., Karhu, J., & Julkunen, P. (2018). Efficient mapping of the motor cortex with navigated biphasic paired-pulse transcranial magnetic stimulation. Brain Topography, 31(6), 963–971. [DOI:10.1007/s10548-018-0660-9] [PMID]
Rossi, S., Hallett, M., Rossini, P. M., Pascual-Leone, A., & Safety of TMS Consensus Group (2009). Safety, ethical considerations, and application guidelines for the use of transcranial magnetic stimulation in clinical practice and research. Clinical Neurophysiology, 120(12), 2008–2039. [DOI:10.1016/j.clinph.2009.08.016] [PMID] [PMCID]
Rossini, P. M., Burke, D., Chen, R., Cohen, L. G., Daskalakis, Z., & Di Iorio, R., et al. (2015). Non-invasive electrical and magnetic stimulation of the brain, spinal cord, roots and peripheral nerves: Basic principles and procedures for routine clinical and research application. An updated report from an I.F.C.N. Committee. Clinical Neurophysiology, 126(6), 1071–1107. [DOI:10.1016/j.clinph.2015.02.001] [PMID] [PMCID]
Savoy R. L. (2001). History and future directions of human brain mapping and functional neuroimaging. Acta Psychologica, 107(1-3), 9–42. [DOI:10.1016/S0001-6918(01)00018-X] [PMID]
Schabrun, S. M., Elgueta-Cancino, E. L., & Hodges, P. W. (2017). Smudging of the motor cortex is related to the severity of low back pain. Spine, 42(15), 1172–1178. [DOI:10.1097/BRS.0000000000000938] [PMID]
Smith, V., D. Maslovat and A. N. Carlsen (2019). StartReact effects are dependent on engagement of startle reflex circuits: Support for a subcortically mediated initiation pathway. Journal of Neurophysiology 122(6), 2541-2547. [DOI:10.1152/jn.00505.2019] [PMID]
Sollmann, N., Bulubas, L., Tanigawa, N., Zimmer, C., Meyer, B., & Krieg, S. M. (2017). The variability of motor evoked potential latencies in neurosurgical motor mapping by preoperative navigated transcranial magnetic stimulation. BMC Neuroscience, 18(1), 5. [DOI:10.1186/s12868-016-0321-4] [PMID] [PMCID]
Sollmann, N., Tanigawa, N., Bulubas, L., Sabih, J., Zimmer, C., & Ringel, F., et al. (2017). Clinical factors underlying the inter-individual variability of the resting motor threshold in navigated transcranial magnetic stimulation motor mapping. Brain Topography, 30(1), 98–121. [DOI:10.1007/s10548-016-0536-9] [PMID]
Sollmann, N., Zhang, H., Kelm, A., Schröder, A., Meyer, B., & Pitkänen, M., et al. (2020). Paired-pulse navigated TMS is more effective than single-pulse navigated TMS for mapping upper extremity muscles in brain tumor patients. Clinical Neurophysiology, 131(12), 2887–2898. [DOI:10.1016/j.clinph.2020.09.025] [PMID]
Strutton, P. H., Theodorou, S., Catley, M., McGregor, A. H., & Davey, N. J. (2005). Corticospinal excitability in patients with chronic low back pain. Journal of Spinal Disorders & Techniques, 18(5), 420–424. [DOI:10.1097/01.bsd.0000169063.84628.fe] [PMID]
MagVenture. (2010). Motor threshold: Introduction to MEP monitor guideline for performing motor threshold with MagPro and MEP monitor. Denmark: MagVenture. [Link]
Tsao, H., Danneels, L., & Hodges, P. W. (2011). Individual fascicles of the paraspinal muscles are activated by discrete cortical networks in humans. Clinical Neurophysiology, 122(8), 1580–1587. [DOI:10.1016/j.clinph.2011.01.048] [PMID]
Tsao, H., Danneels, L. A., & Hodges, P. W. (2011). ISSLS prize winner: Smudging the motor brain in young adults with recurrent low back pain. Spine, 36(21), 1721–1727. [DOI:10.1097/BRS.0b013e31821c4267] [PMID]
Tsao, H., Galea, M. P., & Hodges, P. W. (2008). Reorganization of the motor cortex is associated with postural control deficits in recurrent low back pain. Brain, 131(Pt 8), 2161–2171. [DOI:10.1093/brain/awn154] [PMID]
Turton, A., & Lemon, R. N. (1999). The contribution of fast corticospinal input to the voluntary activation of proximal muscles in normal subjects and in stroke patients. Experimental Brain Research, 129(4), 559–572. [DOI:10.1007/s002210050926] [PMID]
Uy, J., Ridding, M. C., & Miles, T. S. (2002). Stability of maps of human motor cortex made with transcranial magnetic stimulation. Brain Topography, 14(4), 293–297.[DOI:10.1023/A:1015752711146] [PMID]
van de Ruit, M., & Grey, M. J. (2016). The TMS map scales with increased stimulation intensity and muscle activation. Brain Topography, 29(1), 56–66. [DOI:10.1007/s10548-015-0447-1] [PMID] [PMCID]
van Dieën, J. H., Reeves, N. P., Kawchuk, G., van Dillen, L. R., & Hodges, P. W. (2019). Motor control changes in low back pain: Divergence in presentations and mechanisms. The Journal of Orthopaedic and Sports Physical Therapy, 49(6), 370–379. [DOI:10.2519/jospt.2019.7917] [PMID] [PMCID]
Van Doren, J., Langguth, B., & Schecklmann, M. (2015). TMS-related potentials and artifacts in combined TMS-EEG measurements: Comparison of three different TMS devices. Neurophysiologie Clinique, 45(2), 159–166. [DOI:10.1016/j.neucli.2015.02.002] [PMID]
van Tulder, M., Becker, A., Bekkering, T., Breen, A., del Real, M. T., & Hutchinson, A., et al. (2006). Chapter 3. European guidelines for the management of acute nonspecific low back pain in primary care. European Spine Journal, 15(Suppl 2), S169–S191. [DOI:10.1007/s00586-006-1071-2] [PMID] [PMCID]
Vogt, L., Pfeifer, K., & Banzer, W. (2003). Neuromuscular control of walking with chronic low-back pain. Manual Therapy, 8(1), 21–28. [DOI:10.1054/math.2002.0476] [PMID]
Von Korff, M., Dworkin, S. F., & Le Resche, L. (1990). Graded chronic pain status: An epidemiologic evaluation. Pain, 40(3), 279–291. [DOI:10.1016/0304-3959(90)91125-3] [PMID]
GBD 2015 Disease and Injury Incidence and Prevalence Collaborators (2016). Global, regional, and national incidence, prevalence, and years lived with disability for 310 diseases and injuries, 1990-2015: A systematic analysis for the Global Burden of Disease Study 2015. Lancet, 388(10053), 1545–1602. [DOI:10.1016/S0140-6736(16)31678-6] [PMID] [PMCID]
Wand, B. M., & O'Connell, N. E. (2008). Chronic non-specific low back pain - sub-groups or a single mechanism?. BMC Musculoskeletal Disorders, 9, 11. [DOI:10.1186/1471-2474-9-11] [PMID] [PMCID]
Wand, B. M., Parkitny, L., O'Connell, N. E., Luomajoki, H., McAuley, J. H., & Thacker, M., et al. (2011). Cortical changes in chronic low back pain: Current state of the art and implications for clinical practice. Manual Therapy, 16(1), 15–20. [DOI:10.1016/j.math.2010.06.008] [PMID]
Wassermann E. M. (1998). Risk and safety of repetitive transcranial magnetic stimulation: Report and suggested guidelines from the international workshop on the safety of repetitive transcranial magnetic stimulation, June 5-7, 1996. Electroencephalography and Clinical Neurophysiology, 108(1), 1–16. [DOI:10.1016/0168-5597(92)90094-R] [PMID]
Zewdie, E. & Kirton, A. (2016). TMS basics: Single and paired pulse neurophysiology. In A. Kirton., & D. L, Gilbert (Eds.), Pediatric brain stimulation (pp. 3-22). Amsterdam: Elsevier. [DOI:10.1016/B978-0-12-802001-2.00001-1]
Ziemann, U., Tergau, F., Wassermann, E. M., Wischer, S., Hildebrandt J. & Paulus W. (1998). Demonstration of facilitatory I wave interaction in the human motor cortex by paired transcranial magnetic stimulation. The Journal of Physiology 511(1), 181-190. [DOI:10.1111/j.1469-7793.1998.181bi.x] [PMID]
Chronic lower back pain (CLBP) is the leading cause of disability worldwide (GBD 2015 disease and injury incidence and prevalence collaborators, 2016), with annual health costs estimated to be over 100 billion dollars (Katz, 2006). Yet uncertainty about the etiology of low back pain (LBP) chronification hampers its proper resolution (Wand & O’Connell, 2008). According to the International Association for the Study of Pain (IASP), CLBP is defined when the LBP lasts beyond normal tissue healing time (Merske, 1986), i.e. more than 12 weeks (Hoy et al., 2014) and previous treatments have been incapable of its management (Wand et al., 2011). More than 500 theories have been proposed to explain the process of transition from the acute to the chronic stage in CLBP. In one of these theories, the perpetuation of motor control deficits of back muscles after the acute phase of LBP has been blamed for the persistence of LBP (Tsao et al., 2008). The central nervous system (CNS) is in charge of providing the motor control of the back muscles and maintaining the stability of the spine (Hodges & Moseley, 2003) in terms of the order of the recruitment of back muscles and the rate of force production in them (Vogt et al., 2003).
It has been suggested that at least some sort of LBP may happen as a result of shortcomings in the CNS to provide suitable motor control of back muscles due to pain syndromes (Janda, 1978). It is believed that improper control of back muscles can lead to repeated microtrauma, joint injury, and ongoing stimulation of the nociceptors in the back (Farfan, 1973; Panjabi, 1992). There is some debate about the origin of these control deficiencies in the CNS. Although changes in excitability have been documented at different levels of neuroaxis from motor neurons (Cram & Steger, 1983) to motor cortex (Strutton et al., 2005) in the presence of experimental LBP, inter-individual variability observed in motor control deficits among people with CLBP (Van Dieën et al., 2019) suggests the involvement of supraspinal mechanisms in areas involved in motor planning in the development of such deficits (Hodges & Moseley, 2003). As the role of the primary motor cortex (M1) has been established in the execution and formulation of movements, dysfunction of M1 has also been suggested as a possible culprit for motor control deficits observed among people with CLBP (Chang et al., 2018). For decades, knowledge about the CNS was provided only by autopsy material (May, 2008). Nowadays, the functional organization of the M1 can be studied using transcranial magnetic stimulation (TMS), noninvasively and painlessly in vivo (Barker et al., 1985).
Preliminary studies have demonstrated some alterations in the representational fields of back muscles in M1 in people with CLBP, which include a reduced number of discrete peaks and smudging of the cortical representation of back muscles in people with CLBP (Tsao et al., 2011b), which has been related to the severity of back pain (Schabrun et al., 2017). It is noteworthy to mention that cortical maps of back muscles are separated and contain at least two peaks in normal healthy volunteers (O’Connell et al., 2007; Tsao et al., 2011a). Although researchers argue that these alterations in representational fields of back muscles in M1 in people with CLBP may explain the loss of differential function in superficial and deep layers of back muscles and their en masse recruitment (Tsao et al., 2011a), a definite interpretation of these findings warrants further replication of TMS mapping studies targeting representation of back muscles to explore their behavioral relevance (Massé‐Alarie et al., 2017b). However, mapping the cortical representation of trunk muscles, especially back muscles, via TMS is challenging (O’Connell et al., 2007).
Depending on the frequency of delivery, TMS can either activate or disrupt the activity of cortical neurons temporarily (Savoy, 2001). Any response to TMS may be used to map the functional organization of the brain (Novikov et al., 2018). When TMS is applied to M1 with ample intensity, cortical motor neurons are depolarized, and when the action potential resulting from this depolarization reaches spinal motor neurons, a motor response is generated in peripheral muscles known as motor evoked potential (MEP), which can be recorded by electromyography (EMG) (Zewdie & Kirton, 2016). The MEP amplitudes are then used to construct the cortical maps of different skeletal muscles by outlining the cortical territory in M1 where its stimulation via TMS results in MEP production in the corresponding muscle (Rossini et al., 2015), considering the point where its stimulation in M1 evokes the largest and most consistent MEP amplitudes as the peak or hotspot of the cortical map (Zewdie & Kirton, 2016).
However, MEPs from paraspinal muscles are more polyphasic with fewer evident positive or negative peaks (Groppa et al., 2012), which can be easily missed in the background noise of EMG (Fuhr et al., 1991b) compared to MEPs from distal limb muscles. Figure 1 depicts this difference. On the other hand, the area devoted to controlling back muscles in M1 or, in other words, their cortical representation in M1 is much smaller compared to hand muscles (Penfield & Boldrey, 1937), receive fewer corticospinal projections (Kiers et al., 1993) and cortical points, which can evoke a MEP in paraspinal muscles are situated closer together in M1 (Capaday et al., 2013). This item raises the motor threshold of the cortical representation of back muscles to TMS, i.e. the TMS intensity needed to stimulate the cortical maps of back muscles to evoke measurable MEPs (≥50 µv) (Julkunen et al., 2016), which is much higher compared to distal hand muscles (Kiers et al., 1993).
To overcome these challenges, previous studies have tried to activate back muscles at 20% of maximal voluntary contraction (MVC) and used maximum stimulator output (100% MSO) (Ferbert et al., 1992; O’Connell et al., 2007; Kuppuswamy et al., 2008; Tsao et al., 2011a; Tsao et al., 2011b). It has been shown that both increasing the TMS stimulator intensity and activating the muscles increase the corticospinal excitability (CSE) toward the muscle that is going to be mapped and results in recordings larger and more visible from that muscle (Van De Ruit & Grey, 2016). Despite taking these measures, still, mapping failure in some of the participants has been reported in the abovementioned studies because the MTh exceeds the MSO in a subgroup of participants. An obvious flaw in these studies appears to be the use of 20% MVC for mapping the cortical representation of back muscles, which is based on studies demonstrating that CSE to upper (Hess et al., 1987) and lower limb (Turton & Lemon, 1999) muscles peak at 20% MVC and then plateaus.
Meanwhile, it has been shown that CSE to back muscles has a more linear relationship with MVC% and reaches its maximum at 90-100% of MVC (Lagan et al., 2008; Jaberzadeh et al., 2013). Furthermore, increases in MVC have been shown to significantly decrease MEP amplitude variability (Kiers et al., 1993) and increase MEP size in paraspinal muscles (Jaberzadeh et al., 2013). Moreover, the results of a recent counterintuitive study have shown that CSE to paraspinal muscles is task-specific and the largest MEPs can be recorded from these muscles while they are engaged in an anticipatory postural adjustment activity (APA) (Chiou et al., 2016). These factors, while they can be a game changer for obtaining measurable MEPs from paraspinal muscles suitable for cortical mapping, have not been taken into consideration in designing mapping protocols for back muscles.
Finally, single monophasic TMS pulses (spTMS), which are commonly used for brain mapping due to their higher recovery rate (Pitkänen et al., 2018), have been shown to be impractical and not potent enough to stimulate M1 in cases with severely diminished CSE (Sollmann et al., 2020). This can be implied for people with CLBP as lowered CSE has also been documented in this group of patients (Strutton et al., 2005). Biphasic TMS pulses, which are stronger and can induce similar effects but with less intensity have become available recently (Pitkänen et al., 2018). In a recent study, a combination of biphasic TMS pulses with paired-pulse (ppTMS) paradigms that induce short-term intracortical facilitation (SICF) (Ortu et al., 2008) was successfully employed to map the cortical representation of upper extremity muscles in people with severely diminished CSE who harbored brain tumors (Sollmann et al., 2020). Despite the potential advantage of biphasic ppTMS for mapping thecortical representation of back muscles in people with CLBP, this method has not been put into trial for people with CLBP.
In this study, in a pilot attempt to map the cortical representation of back muscles in a cohort of people with CLBP, MEPs were not recognizable from the background noise in any of our participants. We assumed that it might be due to the double baseline noise reported for the TMS stimulator we used compared to the stimulator used by previous studies (MagVenture vs Magstim) (Van Doren et al., 2015), which had possibly obscured the inherently small MEPs from paraspinal muscles (Fuhr et al., 1991a). We hypothesized that by tailoring a mapping protocol specifically designed to meet the unique requirements of the cortical representation of the back muscles, we would be able to facilitate mapping the cortical representation of the paraspinal muscles.
2. Materials and Methods
Subjects
This study included eighteen patients (eight males and ten females) aged 36.53±6.52 years with unilateral non-specific CLBP who had experienced LBP for more than three months. Previous studies had suggested that unilateral pain sensations may play a role in the reorganization of the motor cortical representation of the affected side through transcallosal connections of M1 areas between two hemispheres (Murase et al., 2004; Krause et al., 2006). Thus, the inclusion criteria were having unilateral nonspecific CLBP defined as any pain, muscle tension, or stiffness below the costal margins and above the inferior gluteal folds with or without leg pain (sciatica) (Koes et al., 2006) lasting longer than three months, including periods of exacerbation and remission of pain, with pain more intense on one side and severe enough to interfere with daily activities (Von Korff et al., 1990). Patients went through a medical history taking and brief physical examination (Van Tulder et al., 2006) and were asked to rate their current pain, mean pain over the previous week, and the maximum pain they felt at the onset of their first episode of LBP on a 100 mm visual analog scale (VAS) between 0 and 10, with zero indicating no pain at all and ten indicating the maximum perceivable pain. Participants were only brain-mapped if they were in remission and their current pain was less than two on the VAS on the trial day, allowing them to withstand the cortical mapping process without exacerbating their symptoms.
The exclusion criteria were non-mechanical LBP or specific LBP, which symptoms were caused by specific, recognizable known pathophysiological mechanisms, such as osteoporosis, tumor, infection, malignancy, fracture, rheumatoid arthritis, structural deformities, cauda equina syndrome, or radicular neuropathies (Koes et al., 2006), back surgery, recent lumbar infiltration, any major circulatory, orthopedic or neurological disorder, pregnancy, and any contraindication to TMS, such as a family history of epilepsy, metallic implants in the head or jaw, a history of brain concussion, surgery, ear tinnitus, cardiac implants, or taking any medication that increased the risk of seizure. TMS contraindications are covered in greater detail elsewhere (Rossi et al., 2009).
TMS mapping
The MagVenture Company’s butterfly coil coolb-65 and MagPro X100 TMS machines were used to stimulate M1 in the contralateral hemisphere to the most painful side of the lower back pain in one-centimeter steps from 2 cm posterior to the vertex (CZ) to 5 cm anterior and from vertex to 5 cm lateral on a 5×7 cm plastic grid that was assembled on a snug swimming cap worn by participants with reference to CZ (0, 0).
The coil handle was positioned along the sagittal plane to create an electrical current in the brain in the postero-anterior (PA) direction (Tsao et al., 2011b). For mapping, a paired-pulse paradigm for SICF was adopted, with a test stimulus (TS) at 100% of resting motor threshold (rMT) preceding a conditioning stimulus (CS) at 90% of rMT and an inter-stimulus interval (ISI) of 1 ms (Ziemann et al., 1998; Ortu et al., 2008; Massé-Alarie et al., 2016). The rMT was defined as the lowest TMS stimulator output or intensity that could evoke MEPs with ≥50µv in five out of ten consecutive TMS trials (Massé-Alarie & Schneider, 2016). Because calculating the rMT and/or active motor threshold for paravertebral muscles using single monophasic or biphasic TMS pulses via butterfly coli cool b65 from MagVenture was impossible, the rMT for abductor pollicis brevis (APB) muscle was calculated, following the manufacturer’s instructions (Tonika Electronic A/S 2010), to be used in the paired-pulse paradigm for SICF of cortical representation of paraspinal muscles. Choosing the rMT of APB was based on studies using APB rMT as a general reference for CSE for mapping multiple muscles (Krieg et al., 2012; Krieg et al., 2013; Krieg et al., 2015; Bulubas et al., 2016; Sollmann et al., 2017a; Sollmann et al., 2017b). To map the cortical representation of paraspinal muscles, three paired-pulse were administered to each cross-section of the grid with a delay of 10 seconds, as shorter time lags were associated with a lower chance of evoking MEPs demonstrated in the pilot trial.
Participants were instructed to sit on the edge of an armless chair with their feet flat on the ground and arch their back with maximal voluntary contraction i.e. contracting the back muscles by keeping them in lordosis with as much effort as possible with minimal pain or discomfort, and simultaneously elevating the contralateral arm to the painful side of the back to 90° of shoulder flexion as quickly as possible upon hearing the “go” command from the TMS operator.
The operator delivered the TMS pulses at pre-marked scalp sites coincident with commanding “go” at time zero. It has been shown that in the time window of 0–120 ms after the “go” command, CSE to paraspinal muscles increases, and larger MEPs can be recorded during this period (Petersen et al., 2009). This is due to the release of cortical inhibition before trunk muscle activation onset, which occurs with a time lag of 150–180 ms after the “go” command (Hodges & Richardson, 1997; Massé-Alarie et al., 2018).
Under the supervision of the physiotherapist, the correct form of paravertebral muscles’ contraction was rehearsed by the participants several times before the initiation of the mapping procedure with the help of verbal cues, palpation, and imagery techniques (Massé-Alarie et al., 2017a).
EMG
MEPs were recorded from paravertebral muscles ipsilateral to the most painful side of the back, using the MEP monitor of the MagVenture Magprox100 TMS machine, which has a built-in one-channel EMG device mounted on the back of this device, via disposable self-adhesive Ag/Agcl FDA registered surface electrodes from INTCO Company. The MEP monitor of MagVenture manifests only post-TMS stimulus events and not real-time EMG. EMG data were amplified 5000 times, band pass filtered between 20 and 1000 Hz, sampled at 100 kHz, and saved to a USB drive for later analysis.
With the ground electrode on the sacrum, MEPs from the painful side of the back were recorded using two active electrodes laid parallel to the spine 2 cm lateral to the spinous process of the third lumbar vertebra (L3) on the bulk of paravertebral muscles with an inter-electrode distance of 2 cm (Criswell, 2010).
TMS data analysis
The most pronounced MEP out of the three was chosen. MEPs were not averaged due to the enormous variability (Kiers et al., 1993) seen between trials. MEP latencies, expressed in milliseconds, indicated the time it took for TMS-induced descending impulses to reach the paraspinal muscles (Abbruzzese & Trompetto, 2017) and were defined as the moment of initial upward or downward deflection of the MEP response from the baseline observed in EMG (Oh et al., 2017). MEP amplitudes were calculated as the voltage difference between the most negative and most positive peak of the MEP signal in the MEP time window (12-50 msec) (Ferbert et al., 1992; O’Connell et al., 2007; Smith et al., 2019; Jenkins et al., 2021). MEP amplitudes were normalized with respect to the peak MEP amplitude recorded and rescaled between 0 and 100 (Tsao et al., 2011a) by MATLAB software, version 2020B. The MEP with the largest amplitude was attained by delivering TMS to the hotspot, which is a cortical point that evokes the largest MEP in a given muscle (Uy et al., 2002). The hotspot was found by moving the stimulating coil to different positions on the pre-marked grid on the scalp to find the point with the lowest threshold that evoked the largest MEP (Wassermann et al., 1992). MEP amplitudes that were <25% of the peak amplitude were discarded, as it has been demonstrated that discarding MEP values <25% of the peak MEP amplitude does not affect TMS maps significantly (Tsao et al., 2011b). Normalized MEP’s amplitudes were superimposed on the respective scalp sites for map construction (Tsao et al., 2011a; Tsao et al., 2011b). For the constructed maps, the following items were calculated: Map area (number of scalp active sites), a scalp point was considered active if it evoked MEPs were >25% of the peak MEP (Schabrun et al., 2017), map volume (sum of MEP amplitudes recorded from all active scalp sites) (Wassermann et al., 1992), coordinates of the center of gravity (CoG) or amplitude weighted center of the map, which was defined as the spatial mean of the motor cortical maps (Uy et al., 2002) weighted by the amplitude of the MEPs evoked from different scalp sites and calculated using the Equation 1:
(Vi is normalized MEP amplitude at each point with coordinates xi as medio-lateral direction and yi as anteroposterior direction) (Tsao et al., 2011b), and the number of discrete peaks based on the criterion suggested earlier for identification of separate peaks (Schabrun et al., 2017). Maps constructed for two representative subjects with and without discrete peaks are depicted in Figure 2.
Statistical analysis
SPSS software, version 26 was used for statistical analysis. Continuous data are represented as Mean±SD, whereas categorical data are represented as percentages. Both mean and maximum pain intensity and disability were regarded as continuous data. The Shapiro-Wilk test was used to assess the normality of our data. When data were not normally distributed, the independent t-test was used to compare mapping outcomes between the two recognized subgroups of CLBP. A Mann-Whitney U test was used as a surrogate for the t-test. Hedges’ g was used to calculate the effect size for scale data, and odd ratios (Eta squared) were used to calculate the effect size for categorical data. The Pearson correlation coefficient was used to assess the possible relationships between the mapping outcomes and the continuous demographic characteristics of the participants. To compare categorical data, the chi-squared test was used for a similar purpose. The level of significance was set at α≤0.05. One-sample t-test was used to compare the data with the normative data presented by previous studies in the field of COG delay and position in people with acute back pain. The P reported are from the t-test for all parameters except maximum pain experienced at the onset of LBP and sex (Mann Whitney U and chi-square tests, respectively). The level of significance was set at α≤0.05 for all tests. Mean and maximal pain were considered continuous data. Since the onset of LBP, the pain duration included both stages of remission and exacerbation. effect size for scale data was measured by Hedges’ g, and the effect size for categorical data was calculated via an odd ratio.
3. Results
Mapping the cortical representation of paraspinal muscles was possible in all participants with CLBP with TMS intensities as low as the motor threshold of the APB muscle, i.e. 49%±0.08% MSO. A reduced number of discrete peaks was demonstrated in 33% of the participants, while the rest (67%) showed discrete peaks in their cortical map of the paraspinal muscles. All variables were normally distributed except for the maximum pain experienced at the onset of LBP (P=0.00) and the mean latency at all active sites (P=0.008). We did not find any statistically significant correlation between the mapping parameters and symptom-related outcomes (pain intensity or duration and self-reported disability).
Pain duration from the onset of the first episode of LBP was longer in CLBP participants with reduced cortical peaks (Table 1), although this was not statistically significant (P>0.05) and the effect size was low to medium (Hedges’g=0.37).
Body mass index (BMI) was also greater in CLBP participants with reduced cortical peaks and disability as measured by the oswestry disability index (ODI) was less in these group of participants (Table 1), but these differences were not statistically significant and the effect sizes were lower than medium (Hedges’g <0.5). Map volume, map area, peak MEP amplitudes, and the minimum MEP amplitudes recorded at active sites were relatively larger in people with CLBP with discrete peaks (Table 2), and pain duration from the onset of the first episode of LBP was longer in CLBP participants with reduced cortical peaks (Table 1), although this was not statistically significant (P>0.05) and the effect size was low to medium (Hedges’ g=0.37). BMI was also greater in CLBP participants with reduced cortical peaks, and disability as measured by the ODI was less in this group of participants (Table 1), but these differences were not statistically significant, and the effect sizes were lower than medium (Hedges’g <0.5). Map volume, map area, peak MEP amplitudes, and the minimum MEP amplitudes recorded at active sites were relatively larger in people with CLBP with discrete peaks (Table 2), and MEP latencies both at optimal sites and all active sites were relatively shorter in people with CLBP without discrete peaks (Table 2). The effect size was large for map volume (Hedges’g=0.89) and map area (Hedges’g=0.86), medium for MEP latency evoked from hot spots (Hedges’g=0.54), and minimum MEP evoked from all active sites (Hedges’g=0.37), but none of these differences were statistically significant (all P>0.05) (Table 2). The large and medium effect sizes demonstrated that there was a practically significant difference between the two subsets of people with CLBP with and without discrete peaks regarding the aforementioned mapping outcomes, such as volume and area, which did not reach the level of significance in statistical testing. This can be due to the comparison of the two groups of participants with CLBP with and without discrete peaks with unequal sample sizes, which could have lowered the statistical power of our statistical analysis (Grace-Martin, 2017). It is noteworthy to mention that this sampling occurred naturally as a result of TMS data analysis, and we had no control over that.
The only statistically significant difference observed between the two subgroups of participants with CLBP with and without discrete peaks, was the dominant sex in each group, as recognized by the chi-square test (P=0.043) so that the number of male participants in the CLBP subgroup without discrete peaks was 83% (five out of six) versus 25% (three out of 12) in the CLBP subgroup with discrete peaks. The effect size for gender difference between the two subgroups of CLBP with and without discrete peaks was very large (η2=0.306).
As confirmed by a one-sample t-test, latency at the optimal site (22.66±10.15 ms) was not significantly different from the normative data presented for healthy humans (19.3±4.78 ms) (O’Connell et al., 2007), but latency at all the other active sites of our subjects with CLBP (25.87±9.54 ms) significantly differed from data provided in this regard for normal subjects earlier (19.72±4.41 ms) (O’Connell et al., 2007) (P=0.013).
Comparing our mapping results with those from previous studies showed that the COG of the cortical map of paraspinal muscles in our CLBP subjects (X=3.02±0.31 cm, Y=3.12±0.49 cm) was significantly shifted anteriorly and laterally compared to values reported for the COG in healthy (X=2.5±0.6 cm, Y=-0.3±0.9 cm), acute LBP (X=2.3±0.6 cm, Y=-0.1±0.1 cm) (Chang et al., 2019), and CLBP patients (x=2.4±0.8 cm, Y=1.3±1.1 cm) (Elgueta-Cancino et al., 2018) constructed via spTMS (all P=0.000).
4. Discussion
TMS brain mapping has been underutilized for purposes other than presurgical monitoring of the motor and eloquent areas (Krieg, 2017), despite the fact that it offers a promising noninvasive approach for tracking cortical reorganization in pathologies, after training or surgery, during rehabilitation, or any other longitudinal studies (Novikov et al., 2018). This could be due to the lack of standardized methodologies (Novikov et al., 2018) that meet the variable and unique requirements of different conditions or muscle groups. Using a “one size fits all” method for mapping the cortical reorganization in different conditions and muscle groups may cause researchers and clinicians some difficulties. Addressing these issues may pave the way for further mapping studies to discover the pathophysiological basis of chronic conditions such as CLBP and track the cortical plastic changes after rehabilitation and training (Novikov et al., 2018). In this study, implementing a paired-pulse TMS paradigm with two consecutive TMS pulses with a test (first) TMS stimulus set at 100% MTh followed by subthreshold conditioning (second) TMS pulse set at 90% MTh with an interstimulus interval of 1 ms (Ziemann et al., 1998; Ortu et al., 2008), along with active engagement of paraspinal muscles both in an APA activity (Chiou et al., 2016) and MVC (Lagan et al., 2008; Jaberzadeh et al., 2013), made it possible to decrease the energy needed for stimulating/mapping the cortical representation of paraspinal muscles up to 50% MSO. The rMT for APB was used to formulate the paired-pulse paradigm, and the rMT for APB muscle was found to be≈50% MSO (49%±0.07% MSO) (Mean±SD [pooled]) in the participants with CLBP in this study (Table 2). The intensity of the first pulse was 100% (50% MSO), which equaled 50% MSO, and the intensity of the second pulse was 90% (50% MSO), which equaled≈45% MSO. Consequently, it was possible to stimulate the cortical maps of paraspinal muscles with such low TMS intensities as rMT for the hand muscles (APB), i.e. ≤50% MSO, using this paired-pulse TMS paradigm, while it was not possible to stimulate the motor cortical maps of the paraspinal muscles using single-pulse TMS, even at maximum stimulator output (100% MSO). As mentioned earlier, the rMT of the APB muscle was used because calculating resting or active motor threshold directly for paraspinal muscles was not possible using single-pulse TMS, and the APB rMT has been implemented as a general estimate of cortical excitability in studies mapping multiple muscles (Sollmann et al., 2017a).
This method appears to improve the feasibility of TMS mapping in people with CLBP who have reduced CSE (Strutton et al., 2005). It was reflected by no mapping failure in our study compared to previous studies that had reported mapping failure in at least some of their participants (O’Connell et al., 2007; Kuppuswamy et al., 2008; Tsao et al., 2011a; Tsao et al., 2011b), because the MTh to evoke MEPs in paraspinal muscles exceeded the maximum stimulator output in those particular subjects. The TMS intensity needed to stimulate the cortical maps of paraspinal muscles in our study using the paired-pulse paradigm was substantially below the maximum stimulator output limits. This reduced the potential risk of seizure and discomfort from face and neck muscle contractions associated with applying higher TMS pulse intensities (Sollmann et al., 2020), which were inevitable in previous studies using single-pulse TMS (Ferbert et al., 1992; O’Connell et al., 2007; Tsao et al., 2011a; Tsao et al., 2011b; Schabrun et al., 2017).
Analysis of the mapping parameters in the current study demonstrated reorganization of the M1 in terms of shift of the COG of the cortical maps of the paraspinal muscles in all the participants with CLBP; however, a reduced number of discrete peaks in these maps was only evident in a subset of the participants (33%).
COG is a robust measure of cortical representations (Tsao et al., 2008). The COG is closely related to the hotspots of the cortical maps. A “hot spot” is an area with higher excitability in the cortical maps that contains the highest density of cortico-motor neuronal projections to a given muscle (Wassermann et al., 1992). The cortical map of each muscle contains one or more “hot spots,” so-called “optimal stimulation sites,” which can evoke MEPs with the largest amplitudes in that muscle. The shift of the COG, which can also be regarded as the shift of the optimal stimulation site on the scalp to evoke MEPs in a given muscle, is an indicator of cortical reorganization (Uy et al., 2002). The shift of the COG has been documented in other muscle groups (deep abdominal muscles) in CLBP (Tsao et al., 2008) and other chronic pain conditions, such as phantom limb pain (Karl et al., 2001).
The location of the COG in the participants with CLBP in our study was shifted more anteriorly and laterally compared to data for healthy and acute LBP (Chang et al., 2019). Although O’Connell et al. did not calculate the exact coordinates of the COG for the cortical map of the paraspinal muscles, reported two optimal sites for evoking MEPs in paraspinal muscles in healthy people: One optimal site at 2 cm anterior and 2 cm lateral to the vertex point (0, 0), and another optimal site at 4 cm anterior and 2 cm lateral (O’Connell et al., 2007). As demonstrated in Figure 2 for two representative participants in our study, the peaks of the cortical maps of the paraspinal muscles both in CLBP subjects with and without discrete peaks were more anterior and lateral compared to both or one of the optimal sites reported for healthy back subjects by O’Connell et al., (2007). Anterior and lateral shifts of the COG were consistent with previous studies that have reported anterior shifts in the cortical map of paraspinal muscles using surface EMG electrodes (Schabrun et al., 2017; Elgueta-Cancino et al., 2018) in people with CLBP. But the magnitude of the shift in COG was larger in our study compared to previous ones, which may be justified by the use of a paired-pulse biphasic TMS paradigm, which is reported to elongate cortical maps in both anterior-posterior and mediolateral directions (Pitkänen et al., 2018). Although this may not be an important factor when the goal is simply to investigate the cortical reorganization in CLBP, it may have consequences when the precise location of COG is required in other serious conditions, such as in tumor resections (Pitkänen et al., 2018). In future studies, combining functional brain imaging (fMRI) and navigated brain stimulation with both single- and paired-pulse TMS mapping is likely to reduce the variability observed in the COG of the cortical maps (Tsao et al., 2008) and determine which one best resembles the reality of COG in cortical maps. Nevertheless, the best way to accomplish this goal would be to compare paired-pulse TMS mapping with direct cortical stimulation (Pitkänen et al., 2018).
A reduced number of discrete peaks was observed in a smaller subset of CLBP patients (33%), compared to a previous study that reported a reduced number of discrete cortical peaks in 67% of CLBP patients (Schabrun et al., 2017). This could be due to the fact that our participants’ pain was mild at the time of experience (less than 2 on the VAS), whereas, in a previous study (Schabrun et al., 2017), a lower number of discrete peaks was reported to be related to the severity of LBP at the time of exam. The interesting finding was that the pain duration was longer in CLBP patients with overlapped peaks. Thus, a reduced number of peaks may suggest a more chronic stage of CLBP. This is in line with a study that reported a positive relationship between the magnitude of cortical reorganization in the somatosensory cortex and pain chronicity in people with CLBP (Flor et al., 1997).
The mean latency at all active sites was significantly prolonged compared to the normative data presented in this regard (O’Connell et al., 2007), although it was not significant at the optimal site. Prolongation of latency has been implicated in cortico-cortical connections’ pathology in some conditions (Kallioniemi et al., 2015), but it cannot be assured that in our study, prolongation of the latency was due to the pathology because considerably lower amounts of stimulator intensity were needed to evoke MEPs via paired-pulse TMS (Pitkänen et al., 2018), i.e. 50% MSO pulse TMS to evoke MEPs (O’Connell et al., 2007). It has been demonstrated that stimulator intensity has an inverse relationship with MEP latency (Fuhr et al., 1991b). Also, maximum voluntary contraction of paraspinal muscles was utilized in the present study compared to previous studies (O’Connell et al., 2007; Tsao et al., 2011a; Tsao et al., 2011b) that utilized 20% of MVC and Kuppuswamy et al. have reported a prolongation of latency with increased muscle activity (Kuppuswamy et al., 2008).
MEP latency at the optimal site in this study did not differ significantly from normative data, which may be explained by the fact that MEPs that result from stimulation of the optimal site are mainly induced by direct waves (D-waves) (Kallioniemi et al., 2015), but are not affected by CSE, unlike those that result from the stimulation of the other active site and are induced by indirect waves (I-waves), which are enormously impacted by CSE. D-waves result from direct stimulation of the corticospinal tract via TMS, while I-waves indirectly stimulate the corticospinal tract through cortical interneurons when stimulated by TMS (Zewdie & Kirton, 2016). Discovering the exact etiology of the prolongation of MEP latencies warrants further mapping studies using a newly introduced method with matched healthy controls, which were not included in this study.
Map volume and area in the subgroup of CLBP without discrete peaks were smaller, and MEP amplitudes at all active sites were lower, reflecting the reduced CSE to paraspinal muscles in this subgroup of CLBP. Reduced CSE to paraspinal muscles was found earlier in CLBP patients compared to normal subjects (Strutton et al., 2005) and has been suggested as a causal factor for the transition from acute LBP to CLBP (Jenkins et al., 2021). Other chronic pain conditions, such as complex regional pain syndrome, have been linked to smaller cortical map volumes (Krause et al., 2006).
A novel finding of this study was that the number of discrete peaks in the cortical map of paraspinal muscles in participants with CLBP was related to the categorical demographic variable of gender, which has never been reported before. Gender differences have been reported in neuromuscular strategies, postural control, and response to treatment (Nelson-Wong et al., 2012). Thus, the number of discrete peaks can be related to different neuromuscular strategies that different genders adopt in response to LBP. The CNS adopts a new motor control strategy in response to LBP to minimize the adverse effects of pain and injury (Tsao et al., 2011b). The validity of this theory should be further confirmed in future studies comparing neuromuscular strategies adopted by different genders with TMS mapping outcomes for different genders.
No significant relationship was found between symptoms-related outcomes (e.g. pain duration or intensity and rated disability on the ODI) and mapping outcomes, which was similar to the results of some previous studies (Tsao et al., 2011b) and contradictory to the findings of others reporting a relationship between the cortical representation of paraspinal muscles and pain characteristics (Byl et al., 1997; Schabrun et al., 2017; Elgueta-Cancino et al., 2018). This could be because our sample size was relatively small compared to the studies that reported a relationship between these items since correlations usually manifest in larger samples.
5. Conclusion
The facilitation of CSE to paraspinal muscles by engaging them conjunctively both in a postural and a maximal voluntary activity, combined with the application of a more potent biphasic paired-pulse TMS paradigm that induces short-term intracortical facilitation, makes TMS mapping more practical in people with CLBP by substantially cutting the TMS energy needed to stimulate the cortical representation of paraspinal muscles in M1 and thus makes TMS mapping less hazardous in regards to the risk of possible seizures and more tolerable for the patients by decreasing the discomfort that results from the contraction of the facial muscles with the application of high intensities.
Limitations and future directions
First, in this study, we were not able to measure active MTh or resting MTh via single monophasic TMS pulses directly from paraspinal muscles. We reasoned that it might be due to the double baseline noise reported for the MagVenture TMS machine we used vs the Magstim device, which had been used in previous studies that obscured the inherently small MEPs from paraspinal muscles evoked by monophasic spTMS pulses. This shows that the technical differences that exist among the TMS stimulators from different brands may have a non-negligible impact on cortical mapping outcomes and stand in the way of obtaining comparable results from different labs, which has been emphasized as a prerequisite for summing and comparing data from different sources in an open science method. This highlights the importance of future comparative studies between TMS stimulators of different brands to determine the impact of technical differences, such as field strength, wavelength, baseline noise, cooling system, etc. on mapping outcomes and controlling for them as a covariate.
Second, we lacked a matched control group, which appears to be required in future studies to provide normative data on the outcomes of the paired-pulse TMS paradigms in mapping the cortical representation of paraspinal muscles in healthy back subjects in order to distinguish differences caused by different mapping methods from those caused by pure reorganization.
Ethical Considerations
Compliance with ethical guidelines
All procedures performed in this study were in accordance with the ethical standards of the institutional and/or national research committee and with the 1964 Helsinki Declaration and its later amendments or comparable ethical standards. The study was approved by the Ethics Committee of the Tarbiat Modares University of Medical Sciences (Code: IR.MODARES.REC.1397.146). Informed consent was obtained from all participants included in the study.
Funding
This paper was financially supported by the Vice-Chancellor for research at Tarbiat Modares University (Grant No.: MED41265).
Authors' contributions
Conceptualization: Solaleh Saraiepour, Sedighe Kahrizi and Mojdeh Ghabaee; Methodology: Solaleh Saraiepour, Mojdeh Ghabaee and Babak Bazrgari; Formal analysis: Solaleh Saraiepour, Sedighe Kahrizi and Babak Bazrgari; Data curation, investigation and subject recruitment: Solaleh Saraiepour; Supervision and project administration: Sedighe Kahrizi; Validation: Mojdeh Ghabaee; Writing: All authors.
Conflict of interest
The authors declared no conflict of interest.
Acknowledgments
The authors would like to express their gratitude to the Faculty of Medicine, Tarbiat Modares University for their support. The authors also are grateful for the sincere cooperation of the staff of National Brain Mapping Lab of Tehran University's Engineering College, both in operating TMS and assisting in data analysis.
References
Abbruzzese, G., & Trompetto, C. (2017). Motor evoked potential. In J. Stein (Ed.), Reference module in neuroscience and biobehavioral psychology (pp. 194-195), Amsterdam: Elsevier. [DOI:10.1016/B978-0-12-809324-5.00676-3]
Barker, A. T., Jalinous, R., & Freeston, I. L. (1985). Non-invasive magnetic stimulation of human motor cortex. Lancet, 1(8437), 1106–1107. [DOI:10.1016/S0140-6736(85)92413-4] [PMID]
Bulubas, L., Sabih, J., Wohlschlaeger, A., Sollmann, N., Hauck, T., & Ille, S., et al. (2016). Motor areas of the frontal cortex in patients with motor eloquent brain lesions. Journal of Neurosurgery, 125(6), 1431–1442.[DOI:10.3171/2015.11.JNS152103] [PMID]
Byl, N. N., Merzenich, M. M., Cheung, S., Bedenbaugh, P., Nagarajan, S. S., & Jenkins, W. M. (1997). A primate model for studying focal dystonia and repetitive strain injury: Effects on the primary somatosensory cortex. Physical Therapy, 77(3), 269–284. [DOI:10.1093/ptj/77.3.269] [PMID]
Capaday, C., Ethier, C., Van Vreeswijk, C., & Darling, W. G. (2013). On the functional organization and operational principles of the motor cortex. Frontiers in Neural Circuits, 7, 66. [DOI:10.3389/fncir.2013.00066] [PMID] [PMCID]
Chang, W. J., Buscemi, V., Liston, M. B., McAuley, J. H., Hodges, P. W., & Schabrun, S. M. (2019). Sensorimotor cortical activity in acute low back pain: A cross-sectional study. The Journal of Pain, 20(7), 819–829. [DOI:10.1016/j.jpain.2019.01.006] [PMID]
Chang, W. J., O'Connell, N. E., Beckenkamp, P. R., Alhassani, G., Liston, M. B., & Schabrun, S. M. (2018). Altered primary motor cortex structure, organization, and function in chronic pain: A systematic review and meta-analysis. The Journal of Pain, 19(4), 341–359. [DOI:10.1016/j.jpain.2017.10.007] [PMID]
Chiou, S. Y., Gottardi, S. E., Hodges, P. W., & Strutton, P. H. (2016). Corticospinal excitability of trunk muscles during different postural tasks. Plos One, 11(1), e0147650. [DOI:10.1371/journal.pone.0147650] [PMID] [PMCID]
Cram, J. R., & Steger, J. C. (1983). EMG scanning in the diagnosis of chronic pain. Biofeedback and Self-Regulation, 8(2), 229–241. [DOI:10.1007/BF00998853] [PMID]
Criswell, E. (2011). Cram’s introduction to surface electromyography. Sudbury: Jones & Bartlett Learning. [Link]
Elgueta-Cancino, E., Schabrun, S., & Hodges, P. (2018). Is the organization of the primary motor cortex in low back pain related to pain, movement, and/or sensation?. The Clinical Journal of Pain, 34(3), 207–216. [DOI:10.1097/AJP.0000000000000535] [PMID]
Farfan, H. (1973). Mechanical disorders of the low back, Philadelphia. Pennsylvania: Lea & Febiger. [Link]
Ferbert, A., Caramia, D., Priori, A., Bertolasi, L., & Rothwell, J. C. (1992). Cortical projection to erector spinae muscles in man as assessed by focal transcranial magnetic stimulation. Electroencephalography and Clinical Neurophysiology, 85(6), 382–387. [DOI:10.1016/0168-5597(92)90051-C] [PMID]
Flor, H., Braun, C., Elbert, T., & Birbaumer, N. (1997). Extensive reorganization of primary somatosensory cortex in chronic back pain patients. Neuroscience Letters, 224(1), 5–8.[DOI:10.1016/S0304-3940(97)13441-3] [PMID]
Fuhr, P., Agostino, R., & Hallett, M. (1991). Spinal motor neuron excitability during the silent period after cortical stimulation. Electroencephalography and Clinical Neurophysiology, 81(4), 257–262. [DOI:10.1016/0168-5597(91)90011-L] [PMID]
Fuhr, P., Cohen, L. G., Roth, B. J., & Hallett, M. (1991). Latency of motor evoked potentials to focal transcranial stimulation varies as a function of scalp positions stimulated. Electroencephalography and Clinical Neurophysiology, 81(2), 81–89. [DOI:10.1016/0168-5597(91)90001-E] [PMID]
Grace-Martin, K. (2017). When unequal sample sizes are and are not a problem in ANOVA. Retrieved from: [Link]
Groppa, S., Oliviero, A., Eisen, A., Quartarone, A., Cohen, L. G., & Mall, V., et al. (2012). A practical guide to diagnostic transcranial magnetic stimulation: Report of an IFCN committee. Clinical Neurophysiology, 123(5), 858–882. [DOI:10.1016/j.clinph.2012.01.010] [PMID] [PMCID]
Hess, C. W., Mills, K. R., & Murray, N. M. (1987). Responses in small hand muscles from magnetic stimulation of the human brain. The Journal of Physiology, 388, 397–419. [DOI:10.1113/jphysiol.1987.sp016621] [PMID] [PMCID]
Hodges, P. W., & Richardson, C. A. (1997). Feedforward contraction of transversus abdominis is not influenced by the direction of arm movement. Experimental Brain Research, 114(2), 362–370. [DOI:10.1007/PL00005644] [PMID]
Hodges, P. W., & Moseley, G. L. (2003). Pain and motor control of the lumbopelvic region: Effect and possible mechanisms. Journal of Electromyography and Kinesiology, 13(4), 361–370. [DOI:10.1016/S1050-6411(03)00042-7] [PMID]
Hodges, P. W., & Richardson, C. A. (1997). Relationship between limb movement speed and associated contraction of the trunk muscles. Ergonomics, 40(11), 1220–1230. [DOI:10.1080/001401397187469] [PMID]
Hoy, D., March, L., Brooks, P., Blyth, F., Woolf, A., & Bain, C., et al. (2014). The global burden of low back pain: Estimates from the Global Burden of Disease 2010 study. Annals of the Rheumatic Diseases, 73(6), 968–974. [DOI:10.1136/annrheumdis-2013-204428] [PMID]
Jaberzadeh, S., Zoghi, M., Morgan, P., & Storr, M. (2013). Corticospinal facilitation of erector spinae and rectus abdominis muscles during graded voluntary contractions is task specific: A pilot study on healthy individuals. Basic and Clinical Neuroscience, 4(3), 209–216. [PMID] [PMCID]
Janda, V. (1978). Muscles, central nervous motor regulation and back problems. In I. M. Korr (Ed.), The neurobiologic mechanisms in manipulative therapy (pp. 27-41). New York: Springer. [DOI:10.1007/978-1-4684-8902-6_2]
Jenkins, L. C., Chang, W. J., Buscemi, V.,Liston, M., Humburg, P., & Nicholas, M., et al (2021). Cortical function and sensorimotor plasticity are prognostic factors associated with future low back pain after an acute episode: The understanding persistent pain where it resides prospective cohort study. Pain, 164(1), 14-26. [DOI:10.1097/j.pain.0000000000002684]
Julkunen, P., Järnefelt, G., Savolainen, P., Laine, J., & Karhu, J. (2016). Facilitatory effect of paired-pulse stimulation by transcranial magnetic stimulation with biphasic wave-form. Medical Engineering & Physics, 38(8), 813–817. [DOI:10.1016/j.medengphy.2016.04.025] [PMID]
Kallioniemi, E., Pitkänen, M., Säisänen, L., & Julkunen, P. (2015). Onset latency of motor evoked potentials in motor cortical mapping with neuronavigated transcranial magnetic stimulation. The Open Neurology Journal, 9, 62–69. [DOI:10.2174/1874205X01509010062] [PMID]
Karl, A., Birbaumer, N., Lutzenberger, W., Cohen, L. G., & Flor, H. (2001). Reorganization of motor and somatosensory cortex in upper extremity amputees with phantom limb pain. The Journal of Neuroscience, 21(10), 3609–3618. [DOI:10.1523/JNEUROSCI.21-10-03609.2001] [PMID] [PMCID]
Katz J. N. (2006). Lumbar disc disorders and low-back pain: Socioeconomic factors and consequences. The Journal of bone and joint surgery. American Volume, 88(Suppl 2), 21–24. [DOI:10.2106/JBJS.E.01273] [PMID]
Kiers, L., Cros, D., Chiappa, K. H., & Fang, J. (1993). Variability of motor potentials evoked by transcranial magnetic stimulation. Electroencephalography and Clinical Neurophysiology, 89(6), 415–423. [DOI:10.1016/0168-5597(93)90115-6] [PMID]
Koes, B. W., van Tulder, M. W., & Thomas, S. (2006). Diagnosis and treatment of low back pain. BMJ, 332(7555), 1430–1434. [DOI:10.1136/bmj.332.7555.1430] [PMID] [PMCID]
Krause, P., Förderreuther, S., & Straube, A. (2006). TMS motor cortical brain mapping in patients with complex regional pain syndrome type I. Clinical Neurophysiology, 117(1), 169–176. [DOI:10.1016/j.clinph.2005.09.012] [PMID]
Krieg, S. M. (2017). Navigated transcranial magnetic stimulation in Neurosurgery. New York: Springer. [Link]
Krieg, S. M., Shiban, E., Buchmann, N., Gempt, J., Foerschler, A., & Meyer, B., et al. (2012). Utility of presurgical navigated transcranial magnetic brain stimulation for the resection of tumors in eloquent motor areas. Journal of Neurosurgery, 116(5), 994–1001. [DOI:10.3171/2011.12.JNS111524] [PMID]
Krieg, S. M., Shiban, E., Buchmann, N., Meyer, B., & Ringel, F. (2013). Presurgical navigated transcranial magnetic brain stimulation for recurrent gliomas in motor eloquent areas. Clinical Neurophysiology, 124(3), 522–527. [DOI:10.1016/j.clinph.2012.08.011] [PMID]
Krieg, S. M., Sollmann, N., Obermueller, T., Sabih, J., Bulubas, L., & Negwer, C., et al. (2015). Changing the clinical course of glioma patients by preoperative motor mapping with navigated transcranial magnetic brain stimulation. BMC Cancer, 15, 231. [DOI:10.1186/s12885-015-1258-1] [PMID] [PMCID]
Kuppuswamy, A., Catley, M., King, N. K., Strutton, P. H., Davey, N. J., & Ellaway, P. H. (2008). Cortical control of erector spinae muscles during arm abduction in humans. Gait & Posture, 27(3), 478–484. [DOI:10.1016/j.gaitpost.2007.06.001] [PMID]
Lagan, J., Lang, P., & Strutton, P. H. (2008). Measurement of voluntary activation of the back muscles using transcranial magnetic stimulation. Clinical Neurophysiology, 119(12), 2839–2845. [DOI:10.1016/j.clinph.2008.09.013] [PMID]
Massé-Alarie, H., Beaulieu, L. D., Preuss, R., & Schneider, C. (2016). Corticomotor control of lumbar multifidus muscles is impaired in chronic low back pain: Concurrent evidence from ultrasound imaging and double-pulse transcranial magnetic stimulation. Experimental Brain Research, 234(4), 1033–1045. [DOI:10.1007/s00221-015-4528-x] [PMID]
Massé-Alarie, H., Beaulieu, L. D., Preuss, R., & Schneider, C. (2017). Repetitive peripheral magnetic neurostimulation of multifidus muscles combined with motor training influences spine motor control and chronic low back pain. Clinical Neurophysiology, 128(3), 442–453. [DOI:10.1016/j.clinph.2016.12.020] [PMID]
Massé-Alarie, H., Neige, C., Bouyer, L. J., & Mercier, C. (2018). Modulation of corticospinal excitability of trunk muscles in preparation of rapid arm movement. Neuroscience, 369, 231–241. [DOI:10.1016/j.neuroscience.2017.11.024] [PMID]
Massé-Alarie, H., & Schneider, C. (2016). Revisiting the corticomotor plasticity in low back pain: Challenges and perspectives. Healthcare, 4(3), 67. [DOI:10.3390/healthcare4030067] [PMID] [PMCID]
Massé-Alarie, H., Bergin, M. J. G., Schneider, C., Schabrun, S., & Hodges, P. W. (2017). "Discrete peaks" of excitability and map overlap reveal task-specific organization of primary motor cortex for control of human forearm muscles. Human Brain Mapping, 38(12), 6118–6132. [DOI:10.1002/hbm.23816] [PMID] [PMCID]
May A. (2008). Chronic pain may change the structure of the brain. Pain, 137(1), 7–15. [DOI:10.1016/j.pain.2008.02.034] [PMID]
Merskey, H. Classification of chronic pain. Descriptions of chronic pain syndromes and definitions of pain terms. Prepared by the International Association for the Study of Pain, Subcommittee on Taxonomy. (1986). Pain, Supplement3, S1–S226. [PMID]
Murase, N., Duque, J., Mazzocchio, R., & Cohen, L. G. (2004). Influence of interhemispheric interactions on motor function in chronic stroke. Annals of Neurology, 55(3), 400–409. [DOI:10.1002/ana.10848] [PMID]
Nelson-Wong, E., Alex, B., Csepe, D., Lancaster, D., & Callaghan, J. P. (2012). Altered muscle recruitment during extension from trunk flexion in low back pain developers. Clinical Biomechanics, 27(10), 994–998. [DOI:10.1016/j.clinbiomech.2012.07.007] [PMID]
Novey, W. (2019). Are all rTMS machines equal? New research suggests there may be clinically significant differences. Mental Illness, 11(1), 8125. [PMID] [PMCID]
Novikov, P. A., Nazarova, M. A., & Nikulin, V. V. (2018). TMSmap - software for quantitative analysis of TMS mapping results. Frontiers in Human Neuroscience, 12, 239. [DOI:10.3389/fnhum.2018.00239] [PMID] [PMCID]
O'Connell, N. E., Maskill, D. W., Cossar, J., & Nowicky, A. V. (2007). Mapping the cortical representation of the lumbar paravertebral muscles. Clinical Neurophysiology, 118(11), 2451–2455. [DOI:10.1016/j.clinph.2007.08.006] [PMID]
Oh, M. K., Kim, H. R., Kim, W. S., & Shin, H. I. (2017). Relationship between motor evoked potential response and the severity of paralysis in spinal cord injury patients. Annals of Rehabilitation Medicine, 41(2), 211–217. [DOI:10.5535/arm.2017.41.2.211] [PMID] [PMCID]
Ortu, E., Deriu, F., Suppa, A., Tolu, E., & Rothwell, J. C. (2008). Effects of volitional contraction on intracortical inhibition and facilitation in the human motor cortex. The Journal of Physiology, 586(21), 5147–5159. [DOI:10.1113/jphysiol.2008.158956] [PMID] [PMCID]
Panjabi M. M. (1992). The stabilizing system of the spine. Part I. Function, dysfunction, adaptation, and enhancement. Journal of Spinal Disorders, 5(4), 383–397. [DOI:10.1097/00002517-199212000-00001] [PMID]
Penfield, W., & Boldrey, E. (1937). Somatic motor and sensory representation in the cerebral cortex of man as studied by electrical stimulation. Brain, 60(4), 389-443. [DOI:10.1093/brain/60.4.389]
Petersen, T. H., Rosenberg, K., Petersen, N. C., & Nielsen, J. B. (2009). Cortical involvement in anticipatory postural reactions in man. Experimental Brain Research, 193(2), 161–171.[DOI:10.1007/s00221-008-1603-6] [PMID]
Pitkänen, M., Kallioniemi, E., Järnefelt, G., Karhu, J., & Julkunen, P. (2018). Efficient mapping of the motor cortex with navigated biphasic paired-pulse transcranial magnetic stimulation. Brain Topography, 31(6), 963–971. [DOI:10.1007/s10548-018-0660-9] [PMID]
Rossi, S., Hallett, M., Rossini, P. M., Pascual-Leone, A., & Safety of TMS Consensus Group (2009). Safety, ethical considerations, and application guidelines for the use of transcranial magnetic stimulation in clinical practice and research. Clinical Neurophysiology, 120(12), 2008–2039. [DOI:10.1016/j.clinph.2009.08.016] [PMID] [PMCID]
Rossini, P. M., Burke, D., Chen, R., Cohen, L. G., Daskalakis, Z., & Di Iorio, R., et al. (2015). Non-invasive electrical and magnetic stimulation of the brain, spinal cord, roots and peripheral nerves: Basic principles and procedures for routine clinical and research application. An updated report from an I.F.C.N. Committee. Clinical Neurophysiology, 126(6), 1071–1107. [DOI:10.1016/j.clinph.2015.02.001] [PMID] [PMCID]
Savoy R. L. (2001). History and future directions of human brain mapping and functional neuroimaging. Acta Psychologica, 107(1-3), 9–42. [DOI:10.1016/S0001-6918(01)00018-X] [PMID]
Schabrun, S. M., Elgueta-Cancino, E. L., & Hodges, P. W. (2017). Smudging of the motor cortex is related to the severity of low back pain. Spine, 42(15), 1172–1178. [DOI:10.1097/BRS.0000000000000938] [PMID]
Smith, V., D. Maslovat and A. N. Carlsen (2019). StartReact effects are dependent on engagement of startle reflex circuits: Support for a subcortically mediated initiation pathway. Journal of Neurophysiology 122(6), 2541-2547. [DOI:10.1152/jn.00505.2019] [PMID]
Sollmann, N., Bulubas, L., Tanigawa, N., Zimmer, C., Meyer, B., & Krieg, S. M. (2017). The variability of motor evoked potential latencies in neurosurgical motor mapping by preoperative navigated transcranial magnetic stimulation. BMC Neuroscience, 18(1), 5. [DOI:10.1186/s12868-016-0321-4] [PMID] [PMCID]
Sollmann, N., Tanigawa, N., Bulubas, L., Sabih, J., Zimmer, C., & Ringel, F., et al. (2017). Clinical factors underlying the inter-individual variability of the resting motor threshold in navigated transcranial magnetic stimulation motor mapping. Brain Topography, 30(1), 98–121. [DOI:10.1007/s10548-016-0536-9] [PMID]
Sollmann, N., Zhang, H., Kelm, A., Schröder, A., Meyer, B., & Pitkänen, M., et al. (2020). Paired-pulse navigated TMS is more effective than single-pulse navigated TMS for mapping upper extremity muscles in brain tumor patients. Clinical Neurophysiology, 131(12), 2887–2898. [DOI:10.1016/j.clinph.2020.09.025] [PMID]
Strutton, P. H., Theodorou, S., Catley, M., McGregor, A. H., & Davey, N. J. (2005). Corticospinal excitability in patients with chronic low back pain. Journal of Spinal Disorders & Techniques, 18(5), 420–424. [DOI:10.1097/01.bsd.0000169063.84628.fe] [PMID]
MagVenture. (2010). Motor threshold: Introduction to MEP monitor guideline for performing motor threshold with MagPro and MEP monitor. Denmark: MagVenture. [Link]
Tsao, H., Danneels, L., & Hodges, P. W. (2011). Individual fascicles of the paraspinal muscles are activated by discrete cortical networks in humans. Clinical Neurophysiology, 122(8), 1580–1587. [DOI:10.1016/j.clinph.2011.01.048] [PMID]
Tsao, H., Danneels, L. A., & Hodges, P. W. (2011). ISSLS prize winner: Smudging the motor brain in young adults with recurrent low back pain. Spine, 36(21), 1721–1727. [DOI:10.1097/BRS.0b013e31821c4267] [PMID]
Tsao, H., Galea, M. P., & Hodges, P. W. (2008). Reorganization of the motor cortex is associated with postural control deficits in recurrent low back pain. Brain, 131(Pt 8), 2161–2171. [DOI:10.1093/brain/awn154] [PMID]
Turton, A., & Lemon, R. N. (1999). The contribution of fast corticospinal input to the voluntary activation of proximal muscles in normal subjects and in stroke patients. Experimental Brain Research, 129(4), 559–572. [DOI:10.1007/s002210050926] [PMID]
Uy, J., Ridding, M. C., & Miles, T. S. (2002). Stability of maps of human motor cortex made with transcranial magnetic stimulation. Brain Topography, 14(4), 293–297.[DOI:10.1023/A:1015752711146] [PMID]
van de Ruit, M., & Grey, M. J. (2016). The TMS map scales with increased stimulation intensity and muscle activation. Brain Topography, 29(1), 56–66. [DOI:10.1007/s10548-015-0447-1] [PMID] [PMCID]
van Dieën, J. H., Reeves, N. P., Kawchuk, G., van Dillen, L. R., & Hodges, P. W. (2019). Motor control changes in low back pain: Divergence in presentations and mechanisms. The Journal of Orthopaedic and Sports Physical Therapy, 49(6), 370–379. [DOI:10.2519/jospt.2019.7917] [PMID] [PMCID]
Van Doren, J., Langguth, B., & Schecklmann, M. (2015). TMS-related potentials and artifacts in combined TMS-EEG measurements: Comparison of three different TMS devices. Neurophysiologie Clinique, 45(2), 159–166. [DOI:10.1016/j.neucli.2015.02.002] [PMID]
van Tulder, M., Becker, A., Bekkering, T., Breen, A., del Real, M. T., & Hutchinson, A., et al. (2006). Chapter 3. European guidelines for the management of acute nonspecific low back pain in primary care. European Spine Journal, 15(Suppl 2), S169–S191. [DOI:10.1007/s00586-006-1071-2] [PMID] [PMCID]
Vogt, L., Pfeifer, K., & Banzer, W. (2003). Neuromuscular control of walking with chronic low-back pain. Manual Therapy, 8(1), 21–28. [DOI:10.1054/math.2002.0476] [PMID]
Von Korff, M., Dworkin, S. F., & Le Resche, L. (1990). Graded chronic pain status: An epidemiologic evaluation. Pain, 40(3), 279–291. [DOI:10.1016/0304-3959(90)91125-3] [PMID]
GBD 2015 Disease and Injury Incidence and Prevalence Collaborators (2016). Global, regional, and national incidence, prevalence, and years lived with disability for 310 diseases and injuries, 1990-2015: A systematic analysis for the Global Burden of Disease Study 2015. Lancet, 388(10053), 1545–1602. [DOI:10.1016/S0140-6736(16)31678-6] [PMID] [PMCID]
Wand, B. M., & O'Connell, N. E. (2008). Chronic non-specific low back pain - sub-groups or a single mechanism?. BMC Musculoskeletal Disorders, 9, 11. [DOI:10.1186/1471-2474-9-11] [PMID] [PMCID]
Wand, B. M., Parkitny, L., O'Connell, N. E., Luomajoki, H., McAuley, J. H., & Thacker, M., et al. (2011). Cortical changes in chronic low back pain: Current state of the art and implications for clinical practice. Manual Therapy, 16(1), 15–20. [DOI:10.1016/j.math.2010.06.008] [PMID]
Wassermann E. M. (1998). Risk and safety of repetitive transcranial magnetic stimulation: Report and suggested guidelines from the international workshop on the safety of repetitive transcranial magnetic stimulation, June 5-7, 1996. Electroencephalography and Clinical Neurophysiology, 108(1), 1–16. [DOI:10.1016/0168-5597(92)90094-R] [PMID]
Zewdie, E. & Kirton, A. (2016). TMS basics: Single and paired pulse neurophysiology. In A. Kirton., & D. L, Gilbert (Eds.), Pediatric brain stimulation (pp. 3-22). Amsterdam: Elsevier. [DOI:10.1016/B978-0-12-802001-2.00001-1]
Ziemann, U., Tergau, F., Wassermann, E. M., Wischer, S., Hildebrandt J. & Paulus W. (1998). Demonstration of facilitatory I wave interaction in the human motor cortex by paired transcranial magnetic stimulation. The Journal of Physiology 511(1), 181-190. [DOI:10.1111/j.1469-7793.1998.181bi.x] [PMID]
Type of Study: Original |
Subject:
Clinical Neuroscience
Received: 2022/07/15 | Accepted: 2023/01/15 | Published: 2023/11/1
Received: 2022/07/15 | Accepted: 2023/01/15 | Published: 2023/11/1
Send email to the article author
| Rights and permissions | |
 |
This work is licensed under a Creative Commons Attribution-NonCommercial 4.0 International License. |
![]()
Copyright © The Author(s);
This is an open access article distributed under the terms of the Creative Commons Attribution License (CC-By-NC), which permits use, distribution, and reproduction in any medium, provided the original work is properly cited and is not used for commercial purposes.
Contact Information
