

Volume 14, Issue 5 (September & October 2023)
BCN 2023, 14(5): 615-630 |
Back to browse issues page


Download citation:
BibTeX | RIS | EndNote | Medlars | ProCite | Reference Manager | RefWorks
Send citation to:


BibTeX | RIS | EndNote | Medlars | ProCite | Reference Manager | RefWorks
Send citation to:
Kaur M, Gupta T, Gupta M, Singla N, Kharbanda P S, Bansal Y S, et al . Expressional Study of Permeability Glycoprotein and Multidrug Resistance Protein 1 in Drug-resistant Mesial Temporal Lobe Epilepsy. BCN 2023; 14 (5) :615-630
URL: http://bcn.iums.ac.ir/article-1-2207-en.html
URL: http://bcn.iums.ac.ir/article-1-2207-en.html
Mandeep Kaur1 

 , Tulika Gupta *1 , Mili Gupta2 , Navneet Singla3 , Parampreet S Kharbanda4 , Yogender Singh Bansal5 , Daisy Sahni1 , Bishan Das Radotra6 , Sunil Kumar Gupta3
, Tulika Gupta *1 , Mili Gupta2 , Navneet Singla3 , Parampreet S Kharbanda4 , Yogender Singh Bansal5 , Daisy Sahni1 , Bishan Das Radotra6 , Sunil Kumar Gupta3
1- Department of Anatomy, Institute of Medical Education and Research, Chandigarh, India.
2- Department of Biochemistry, Singh Judge Institute of Dental Sciences and Hospital, Panjab University, Chandigarh, India.
3- Department of Neurosurgery, Institute of Medical Education and Research, Chandigarh, India.
4- Department of Neurology, Institute of Medical Education and Research, Chandigarh, India.
5- Department of Forensic Medicine, Institute of Medical Education and Research, Chandigarh, India.
6- Department of Histopathology, Institute of Medical Education and Research, Chandigarh, India.
Keywords: Drug-efflux transporters, Drug-resistant epilepsy, Mesial temporal lobe epilepsy (MTLE), Permeability glycoprotein (P-gp), Multi-drug resistance 1 (MDR1), Multidrug resistance protein 1 (MRP1)
Full-Text [PDF 2770 kb]
| Abstract (HTML)
Full-Text:
1. Introduction
Epilepsy is the most prevalent neurological condition affecting approximately 69 million people worldwide (Rawat et al., 2020). Mesial temporal lobe epilepsy (MTLE) is the common form of partial epilepsy. More than 20 types of anti-epileptic drugs (AEDs) are available but around 20%-40% of the MTLE cases are multi-drug resistant. Uncontrolled seizures have been associated with sudden unexpected death in epilepsy in 6 per 1000 epilepsy patients per year (Laxer et al., 2014). Drug-resistant epileptic patients are at an increased risk of premature death, injuries, psychosocial dysfunction, and a reduced quality of life (Löscher & Friedman, 2020; Zavala-Tecuapetla et al., 2020). Therefore, understanding drug resistance in MTLE is an urgent clinical need.
The International League Against Epilepsy defines drug-resistant epilepsy as “failure of adequate trials of two tolerated, appropriately chosen and used antiepileptic drug schedules (whether as monotherapies or in combination) to achieve sustained seizure freedom” (Kwan et al., 2010). The mechanism of drug resistance in MTLE is poorly understood; therefore, the pathogenesis is considered to be multifactorial. Resistance is usually against multiple drugs with different modes of action. This suggests that the pathophysiological basis for developing drug resistance is non-specific (Kwan & Brodie, 2005). The principal factors thought to be involved in pharmacoresistant MTLE include the etiology of the disease, seizure activity progression under drug treatment, the complex temporal patterns, abnormalities in neuronal networks, changes in drug uptake across the blood-brain barrier (BBB), changes in AEDs targets, and elimination of AEDs from patient tissue through drug-efflux transporters (Lachos et al., 2011).
This is further explained well by two widely accepted hypotheses–target and transporter hypotheses. The most accepted explanation is the transporter hypothesis. This proposes that drug resistance occurs due to the up-regulation of efflux transporters in the brain capillaries of BBB. It prevents adequate drug entry to the target location in the brain by actively expelling the drugs (Sisodiya et al., 2002).
Two adenosine 5′-triphosphate (ATP)-binding cassette (ABC) drug-efflux transporters are thought to be chief players in resistant MTLE–multidrug-resistance protein 1 (MDR-1), gene encoding permeability glycoprotein (P-gp), and MRP-1. P-gp is a transmembrane glycoprotein that is primarily distributed in the organs associated with absorption, metabolism, and excretion. It is found in the brain at the BBB (Xiong et al., 2015). MRP-1 is an organic ion-transporter; it shares 15% of its amino acid sequence with P-gp. Unlike P-gp, MRP-1 is found in the choroid plexus epithelium and ependymal epithelium cells for the protection of the blood-cerebrospinal fluid barrier (BCB) (Keppler, 2011). Under physiological conditions, both the transporters expel the harmful substance to maintain the equilibrium of the internal environment of the brain.
Various animal trials have shown an increase in the expression of the P-gp in refractory epilepsy (Rizzi et al., 2002; Volk et al., 2005; Volk et al., 2004). Similarly, MRP-1 is overexpressed in animal models of refractory MTLE (Feldmann et al., 2013; Sisodiya et al., 2002). A study conducted on blood samples collected from epileptic patients showed increased expression of these efflux transporters in drug-resistant epileptics compared to patients controlled by AEDs. Most available efflux transporter studies on MTLE patient samples lack suitable control tissue to compare the data which is essential for result interpretation (Dombrowski et al., 2001; Kubota et al., 2006; Sisodiya et al., 2002; Tishler et al., 1995; Weidner et al., 2018). For control, most studies have used either disease-adjacent tissue or tissue obtained from surgeries done for other pathologies, such as arteriovenous malformation, aneurysms, etc. P-gp and MRP-1 dysfunction has also been reported in many neurological diseases, including tumors (de Klerk et al., 2010; Ginguené et al., 2010; Jablonski et al., 2014; Kortekaas et al., 2005; Lam et al., 2001; Sakata et al., 2011; Vogelgesang et al., 2006; Wijesuriya et al., 2010). Therefore, the inclusion of control tissue from brains without known neurological disease is necessary to validate the results.
The current study was designed to analyze the expression of P-gp and MRP-1 in detail and to find out the relative importance of these two in promoting drug resistance in MTLE. The study was conducted using hippocampal tissues obtained from drug-resistant MTLE patients undergoing surgery and age-matched control tissue obtained from the autopsy. We have studied P-gp and MRP-1 at both gene and protein levels. Moreover, immuno-histochemical analysis and confocal fluorescence microscopy were used to determine the cellular localization of these transporters.
2. Materials and Methods
Subjects
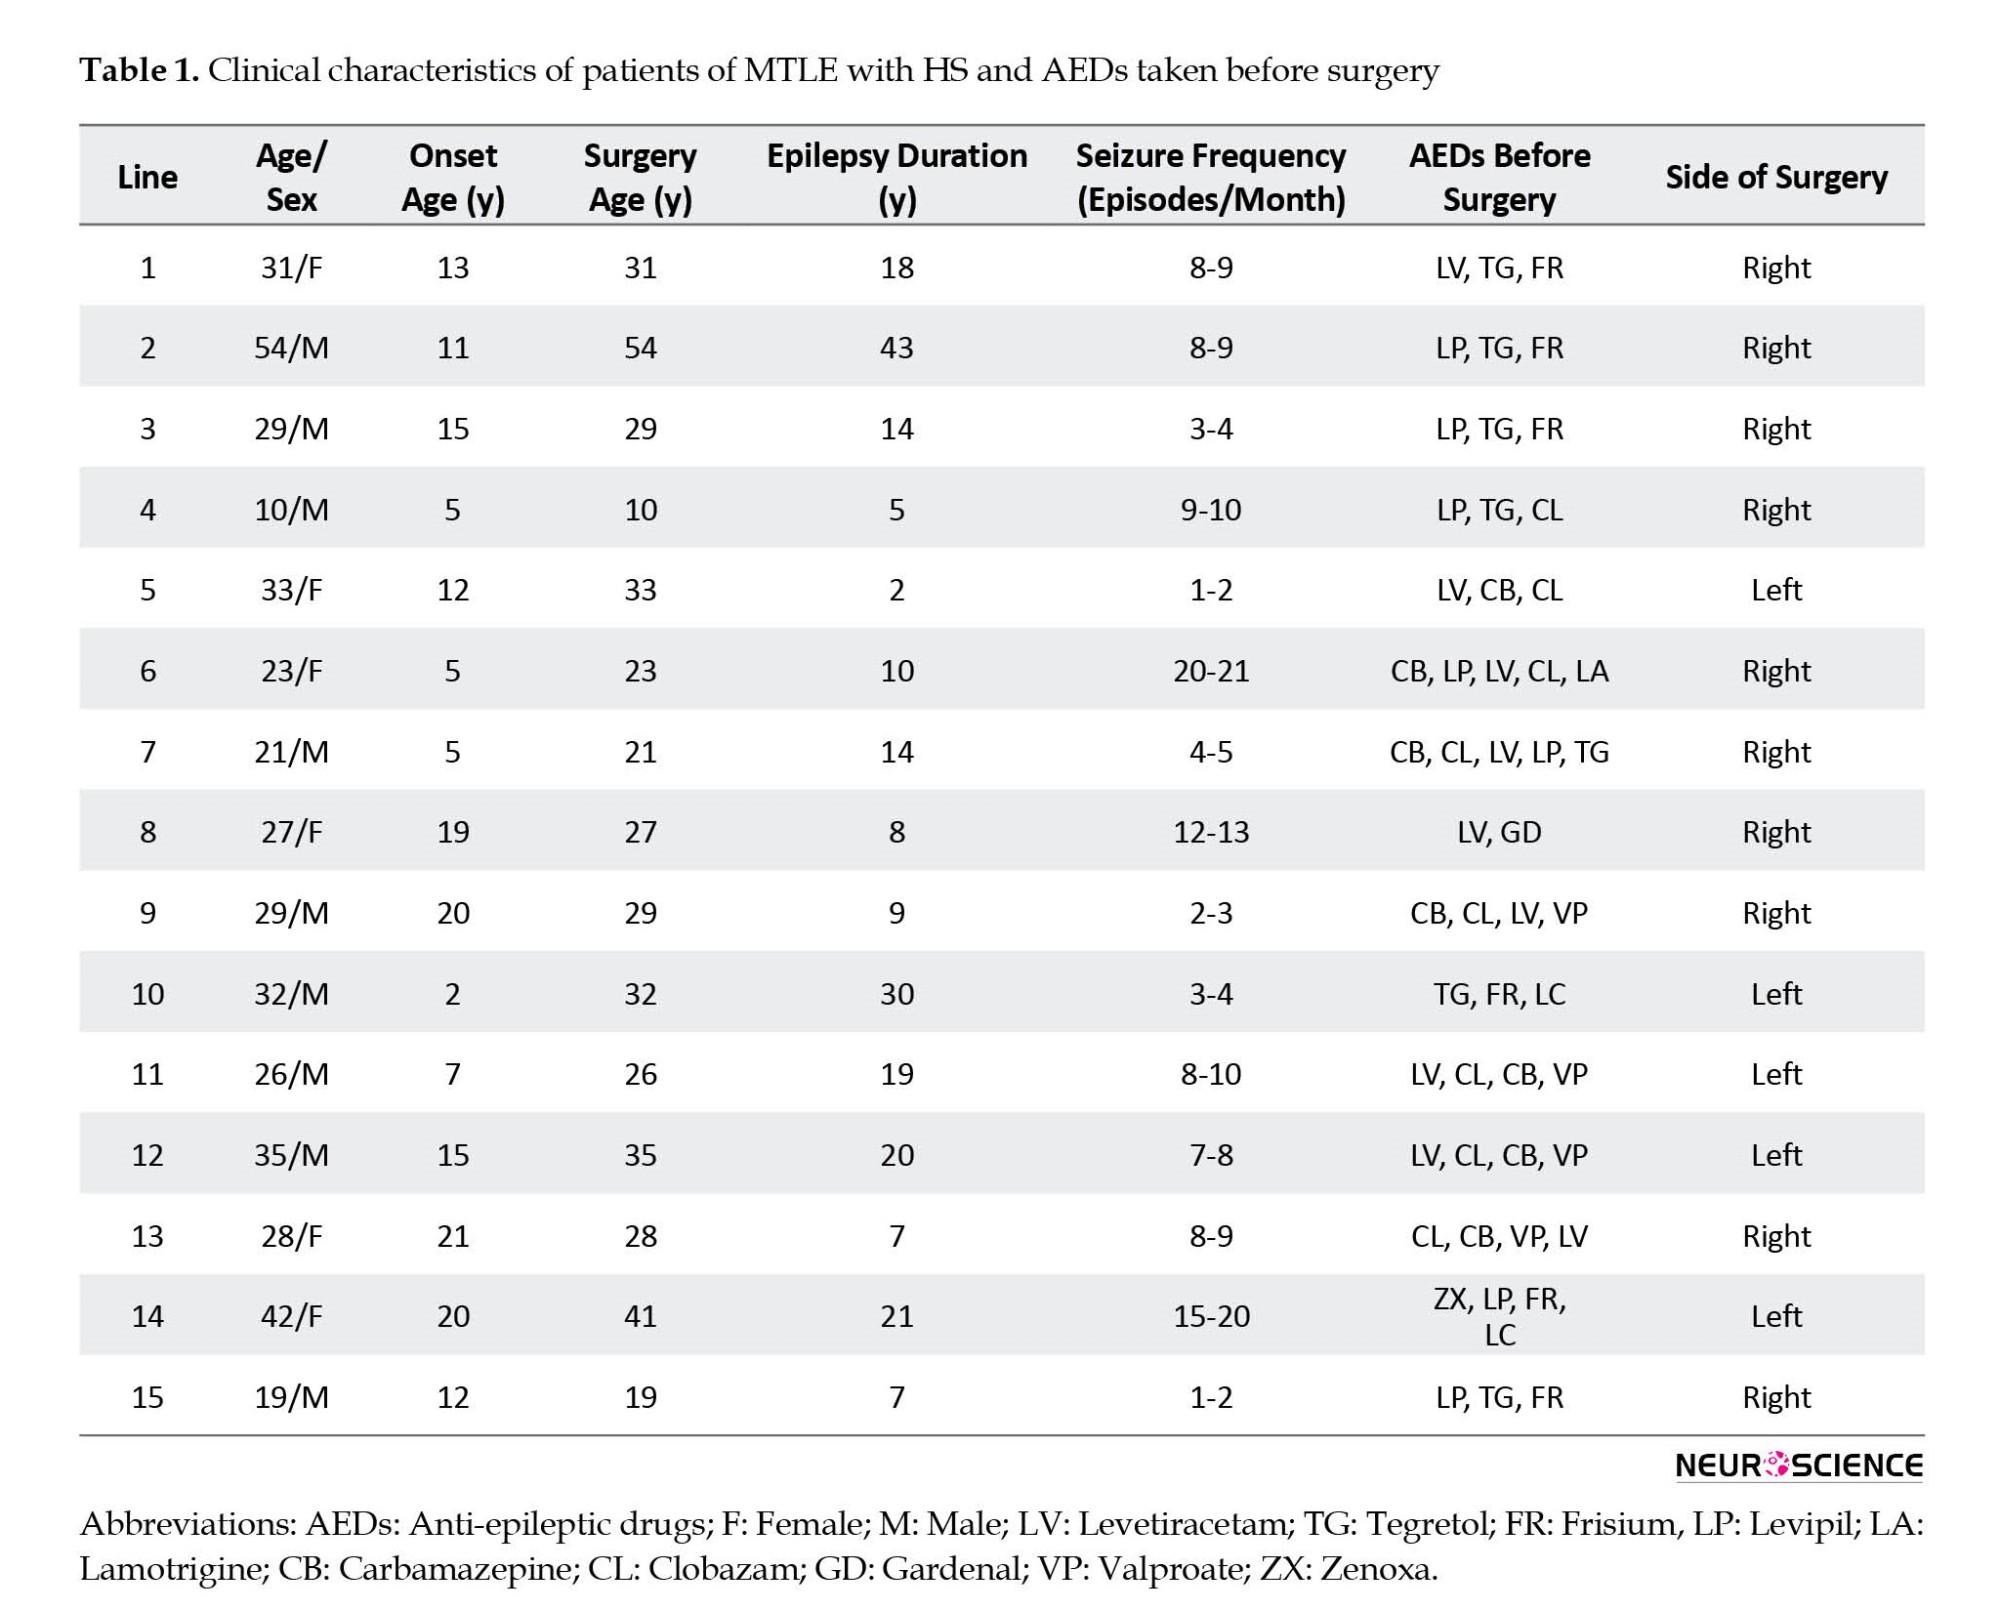
The hippocampal tissue was obtained from 15 drug-resistant MTLE patients who underwent MTLE surgery in the Department of Neurosurgery of the Postgraduate Institute of Medical Education and Research, Chandigarh, India. Table 1 presents the clinical data of the patients. The tissue was taken from the patients with pathologically proven hippocampal sclerosis (HS) only. The exclusion criteria included patients with seizure types other than partial seizures and tissues showing any structural intracranial insults, for example, gliomas, meningitis, and neurofibromatosis.
Controls
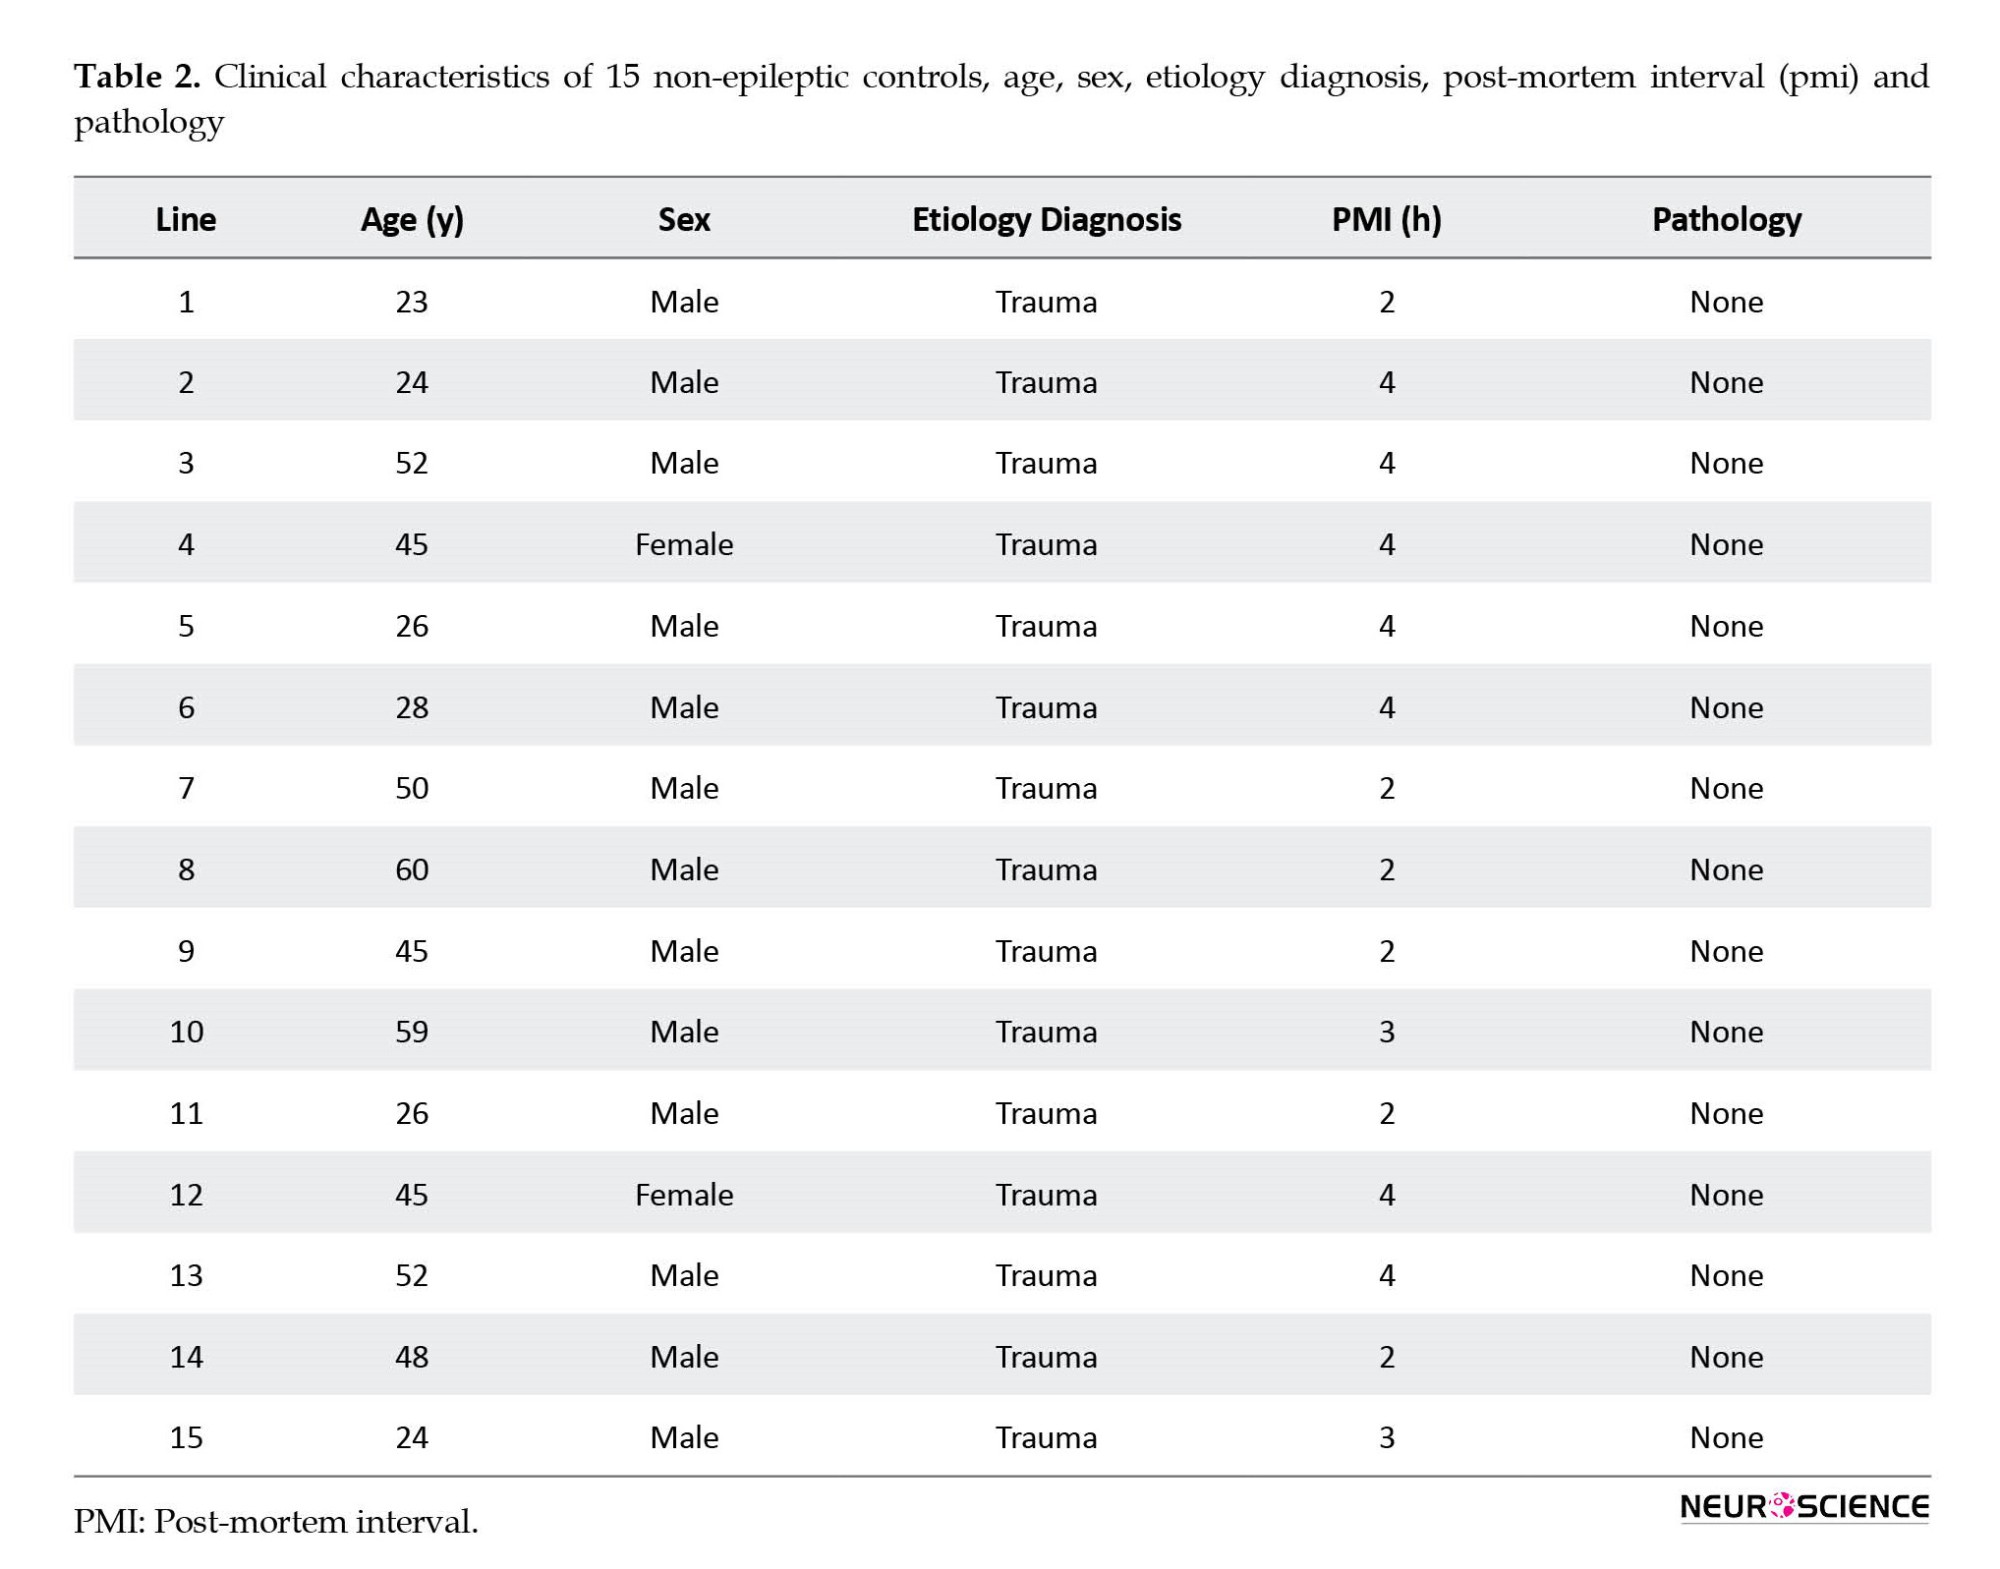
The hippocampal tissue taken from the autopsies (n=15) performed in the Department of Forensic Medicine of the Postgraduate Institute of Medical Education and Research was used as control tissue. Samples were collected from the autopsies performed within 4 hours after death with only non-neurological causes. Death due to non-neurological causes was considered for the study while patients with any severe head injury, hemorrhage, etc. were not included in the study. Table 2 presents clinical data.
Tissue was collected only after written informed consent from the relatives of patients and controls.
Processing of hippocampal tissue
Under sterile conditions, the collected tissue was immediately placed in the saline. The collected tissue was then divided into sections, one section was fixed in ribonucleic acid (RNA) later at -20ᴼC, one section was frozen at -80ᴼC and another section was fixed in 10% formalin overnight at room temperature.
In each case, a part of the fixed tissue was processed for histology. Using the standard procedure, hematoxylin and eosin staining was performed and the slides were then assessed by a histopathologist to identify HS.
Real-time polymerase chain reaction (RT-PCR)
The trizol method (Ambion) was used to isolate total RNA by taking an amount of 0.5-1 g of tissue kept in the RNA later. Spectrophotometric measurements (Biotek Epoch) were performed to assess RNA quality and quantity. The absorbance taken for measurements was at A260/A280. Complementary DNA (cDNA) was synthesized using a BioradiScript cDNA synthesis kit as per instructions. For RT-PCR, primers at 250 nM concentration were used–human MDR-1 forward 5’-TCAGCTGTTGTCTTTGGTGC-3’; reverse 5’-GGTCGGGTGGGATAGTTGAA-3’, human MRP-1 forward 5’-TTGGTGATATTCGCCATTGA-3’; reverse 5’-ACGCATAGTGGATGGCTTTC-3’, and human Glyceraldehyde 3-phosphate dehydrogenase (GAPDH) forward 5’-TGAACGGGAAGCTCACTGG-3’, reverse 5’-TCCACCACCCTGTTGCTGTA-3’. Evaluation of gene expression was performed using SYBR Green chemistry on ABi step one plus RT-PCR system. The data was standardized (Livak & Schmittgen, 2001; Schmittgen & Livak, 2008). The data was represented in the form of plots and a standard criterion was followed to describe the gene’s status whether up-regulated or down-regulated.
Western blot (WB)
Hippocampal tissue was properly thawed and washed with phosphate-buffered saline (PBS). Total proteins were extracted ice cold 1X RIPA lysis buffer. One mL of 1X RIPA lysis buffer was added along with 2 µL protease inhibitor (Sigma-Aldrich). The bicinchoninic acid (BCA) method was used to analyze protein concentration using the BCA kit (BioRad). After heating, the samples were resolved on sodium-dodecyl sulphate polyacrylamide gel using 4% stacking and 8% separating gel. Polyvinylidene difluoride (PVDF) membrane was used to blot the resolved proteins. The blocking was performed in the BSA at 25°C. Blotted PVDF membranes were incubated with specific primary antibodies overnight at 4°C, mouse monoclonal MDR-1 at a concentration of 1:200 (Santa-Cruz Biotech., sc-71557), mouse monoclonal MRP-1 at a concentration of 1:50 (Abcam, ab24102), and mouse monoclonal β-actin (an internal control) at a concentration of 1:5000 (Thermo fisher, M5A-15739). After proper washing with tris-buffered saline, 0.1% Tween 20 (TBST) buffer, blotted membranes were incubated with respective secondary antibodies at room temperature–rabbit anti-mouse (1:10,000, Abcam, ab97046). Enhanced chemiluminescence (ECL) kit (BioRad) was used to visualize blotted membranes. To interpret data, ImageJ Plus software was used for the densitometry analysis.
Immunohistochemistry (IHC)
Immunohistochemical analysis was performed to confirm RT-PCR and WB results by evaluating the protein localization and expression. After processing with standard protocol, 5 µm thick sections were taken on poly-L-lysine coated slides. Deparaffinization was done in xylene (three 10-minute changes) followed by hydration of sections through graded alcohols (absolute or 100% ethanol, 70% ethanol, 50% ethanol, and distilled water for 5 minutes each). Hydrogen peroxide and deionized water in a ratio of 1:9 were used for endogenous blocking by incubating sections for 10-15 minutes. Antigen retrieval was performed using tris-ethylenediaminetetraacetic acid (EDTA) buffer at pH 9.0 to increase the immunogenicity. The sections were placed in an incubator at 55°C for 4-8 hours. Incubation with primary antibodies-mouse monoclonal MDR-1 (1:200, Santa-Cruz Biotech., sc-71557) and mouse monoclonal MRP-1 (1:20, Abcam, ab24102) was performed by an overnight incubation at 4°C. Primary antibody was omitted in the negative control. Horseradish peroxidase (HRP)-conjugated rabbit anti-mouse secondary antibody (1:2000, Abcam, ab97046) was used at room temperature. A total of 0.5% 3, 3’-diaminobenzidine was used to develop peroxidase activity. Hematoxylin was used as a counterstain. The slides were properly cleaned and coverslipped after mounting with di-n-butyl phthalate. The observation was done under a light microscope by two unbiased observers.
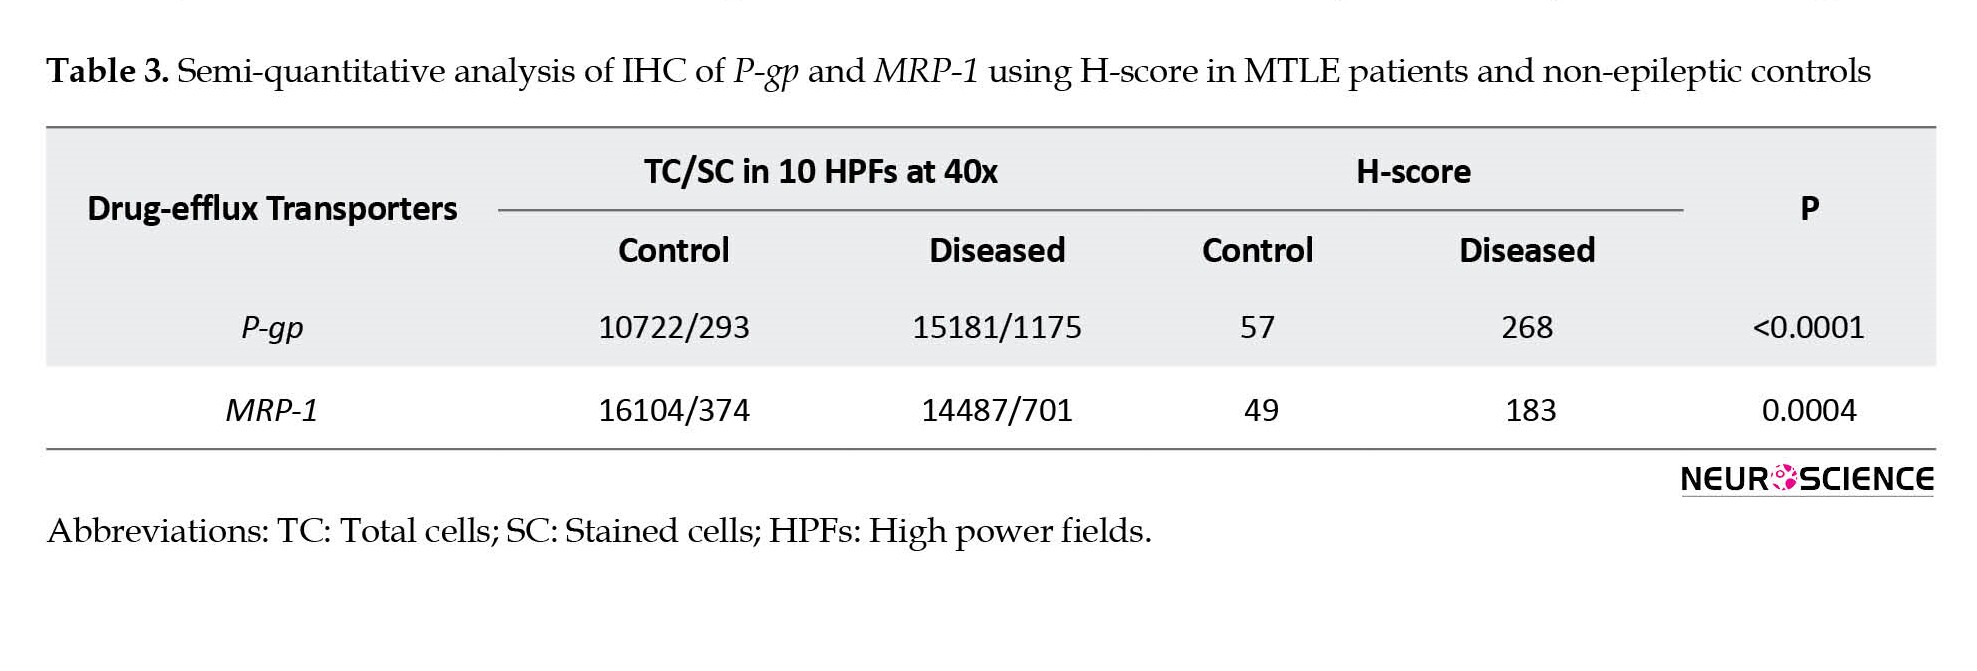
Semi-quantitative analysis of immunohistochemistry (IHC) using histo (H)-score
The cells with clearly outlined nuclei were observed and counted in 10 random fields of view in each section of the patient (n=15) and non-epileptic control (n=15) at scale bars 100 µm for the detailed analysis. Histo-score (H-score) was calculated using the Equation 1:
1. H-score=(1×[% Cells with 1+]+2×[% Cells with 2+] +3×[% Cells with 3+])
Where 1+, 2+ and 3+ are the intensity scores of immunostaining according to the appearance (Cheon et al., 2001).
Each section was examined under a light microscope by two unbiased observers in a blinded manner. It was calculated in the 10 high power fields in the section and the average was taken as H-score. Based on the H-score, the immunoreactivity (IR) was categorized as mild (<50), moderate (50-100), or strong (>150). The selected sections were photographed using an Olympus microscope with ProgRes® Capture Pro software, version 2.9.01.
Immunofluorescence
For immunolabelling, tissues were processed with standard protocol. Sections with a thickness of 5 µm were taken on poly-L-lysine coated slides. Deparaffinization was performed in xylene (three 10-minute changes) followed by hydration of sections through graded alcohols (absolute or 100% ethanol, 70% ethanol, and 50% ethanol for 5 minutes each). The tissue sections were then washed in the running water (deionized) for one minute. After PBS rinsing, antigen retrieval was done to increase the immunogenicity using tris-EDTA buffer at pH 6.1 in the oven for 12 minutes. The slides were incubated with two different primary antibodies (used in IHC) mixed in the immunofluorescence (IF) buffer and incubated at room temperature for one hour. Antibody binding was observed by incubation with appropriate Alexa Flour (647-red) anti-mouse conjugated secondary antibodies (Thermo-fisher Scientific A21235, dilution 2 µ/mL) diluted in the immunofluorescence buffer in a dark for one hour. After washing 2-3 times with PBS, the slides were counterstained with 60 µL 4′,6-diamidino-2-phenylindole (DAPI) and mounted using glycerol. Slides were stored in the dark by covering them with aluminum foil at 4˚C before analysis using a confocal immunofluorescence microscope (Evos FL auto BX53). All the samples were processed on the same day to avoid confounding with the quantification. Fluorescence of cells and images were determined at scale bars 100 µm using the ImageJ plus software. The color channels were split by selecting the image. After making the composite and splitting the different channels, the images were stacked. An image montage was created as displayed images. For densitometric analysis, z-stacks of the photographed images were converted to grayscale. Signal intensity was quantified as integrated density by simply marking a circle around the cell. For further analysis, the mean gray value, and integrated density were calculated. Corrected total cell fluorescence (CTCF) was interpreted using the Equation 2:
2. CTCF=Integrated density (Measured area of the selected cell×Mean fluorescence of background)
Background signals were measured in signal-free areas.
Statistical analysis
The software used for data analysis and graph preparation was GraphPad Prism software, version 8 and SPSS software, version 23. Statistical significance was determined using the student’s t-test comparing control versus patients. Mean±SD, Mean±SE, and the range were calculated for age, onset age of seizure, epilepsy duration, and seizure frequency. The drug-efflux transporters, P-gp and MRP-1 were correlated with the duration of epilepsy, duration of drug resistance, and seizure frequency. Correlation was determined by calculating Spearman’s rank correlation coefficient, ρ. P≤0.05 was considered significant. Unpaired student’s t-test was applied to determine any significant difference in H-score and of immunofluorescence (CTCF values), between MTLE cases and non-epileptic controls.
3. Results
Clinical data
Tables 1 and 2 present the clinical and demographic data of the patients and controls. In the patient group (9 men and 6 women), the mean age of the patients was 29.27±10.12 years, the onset age of seizures was 12.13±6.26 years, the duration of epilepsy was 15.13±10.70 years and seizure frequency was 8.60±5.86 month. The whole data of patients are expressed compared to the age-matched controls. In the non-epileptic control group (13 men and 2 women), the mean age of the controls was 40.47±13.68 years.
Expression of transcripts of P-gp and MRP-1 genes in hippocampal tissue
Figure 1 (a-d) shows relative messenger ribonucleic acid (mRNA) levels of P-gp and MRP-1 genes of drug-resistant MTLE patients and non-epileptic controls. Both P-gp and MRP-1 were detected in the hippocampal tissue. It has been observed that mRNA levels of P-gp and MRP-1 were higher in the patient tissues compared to the control tissues (Figure 1b and 1d). The Mean±SD (ΔCt value) of the patient group was 10.12±5.47 and for the control group was 0.51±0.73 for P-gp. And Mean±SD (ΔCt) of the patient group was 2.99±2.40 and for the control group was 0.97±0.69 for MRP-1. The fold change was calculated for each patient (n=15), 66% of the patients showed overexpression of P-gp. Eleven out of Fifteen patients showed overexpression of MRP-1 (Figure 1a and 1c). Elevated levels of P-gp and MRP-1 in the patients were between 4-6 folds compared to the controls. The results were statistically significant for P-gp (P<0.0001) and MRP-1 (P=0.01). Fold change seen for P-gp in the MTLE patients was more pronounced than MRP-1.

Expression and localization of P-gp and MRP-1 proteins in hippocampal tissue
WB analysis further revealed increased protein expression of both P-gp and MRP-1 with an apparent molecular weight of 170 and 172 kDa, respectively in the patients and controls using sc-71557 and ab24102 antibodies (Figure 1e). The densitometric analysis showed that the results using β-actin as standard were statistically significant (Figure 1f). The Mean±SD of the ratio of the area was 0.60±0.02 in the patients and 0.42±0.08 in the controls for P-gp (P=0.006) and 0.67±0.04 in the patients and 0.36±0.04 in the controls for MRP-1 (P<0.001).
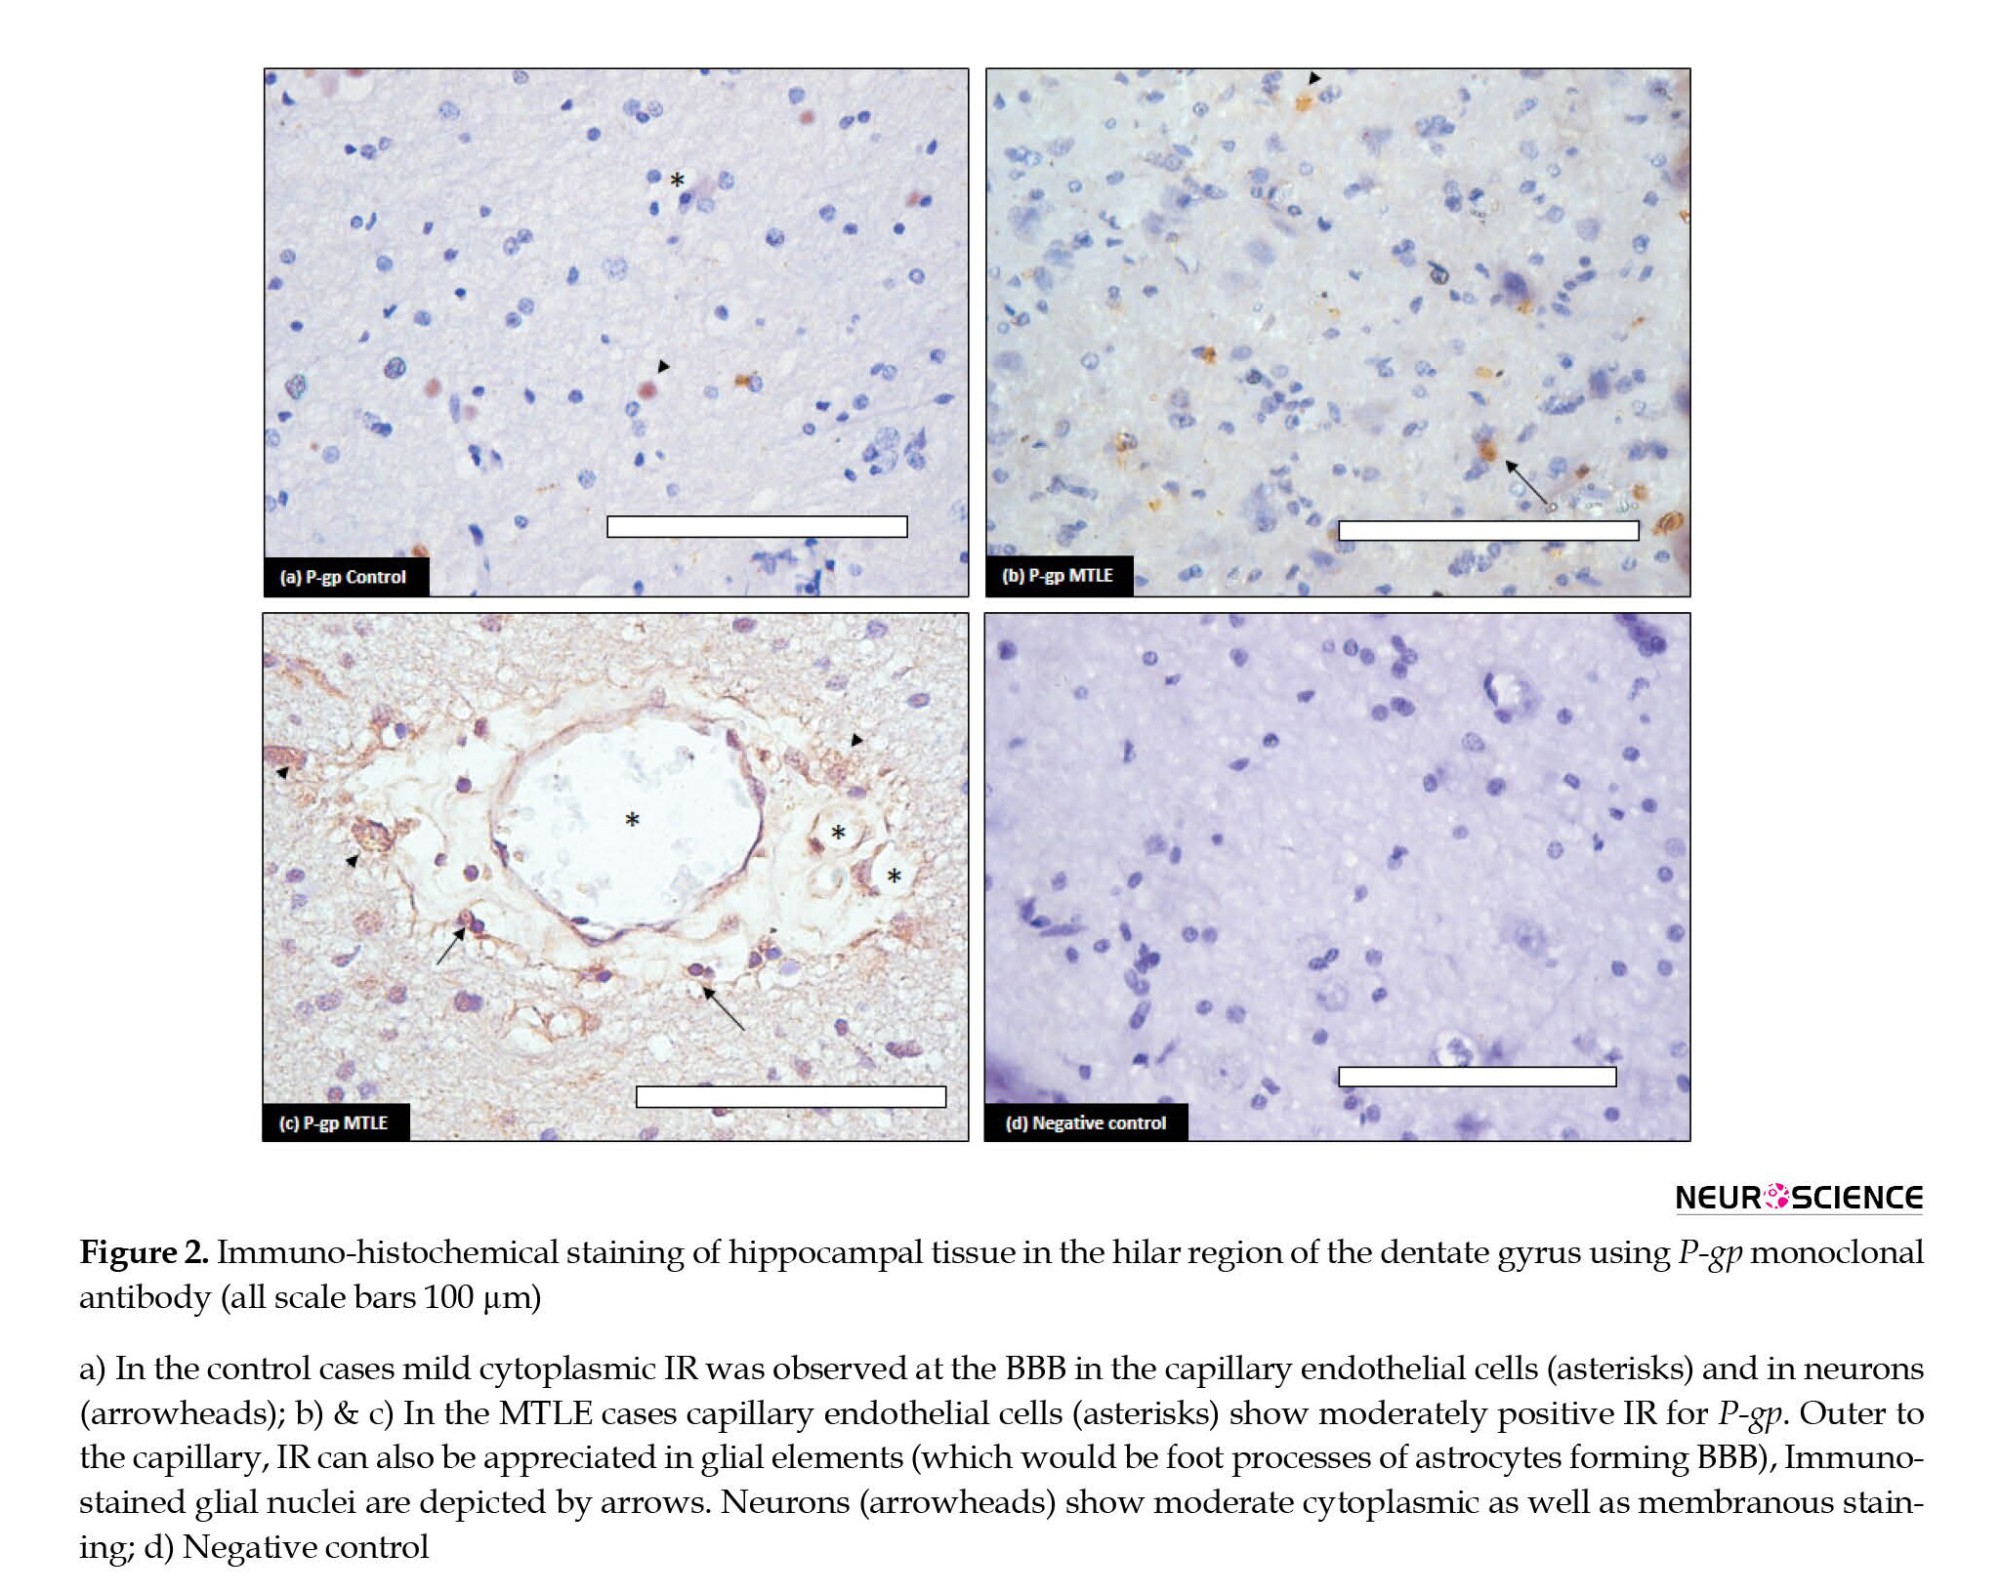
The cellular localization of P-gp and MRP-1 was determined by immunohistochemistry using the same antibodies. The results demonstrated that these proteins were present in both diseased and control tissues. P-gp showed increased immunostaining in the MTLE patients compared to the controls (Figure 2). In the diseased patients, the IR was moderate to strong. Maximum staining was observed at the BBB (Figure 2b and 2c). The endothelial cells in blood vessels demonstrated cytoplasmic as well as membranous staining. The neuropil surrounding the capillaries depicted moderate immunostaining; it includes foot processes in astrocytes. Moderate to severe intensity cytoplasmic IR was also observed in the glial cells (Figure 2c). In addition, moderate IR was displayed by neurons; it was punctate in pattern and cytoplasmic as well as membranous in location. In the controls, mild IR was observed in endothelial cells of the capillaries at the BBB. Very mild cytoplasmic IR was also observed in the neurons (Figure 2a). No immunostaining glial cells were found in the control cases.
Immunohistochemical analysis of MRP-1 was performed and increased expression was observed in the MTLE cases compared to the non-epileptic controls (Figure 3). In the MTLE patients, IR was cytoplasmic in glial cells. Some neurons were also immunopositive (Figure 3a). In the control group, mild IR was observed in neurons and glial cells (Figure 3b).
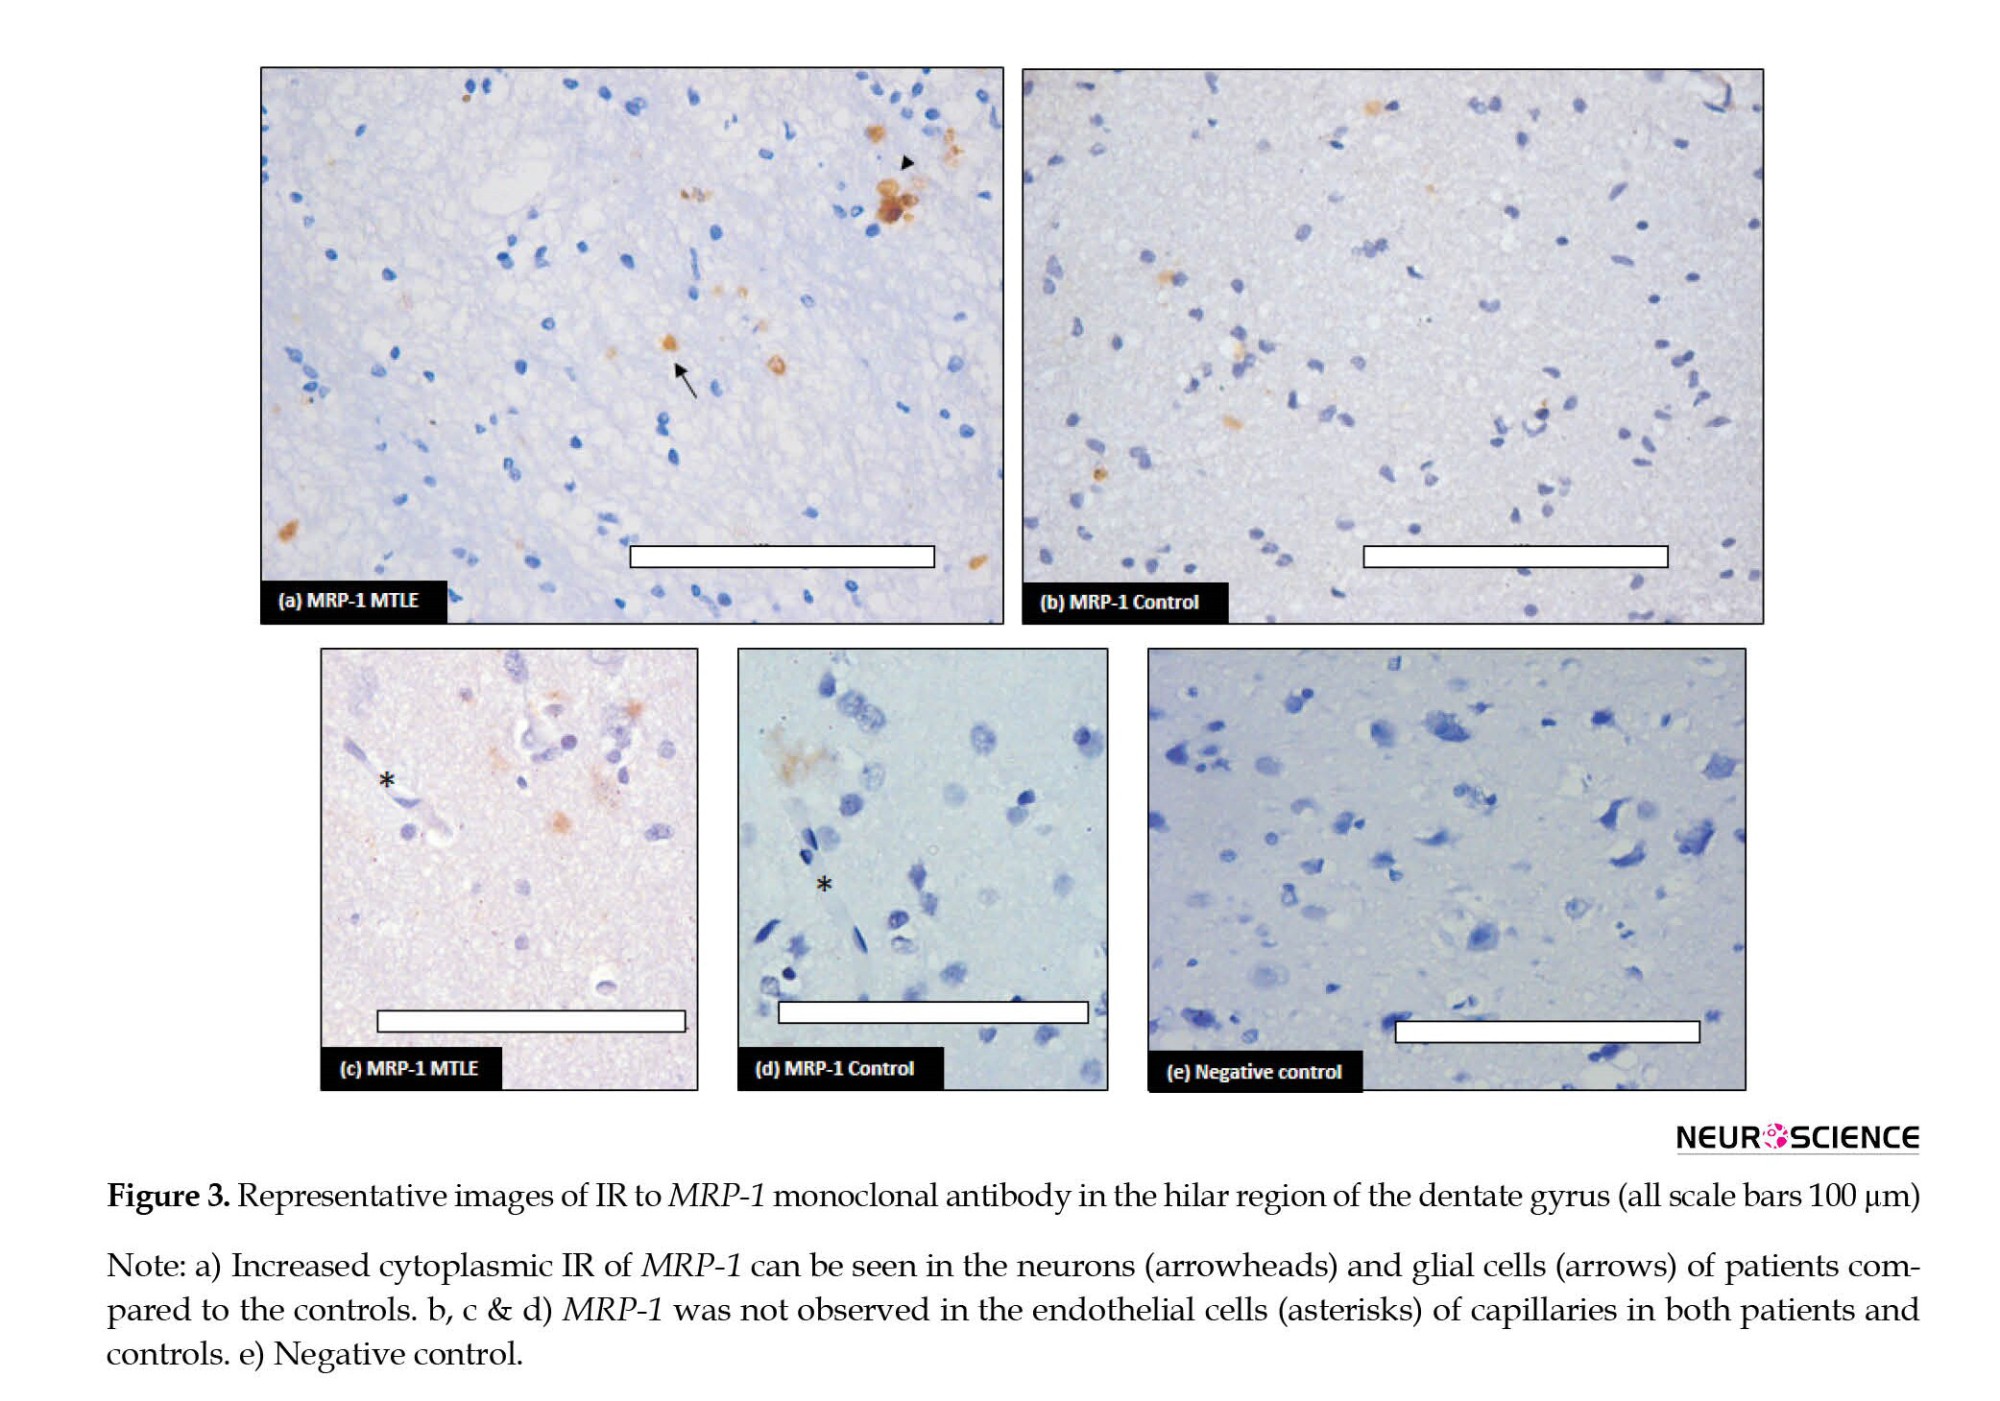
In the vessel, stained endothelial cells were observed neither in patients nor in controls (Figure 3c and 3d). Semi-quantitative analysis by H-score also confirmed the IHC results (Table 3).
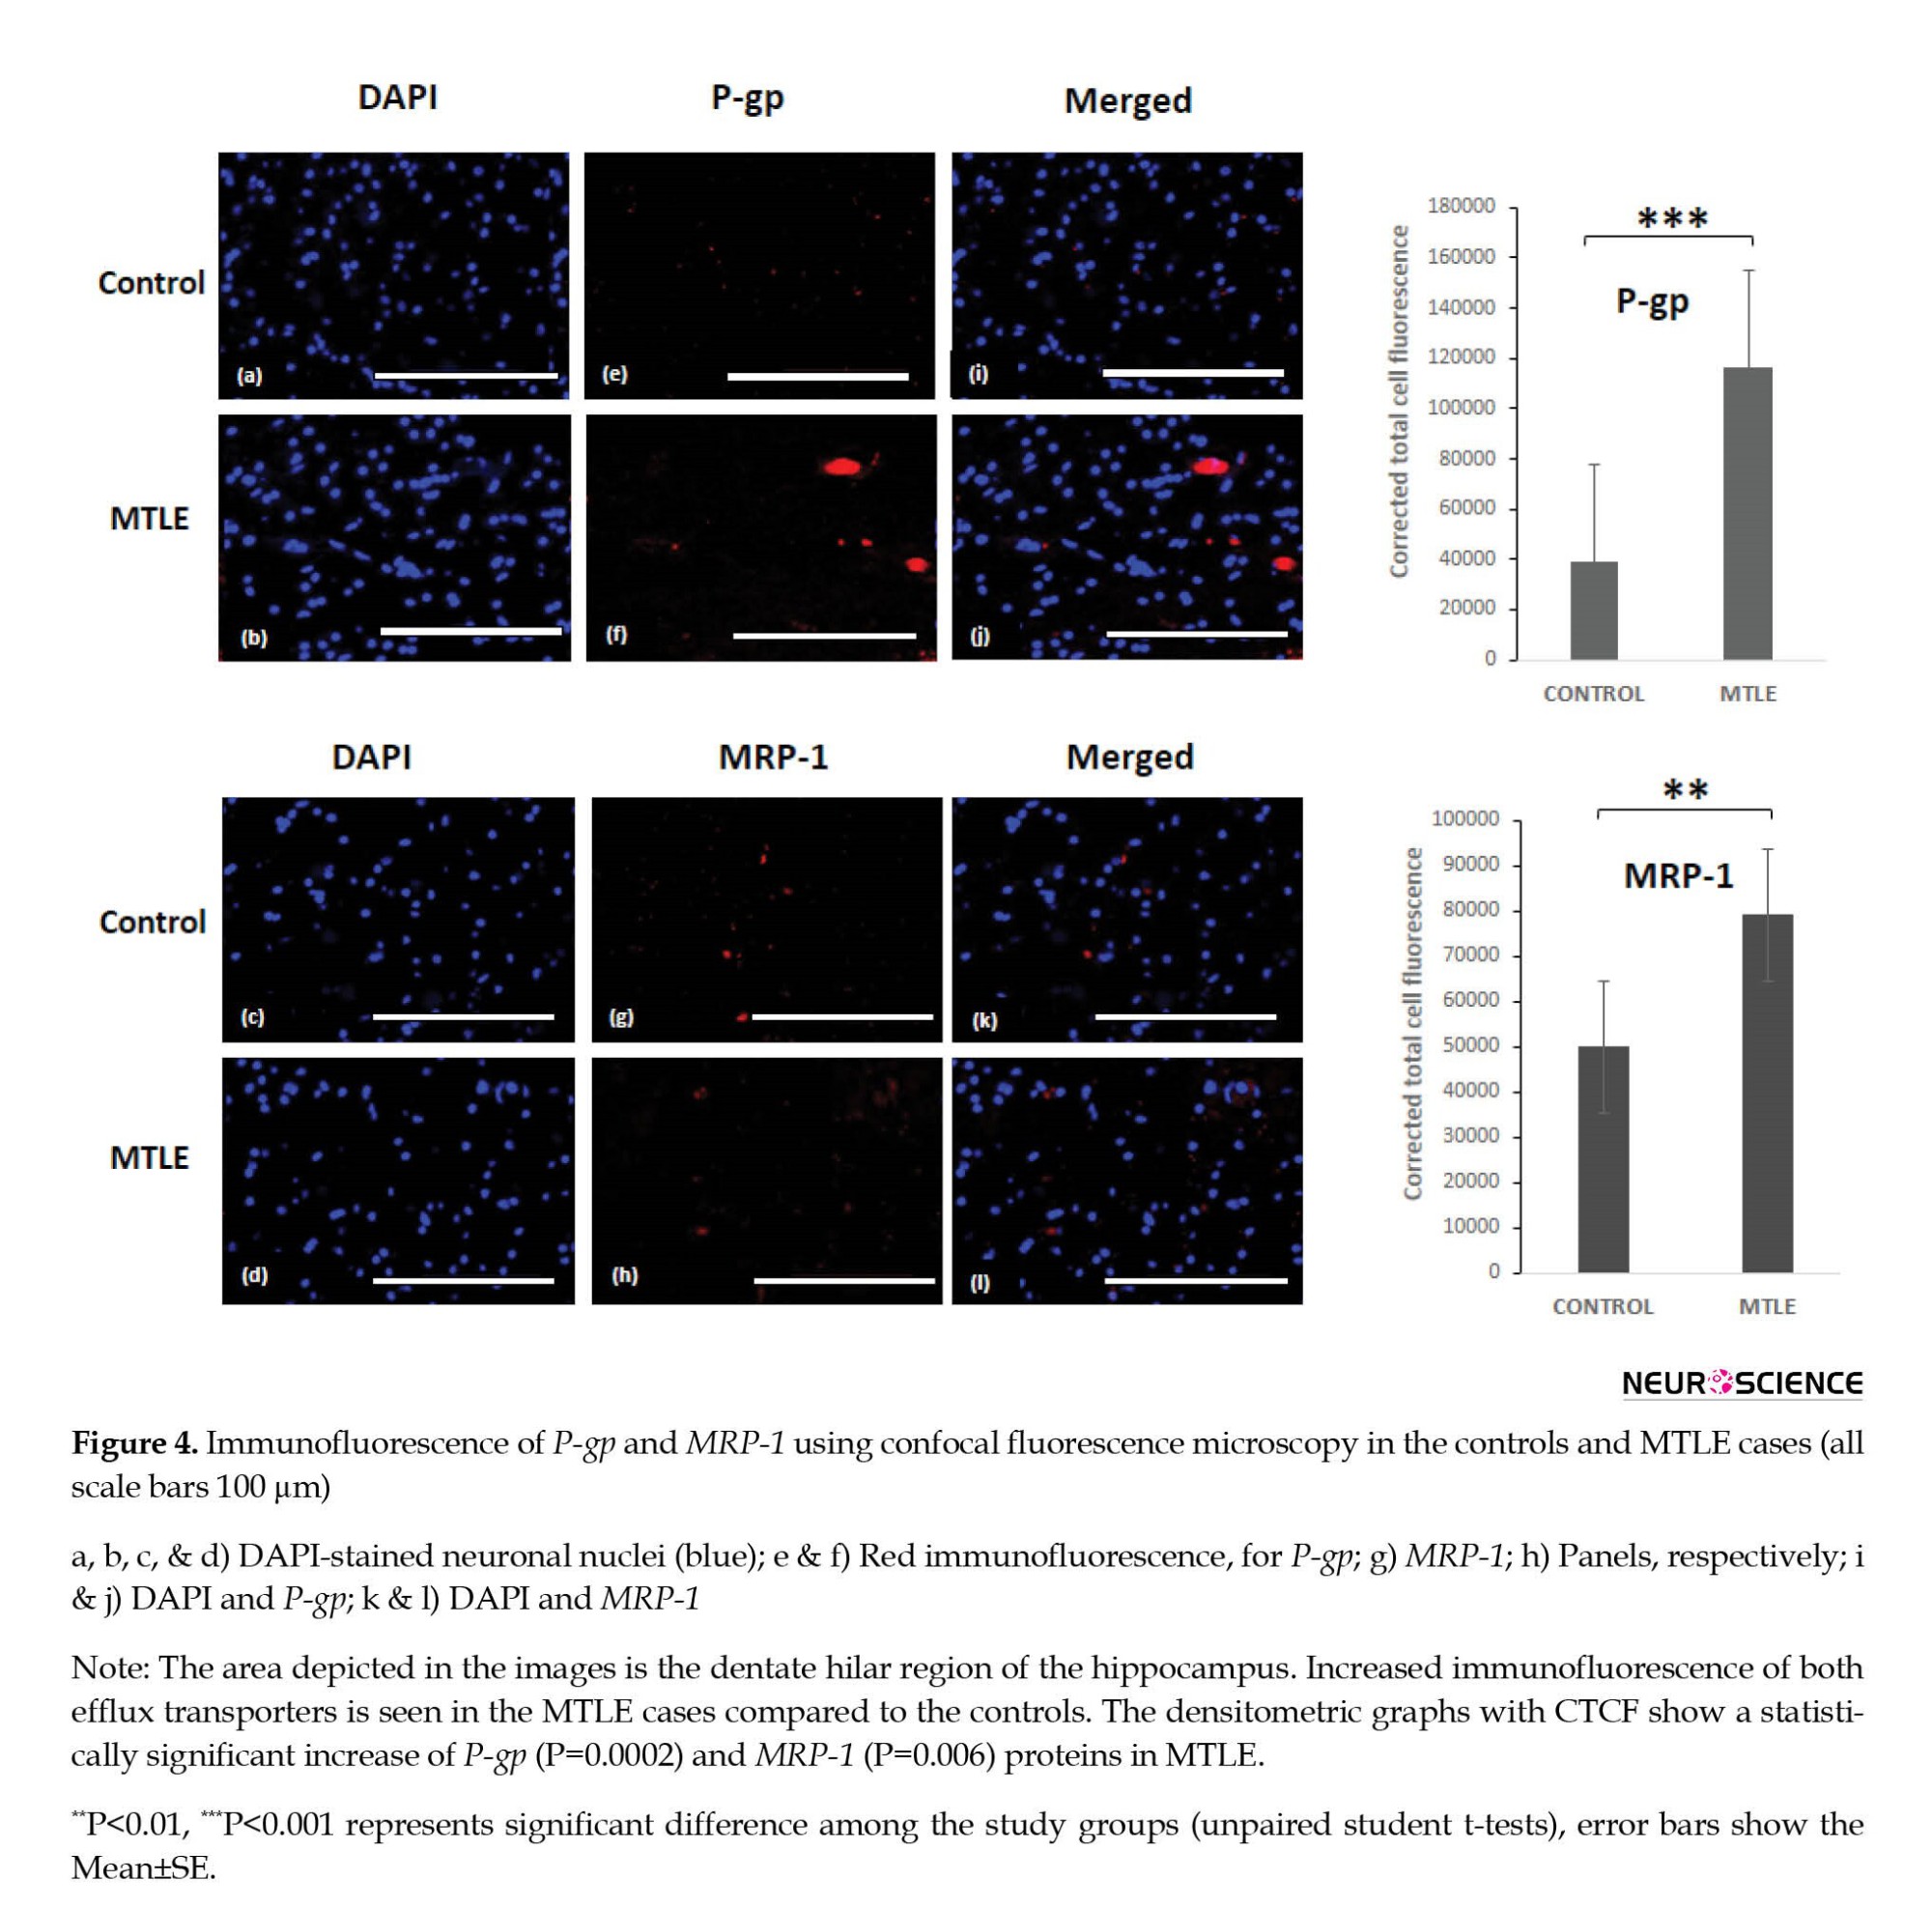
Further, immunofluorescence of P-gp and MRP-1 was checked in the MTLE and non-epileptic control tissue. Immunofluorescence staining confirmed the expression of P-gp and MRP-1 in the hilar region of the dentate gyrus. The immunofluorescence images labeled with P-gp (red) and MRP-1 (red) only described the presence or absence of particular protein along with nuclear dye 4′,6-diamidino-2-phenylindole (DAPI) (blue) in patients and controls. Increased immunofluorescence was observed in the MTLE cases for both the efflux transporters (Figure 4). The results were statistically significant for P-gp. The Mean±SE was 116293±11698 in the MTLE cases and 38887±2583 in the controls with a P 0.0002. The Mean±SE for MRP-1 was 79172±5032 in the MTLE cases and 49942±6304 in the controls with a P=0.006, which was statistically significant. The number of positive cells for P-gp showed a significant difference in patients and controls, while positive cells in the case of MRP-1 were significant but not significantly different between patients and controls.
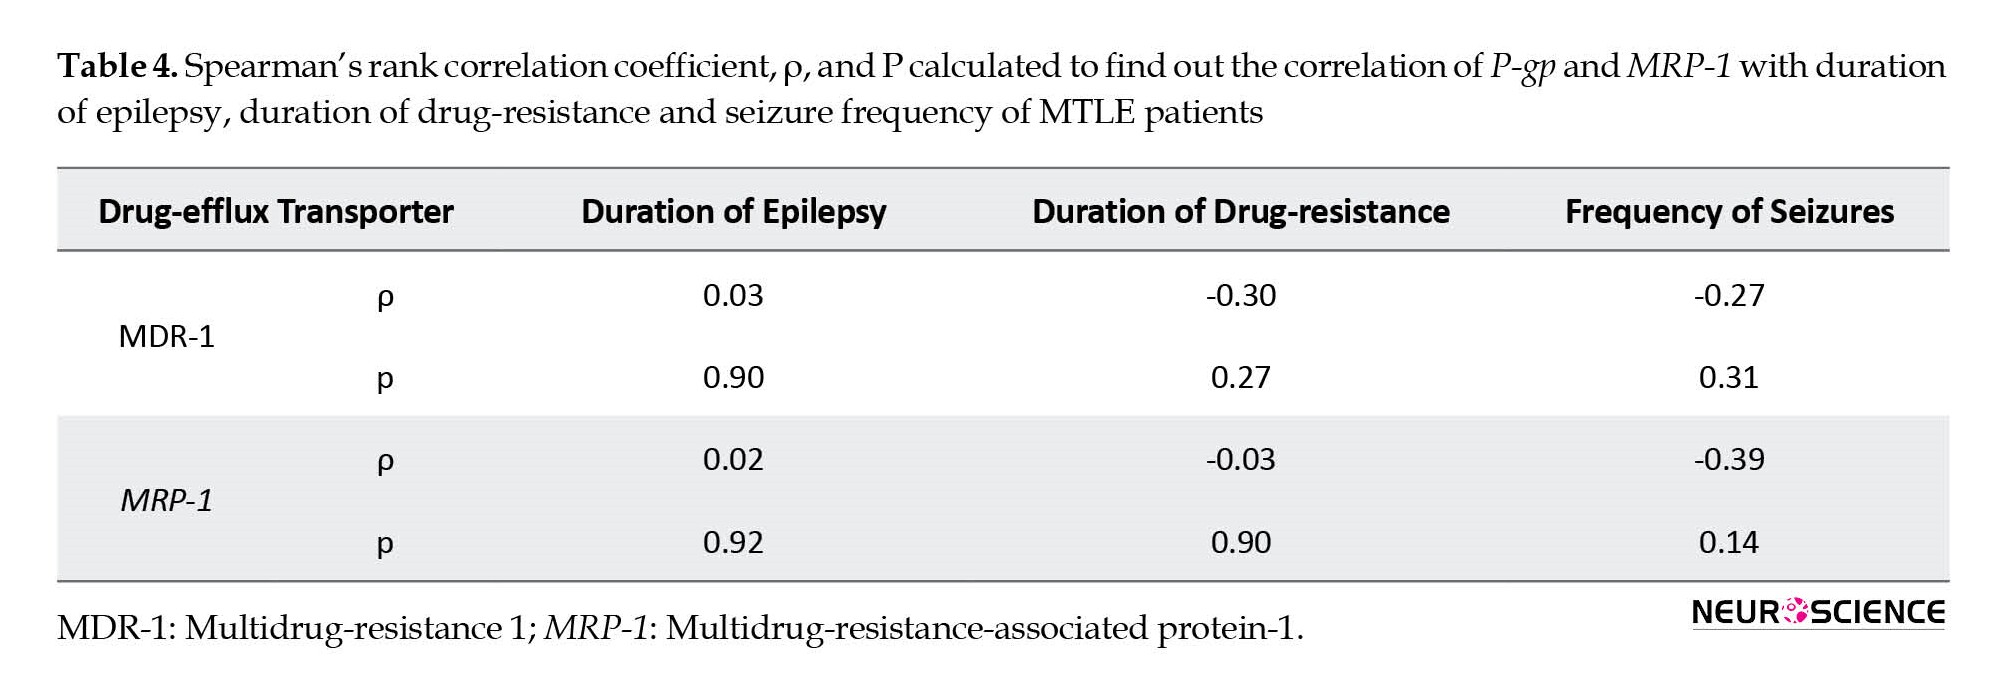
Correlation of disease parameters with P-gp and MRP-1
There may be a possibility of a relationship between drug-efflux transporters and the disease parameters of epilepsy. We tried to find any relation between increased expression of drug-efflux transporters and different disease parameters. We correlated the expression pattern of P-gp and MRP-1 with the duration of epilepsy, duration of drug resistance, and frequency of seizures using Spearman’s rank correlation. P-gp or MRP-1 showed no correlation with any of the described parameters (Table 4).
4. Discussion
Drug efflux transporters are crucial for the maintenance of homeostasis in the brain in a physiological state. Pathological conditions, such as epilepsy seem to increase the activity of xenobiotic efflux manyfold. Thus, efflux transporters become a critical determinant of drug distribution within the central nervous system (CNS). We have investigated the expression pattern of drug efflux transporters P-gp and MRP-1 in the tissue resected from multidrug-resistant MTLE patients and compared it with non-epileptic controls. We have found statistically increased gene expression profiles for both the efflux transporters in patients. Similar results were obtained in the protein analysis. Immunohistochemical and immunofluorescent studies have provided histological as well as cellular localization of these increased efflux transporters in hippocampal tissue in drug-resistant MTLE.
Drug resistance has been observed in about 1/3rd of the total patients treated with different AEDs. One of the most resistant forms of epilepsy in humans is MTLE with HS (Pohlen et al., 2017). Therefore, we only incorporated patients with confirmed HS in the present study. About 30%–50% of epileptic patients are resistant to the present treatments, which is associated with a five-fold death rate compared to the population (Sharma et al., 2015). The removal of epileptic tissue with surgery remains the only solution for drug-resistant patients (Bergey et al., 2017), but even then seizure freedom was attained for at least 1 year in only 50%-80% of cases (Spencer & Huh, 2008). Overexpression of the drug-efflux transporters was first described for multi-drug resistant cancer cells. Overexpression of transporters was also found in capillary endothelial cells of brain tissue obtained from patients with resistant epilepsy. Various studies explain the involvement of ABC efflux transporters in drug-resistance MTLE; the vital transporters are P-gp and MRP-1 (Aronica et al., 2004; Dombrowski et al., 2001; Kubota et al., 2006; Sisodiya et al., 2002; Sisodiya et al., 2006; Tishler et al., 1995; Weidner et al., 2018). Both efflux transporters maintain the stability of the internal environment by extruding the xenobiotics in physiological conditions. The expression pattern of these transporters changes from physiological to pathological states. In pathological conditions, drug efflux leads to suboptimal concentrations of drugs at the target site, causing multidrug resistance.
P-gp or MDR-1 is an ATP-binding cassette subfamily B member 1 (ABCB1). It is encoded by the MDR1 (ABCB1) gene in humans located at chromosomal region 7q21 (Potschka et al., 2001). This is a single-stranded transmembrane glycoprotein composed of 1 280 amino acids. Various barrier and excretory tissues express P-gp. P-gp delivers hydrophobic and amphipathic molecules of cells or membranes by active transport from inside to outside. This physiological function of expelling xenobiotics of extensive molecular variability is considered the critical defense mechanism that protects the internal brain milieu. Under physiological conditions, P-gp is expressed in the luminal membrane of the brain capillary endothelial cells and in the astrocyte foot processes surrounding the capillaries that constitute the BBB. Its expression is slightly evident in neurons or glial cells. In pathological conditions, such as epilepsy, stroke, etc. biochemical cues from the variations in the internal environment of the brain lead to increased expression of P-gp (Miller et al., 2008). In the diseased state, P-gp is not only highly expressed in endothelial cells but also the brain parenchyma (D’GIANO, 1997). In our results, we have found over-expression of P-gp in the endothelial cells of the blood vessels as well as in the hippocampal neurons (Figure 2b and 2c). In animal tissue, it has been found that under physiological conditions, the MDR1 gene expression is limited to capillary endothelial cells and astrocytes around capillaries. However, after epileptic seizures, P-gp is also expressed in the astrocytes and neurons in the parenchyma. Therefore, there is not only an increase in the expression level of the P-gp but also the number of sites that express these transporters (Volk et al., 2005). According to our results, the mRNA expression of the gene (MDR-1) increased five folds in MTLE patients compared to the non-epileptic controls in the present study. Similarly, on WB, P-gp levels were also significantly raised in the patient group.
MRP-1 is a specific organic anion transporter. This is composed of 1 531 amino acids and is encoded by the ABCC gene located at chromosomal region 16p31.1. It is distributed in the kidneys, liver, lungs, testes, and peripheral blood mononuclear cells. In the brain, MRP-1 is distributed in the choroid plexus epithelium and ependymal epithelium cells of BCB. These cells prevent the entry of harmful substances or drugs into brain tissue (Sodani et al., 2012). Sisodiya et al. found increased expression of MRP-1 in samples collected from epileptic patients (Sisodiya et al., 2002). In the present study, we have also found that the MRP-1 gene was over-expressed in the epileptic brains and also translated into much higher MRP proteins. Over-expression of MRP-1 has been reported but conflicting reports exist on its location in the nervous system. In the normal brain, the expression of MRP-1 in the neurons and glial cells has not been constantly stated in the literature (Ashraf et al., 2014). However, in the present study, MRP-1 IR was detected in both neurons and glial cells in control tissue, though it was mild compared to the IR seen in the epileptic tissue. Vliet et al have reported MRP-1 expression in endothelial cells of the capillaries in hippocampal tissue from chronic epilepsy (Van Vliet et al., 2005). Contrary to this, in the present study, MRP-1 immuno-positivity was not observed in endothelial cells of capillaries in either control or diseased tissues (Figure 3 a-d). Similar to our results, a consistent MRP-1 overexpression in the parenchyma (neurons and astrocytes) not in endothelial cells in epileptic tissue has been reported by various studies (Chen et al., 2013; Kubota et al., 2006; Yi, 2012). Decleves et al. have also reported higher expression of MRP-1 in cultured astrocytes compared to cultured endothelial cells (Decleves et al., 2000). This suggests that the efflux mechanism is also at work within the brain parenchyma in neurons and glial cells, and this becomes overactive in the resistant cases, preventing the AEDs from achieving clinically effective concentration at the target site.
Various animal trials have shown genetic as well as protein overexpression of both efflux transporter i.e. P-gp and MRP-1, in the epileptic brain tissue (Kuteykin‐Teplyakov et al., 2009; Rizzi et al., 2002; Seegers et al ., 2002; Volk et al., 2005; Volk et al., 2004). In our study, we have observed similar up-regulation at genetic as well as protein levels for both the transporters. Jinming et al. investigated the expression levels of P-gp and MRP-1 in the peripheral blood of patients with epilepsy and found them increased in the drug-resistant patients compared to the patients responding to AEDs (Jinming et al., 2018). A positron emission tomography (PET) study reported that increased P-gp function in the temporal lobe of patients with drug-resistant TLE reverted to normal after epilepsy surgery; it was observed only in patients who responded to the surgery but not in patients having non-satisfactory surgical outcome (Bauer et al., 2014). It has been suggested that overexpression and increased activity of active efflux mechanisms in epileptic brains play a significant role in the therapeutic failure of pharmacological treatment of AEDs. Our results are consistent with these studies. In the present study, the quantum of increase was more for P-gp than MRP-1, which may indicate that P-gp plays a greater role in causing drug resistance in MTLE.
Conflicting reports exist in the literature regarding the status of P-gp and MDR-1 after acute epilepsy. Few studies have reported increased mRNA expression for P-gp after 3-48 hours of seizure episode, returning to normal within 72 hours to 2 weeks (Rizzi et al., 2002). On the other hand, Kuteykin-Teplyakov et al found that after 6-24 hours of status epilepticus in rats, P-gp and MRP-1 mRNA expression was decreased in the hippocampus, followed by increased expression after two days (Kuteykin‐Teplyakov et al., 2009). The results of these studies show that up-regulation of P-gp and MRP-1 is a temporary phenomenon in the early stage of epilepsy. We have used the hippocampal tissues from long-standing drug-resistant MTLE patients and have consistently found higher levels of both efflux transporters at genetic and protein levels. Therefore, long-term recurrent seizures may lead to permanent genetic up-regulation of the efflux transporters. We correlated P-gp and MRP1 expression profiles with duration of epilepsy, duration of drug-resistance, and frequency of seizures of all the patients, to detect any trend describing the drug-resistance pattern. We found no correlation between any of these parameters with P-gp or MRP-1.
5. Conclusion
Drug resistance is common in MTLE and results in severe morbidity and mortality. We studied the expression pattern of P-gp and MRP-1 in MTLE cases compared to age-matched non-epileptic controls. The tissue location for these transporters was found using monoclonal antibodies. These results show that P-gp and MRP-1 are crucial determinants of bioavailability and tissue distribution of AEDs in the brain. According to our study, P-gp and MRP-1 are overexpressed in most cases of the MTLE. This was confirmed at both genetic as well as protein levels. In MTLE patients, overexpression of P-gp was more pronounced than that of MRP-1. Drug efflux transporters act at brain barriers as well as within the brain parenchyma. The increase in efflux transporters levels can be pharmacologically inhibited to achieve optimal drug penetration to target sites in refractory MTLE and avoid surgery for seizure control.
Limitations
It is still not clear whether overexpression of efflux transporters is intrinsic (present before the onset of epilepsy) or acquired i.e. the result of epilepsy, uncontrolled epileptic seizures, treatment with different AEDs, or a combination of these factors. Moreover, only P-gp and MRP-1 were studied in resistance mechanisms; other drug efflux transporters should also be studied. We only focused on the theory of multidrug resistance due to over-expression of transporters; transporter and target mechanisms may overlap in some patients.
Ethical Considerations
Compliance with ethical guidelines
Ethical approval for the study was taken before tissue collection from the Institutional Ethic Committee, Post Graduate Institute of Medical Education and Research. Informed consent was obtained from all individuals and from the relatives of deceased included in the study.
Funding
This work was supported by the Intramural grant under Institute Research Scheme, by Postgraduate Institute of Medical Education and Research (Code: 71/8-Edu-15/694, dated 27/04/2016).
Authors' contributions
Conceptualization: Mandeep Kaur and Tulika Gupta; Methodology: Mandeep Kaur and Mili Gupta; Investigation: Navneet Singla, Yogender S Bansal, Bishan Das Radotra and Parampreet S Kharbanda; Writing original draft: Mandeep Kaur; Review & editing: Tulika Gupta; Funding acquisition: Tulika Gupta; Resources: Tulika Gupta and Daisy Sahni; Supervision: Daisy Sahni and Sunil Kumar Gupta.
Conflict of interest
The authors declared no conflict of interest.
Acknowledgments
The authors are thankful for funding to Council of Scientific & Industrial Research, for senior research fellowship to Mandeep Kaur.
References
Aronica, E., Gorter, J. A., Ramkema, M., Redeker, S., Ozbas-Gerçeker, F., & Van Vliet, E. A., et al. (2004). Expression and cellular distribution of multidrug resistance-related proteins in the hippocampus of patients with mesial temporal lobe epilepsy. Epilepsia, 45(5), 441-451. [DOI:10.1111/j.0013-9580.2004.57703.x] [PMID]
Ashraf, T., Kao, A., & Bendayan, R. (2014). Functional expression of drug transporters in glial cells: Potential role on drug delivery to the CNS. Advances in Pharmacology, 71, 45-111. [DOI:10.1016/bs.apha.2014.06.010] [PMID]
Bauer, M., Karch, R., Zeitlinger, M., Liu, J., Koepp, M. J., & Asselin, M. C., et al. (2014). In vivo P-glycoprotein function before and after epilepsy surgery. Neurology, 83(15), 1326-1331. [DOI:10.1212/WNL.0000000000000858] [PMID]
Bergey, G. K. (2013). Neurostimulation in the treatment of epilepsy. Experimental Neurology, 244, 87-95. [DOI:10.1016/j.expneurol.2013.04.004] [PMID]
Burtscher, J., & Schwarzer, C. (2017). The opioid system in temporal lobe epilepsy: Functional role and therapeutic potential. Frontiers in Molecular Neuroscience, 10, 245. [DOI:10.3389/fnmol.2017.00245] [PMID]
Chen, Y. H., Wang, C. C., Xiao, X., Wei, L., & Xu, G. (2013). Multidrug resistance-associated protein 1 decreases the concentrations of antiepileptic drugs in cortical extracellular fluid in amygdale kindling rats. Acta Pharmacologica Sinica, 34(4), 473-479. [PMID]
Cheon, K. W., Lee, H. S., Parhar, I. S., & Kang, I. S. (2001). Expression of the second isoform of gonadotrophin-releasing hormone (GnRH-II) in human endometrium throughout the menstrual cycle. Molecular Human Reproduction, 7(5), 447-452. [DOI:10.1093/molehr/7.5.447] [PMID]
D’GIANO, C. (1997). Expression of P-glycoprotein and related proteins in brain of patients with refractory temporal-lobe epilepsy (TLE). Epilepsia, 38(8), 87. [Link]
de Klerk, O. L., Willemsen, A. T., Bosker, F. J., Bartels, A. L., Hendrikse, N. H., & den Boer, J. A., et al. (2010). Regional increase in P-glycoprotein function in the blood-brain barrier of patients with chronic schizophrenia: A PET study with [11C] verapamil as a probe for P-glycoprotein function. Psychiatry Research, 183(2), 151-156. [DOI:10.1016/j.pscychresns.2010.05.002] [PMID]
Declèves, X., Regina, A., Laplanche, J. L., Roux, F., Boval, B., & Launay, J. M., et al. (2000). Functional expression of P‐glycoprotein and multidrug resistance‐associated protein (Mrp1) in primary cultures of rat astrocytes. Journal of Neuroscience Research, 60(5), 594-601. [PMID]
Dombrowski, S. M., Desai, S. Y., Marroni, M., Cucullo, L., Goodrich, K., & Bingaman, W., et al. (2001). Overexpression of multiple drug resistance genes in endothelial cells from patients with refractory epilepsy. Epilepsia, 42(12), 1501-1506. [DOI:10.1046/j.1528-1157.2001.12301.x] [PMID]
Feldmann, M., Asselin, M. C., Liu, J., Wang, S., McMahon, A., & Anton-Rodriguez, J., et al. (2013). P-glycoprotein expression and function in patients with temporal lobe epilepsy: A case-control study. The Lancet Neurology, 12(8), 777-785. [DOI:10.1016/S1474-4422(13)70109-1] [PMID]
Ginguené, C., Champier, J., Maallem, S., Strazielle, N., Jouvet, A., & Fèvre-Montange, M., et al. (2010). P‐glycoprotein (ABCB1) and breast cancer resistance protein (ABCG2) localize in the microvessels forming the blood‐tumor barrier in ependymomas. Brain Pathology, 20(5), 926-935. [PMID]
Jablonski, M. R., Markandaiah, S. S., Jacob, D., Meng, N. J., Li, K., & Gennaro, V., et al. (2014). Inhibiting drug efflux transporters improves efficacy of ALS therapeutics. Annals of Clinical and Translational Neurology, 1(12), 996-1005. [DOI:10.1002/acn3.141] [PMID]
Ji, J., Li, G., Ma, Y., Pan, S., & Yuan, R. (2018). Expression of multidrug resistance genes in peripheral blood of patients with refractory epilepsy and the reverse effect of oxcarbazepine on its expression. Iranian Journal of Public Health, 47(1), 40-48. [PMID]
Keppler, D. (2011). Multidrug resistance proteins (MRPs, ABCCs): Importance for pathophysiology and drug therapy. Handbook of Experimental Pharmacology, (201), 299–323. [DOI:10.1007/978-3-642-14541-4_8] [PMID]
Kortekaas, R., Leenders, K. L., van Oostrom, J. C., Vaalburg, W., Bart, J., & Willemsen, A. T., et al. (2005). Blood-brain barrier dysfunction in parkinsonian midbrain in vivo. Annals of Neurology, 57(2), 176-179. [DOI:10.1002/ana.20369] [PMID]
Kubota, H., Ishihara, H., Langmann, T., Schmitz, G., Stieger, B., & Wieser, H. G., et al. (2006). Distribution and functional activity of P-glycoprotein and multidrug resistance-associated proteins in human brain microvascular endothelial cells in hippocampal sclerosis. Epilepsy Research, 68(3), 213-228. [DOI:10.1016/j.eplepsyres.2005.11.011] [PMID]
Kuteykin-Teplyakov, K., Brandt, C., Hoffmann, K., & Löscher, W. (2009). Complex time‐dependent alterations in the brain expression of different drug efflux transporter genes after status epilepticus. Epilepsia, 50(4), 887-897. [DOI:10.1111/j.1528-1167.2008.01916.x] [PMID]
Kwan, P., Arzimanoglou, A., Berg, A. T., Brodie, M. J., Allen Hauser, W., & Mathern, G., et al. (2010). Definition of drug resistant epilepsy: Consensus proposal by the ad hoc Task Force of the ILAE Commission on Therapeutic Strategies. Epilepsia, 51(6), 1069–1077. [DOI:10.1111/j.1528-1167.2009.02397.x] [PMID]
Kwan, P., & Brodie, M. J. (2005). Potential role of drug transporters in the pathogenesis of medically intractable epilepsy. Epilepsia, 46(2), 224-235. [DOI:10.1111/j.0013-9580.2005.31904.x] [PMID]
Lachos, J., Zattoni, M., Wieser, H. G., Fritschy, J. M., Langmann, T., & Schmitz, G., et al. (2011). Characterization of the gene expression profile of human hippocampus in mesial temporal lobe epilepsy with hippocampal sclerosis. Epilepsy Research and Treatment, 2011, 758407. [DOI:10.1155/2011/758407] [PMID]
Lam, F. C., Liu, R., Lu, P., Shapiro, A. B., Renoir, J. M., & Sharom, F. J., et al. (2001). β‐Amyloid efflux mediated by p‐glycoprotein. Journal of Neurochemistry, 76(4), 1121-1128. [DOI:10.1046/j.1471-4159.2001.00113.x] [PMID]
Laxer, K. D., Trinka, E., Hirsch, L. J., Cendes, F., Langfitt, J., & Delanty, N., et al. (2014). The consequences of refractory epilepsy and its treatment. Epilepsy & Behavior, 37, 59-70. [DOI:10.1016/j.yebeh.2014.05.031] [PMID]
Livak, K. J., & Schmittgen, T. D. (2001). Analysis of relative gene expression data using real-time quantitative PCR and the 2− ΔΔCT method. Methods (San Diego, Calif.), 25(4), 402–408. [PMID]
Löscher, W., & Friedman, A. (2020). Structural, molecular, and functional alterations of the blood-brain barrier during epileptogenesis and epilepsy: A cause, consequence, or both? International Journal of Molecular Sciences, 21(2), 591. [DOI:10.3390/ijms21020591] [PMID]
Miller, D. S., Bauer, B., & Hartz, A. M. (2008). Modulation of P-glycoprotein at the blood-brain barrier: Opportunities to improve central nervous system pharmacotherapy. Pharmacological Reviews, 60(2), 196-209. [DOI:10.1124/pr.107.07109] [PMID]
Pohlen, M. S., Jin, J., Tobias, R. S., & Maheshwari, A. (2017).Pharmacoresistance with newer anti-epileptic drugs in mesial temporal lobe epilepsy with hippocampal sclerosis. Epilepsy Research, 137, 56-60. [DOI:10.1016/j.eplepsyres.2017.09.012] [PMID]
Potschka, H., Fedrowitz, M., & Löscher, W. (2001). P-glycoprotein and multidrug resistance-associated protein are involved in the regulation of extracellular levels of the major antiepileptic drug carbamazepine in the brain. Neuroreport, 12(16), 3557-3560. [DOI:10.1097/00001756-200111160-00037] [PMID]
Rizzi, M., Caccia, S., Guiso, G., Richichi, C., Gorter, J. A., & Aronica, E., et al. (2002). Limbic seizures induce P-glycoprotein in rodent brain: Functional implications for pharmacoresistance. The Journal of Neuroscience : The Official Journal of The Society for Neuroscience, 22(14), 5833–5839. [DOI:10.1523/JNEUROSCI.22-14-05833.2002] [PMID]
Rawat, C., Kukal, S., Dahiya, U. R., & Kukreti, R. (2019). Cyclooxygenase-2 (COX-2) inhibitors: Future therapeutic strategies for epilepsy management. Journal of Neuroinflammation, 16(1), 197. [PMID]
Sakata, S., Fujiwara, M., Ohtsuka, K., Kamma, H., Nagane, M., & Sakamoto, A., et al. (2011). ATP-binding cassette transporters in primary central nervous system lymphoma: Decreased expression of MDR1 P-glycoprotein and breast cancer resistance protein in tumor capillary endothelial cells. Oncology Reports, 25(2), 333-339. [DOI:10.3892/or.2010.1102] [PMID]
Seegers, U., Potschka, H., & Löscher, W. (2002). Transient increase of P-glycoprotein expression in endothelium and parenchyma of limbic brain regions in the kainate model of temporal lobe epilepsy. Epilepsy Research, 51(3), 257-268. [DOI:10.1016/S0920-1211(02)00156-0] [PMID]
Sharma, A. K., Rani, E., Waheed, A., & Rajput, S. K. (2015). Pharmacoresistant epilepsy: A current update on non-conventional pharmacological and non-pharmacological interventions. Journal of Epilepsy Research, 5(1), 1-8. [DOI:10.14581/jer.15001] [PMID]
Sisodiya, S. M., Lin, W. R., Harding, B. N., Squier, M. V., & Thom, M. (2002). Drug resistance in epilepsy: Expression of drug resistance proteins in common causes of refractory epilepsy. Brain : A Journal of Neurology, 125(Pt 1), 22–31.[DOI:10.1093/brain/awf002] [PMID]
Sisodiya, S. M., Martinian, L., Scheffer, G. L., Van der Valk, P., Scheper, R. J., & Harding, B. N., et al. (2006). Vascular colocalization of P‐glycoprotein, multidrug‐resistance associated protein 1, breast cancer resistance protein and major vault protein in human epileptogenic pathologies. Neuropathology and Applied Neurobiology, 32(1), 51-63. [DOI:10.1111/j.1365-2990.2005.00699.x] [PMID]
Schmittgen, T. D., & Livak, K. J. (2008). Analyzing real-time PCR data by the comparative CT method. Nature Protocols, 3(6), 1101–1108. [PMID]
Sodani, K., Patel, A., Kathawala, R. J., & Chen, Z. S. (2012).Multidrug resistance associated proteins in multidrug resistance. Chinese Journal of Cancer, 31(2), 58-72. [DOI:10.5732/cjc.011.10329] [PMID]
Spencer, S., & Huh, L. (2008). Outcomes of epilepsy surgery in adults and children. The Lancet. Neurology, 7(6), 525–537.[DOI:10.1016/S1474-4422(08)70109-1] [PMID]
Tishler, D. M., Weinberg, K. I., Hinton, D. R., Barbaro, N., Annett, G. M., & Raffel, C. (1995). MDR1 gene expression in brain of patients with medically intractable epilepsy. Epilepsia, 36(1), 1-6. [DOI:10.1111/j.1528-1157.1995.tb01657.x] [PMID]
Van Vliet, E. A., Redeker, S., Aronica, E., Edelbroek, P. M., & Gorter, J. A. (2005). Expression of multidrug transporters MRP1, MRP2, and BCRP shortly after status epilepticus, during the latent period, and in chronic epileptic rats. Epilepsia, 46(10), 1569-1580. [DOI:10.1111/j.1528-1167.2005.00250.x] [PMID]
Vogelgesang, S., Glatzel, M., Walker, L. C., Kroemer, H. K., Aguzzi, A., & Warzok, R. W. (2006). Cerebrovascular P-glycoprotein expression is decreased in Creutzfeldt-Jakob disease. Acta Neuropathologica, 111(5), 436-443. [DOI:10.1007/s00401-006-0042-3] [PMID]
Volk, H., Potschka, H., & Löscher, W. (2005). Immunohistochemical localization of P-glycoprotein in rat brain and detection of its increased expression by seizures are sensitive to fixation and staining variables. The Journal of Histochemistry and Cytochemistry : Official Journal of the Histochemistry Society, 53(4), 517–531. [DOI:10.1369/jhc.4A6451.2005] [PMID]
Volk, H. A., Potschka, H., & Löscher, W. (2004). Increased expression of the multidrug transporter P-glycoprotein in limbic brain regions after amygdala-kindled seizures in rats. Epilepsy Research, 58(1), 67-79. [DOI:10.1016/j.eplepsyres.2003.12.009] [PMID]
Weidner, L. D., Kannan, P., Mitsios, N., Kang, S. J., Hall, M. D., & Theodore, W. H., et al. (2018). The expression of inflammatory markers and their potential influence on efflux transporters in drug‐resistant mesial temporal lobe epilepsy tissue. Epilepsia, 59(8), 1507-1517. [DOI:10.1111/epi.14505] [PMID]
Wijesuriya, H. C., Bullock, J. Y., Faull, R. L., Hladky, S. B., & Barrand, M. A. (2010). ABC efflux transporters in brain vasculature of Alzheimer’s subjects. Brain Research, 1358, 228-238. [DOI:10.1016/j.brainres.2010.08.034] [PMID]
Xiong, J., Mao, D. A., & Liu, L. Q. (2015). Research progress on the role of ABC transporters in the drug resistance mechanism of intractable epilepsy. BioMed Research International, 2015, 194541. [DOI:10.1155/2015/194541] [PMID]
Yi, H. (2012). Study of MRP1 and GFAP expression in hippocampal formation of rats with medically intractable epilepsy and effectiveness of topiramate. Journal of Luzhou Medical College, 4. [Link]
Zavala-Tecuapetla, C., Cuellar-Herrera, M., & Luna-Munguia, H. (2020). Insights into potential targets for therapeutic intervention in epilepsy. International Journal of Molecular Sciences, 21(22), 8573. [DOI:10.3390/ijms21228573] [PMID]
Epilepsy is the most prevalent neurological condition affecting approximately 69 million people worldwide (Rawat et al., 2020). Mesial temporal lobe epilepsy (MTLE) is the common form of partial epilepsy. More than 20 types of anti-epileptic drugs (AEDs) are available but around 20%-40% of the MTLE cases are multi-drug resistant. Uncontrolled seizures have been associated with sudden unexpected death in epilepsy in 6 per 1000 epilepsy patients per year (Laxer et al., 2014). Drug-resistant epileptic patients are at an increased risk of premature death, injuries, psychosocial dysfunction, and a reduced quality of life (Löscher & Friedman, 2020; Zavala-Tecuapetla et al., 2020). Therefore, understanding drug resistance in MTLE is an urgent clinical need.
The International League Against Epilepsy defines drug-resistant epilepsy as “failure of adequate trials of two tolerated, appropriately chosen and used antiepileptic drug schedules (whether as monotherapies or in combination) to achieve sustained seizure freedom” (Kwan et al., 2010). The mechanism of drug resistance in MTLE is poorly understood; therefore, the pathogenesis is considered to be multifactorial. Resistance is usually against multiple drugs with different modes of action. This suggests that the pathophysiological basis for developing drug resistance is non-specific (Kwan & Brodie, 2005). The principal factors thought to be involved in pharmacoresistant MTLE include the etiology of the disease, seizure activity progression under drug treatment, the complex temporal patterns, abnormalities in neuronal networks, changes in drug uptake across the blood-brain barrier (BBB), changes in AEDs targets, and elimination of AEDs from patient tissue through drug-efflux transporters (Lachos et al., 2011).
This is further explained well by two widely accepted hypotheses–target and transporter hypotheses. The most accepted explanation is the transporter hypothesis. This proposes that drug resistance occurs due to the up-regulation of efflux transporters in the brain capillaries of BBB. It prevents adequate drug entry to the target location in the brain by actively expelling the drugs (Sisodiya et al., 2002).
Two adenosine 5′-triphosphate (ATP)-binding cassette (ABC) drug-efflux transporters are thought to be chief players in resistant MTLE–multidrug-resistance protein 1 (MDR-1), gene encoding permeability glycoprotein (P-gp), and MRP-1. P-gp is a transmembrane glycoprotein that is primarily distributed in the organs associated with absorption, metabolism, and excretion. It is found in the brain at the BBB (Xiong et al., 2015). MRP-1 is an organic ion-transporter; it shares 15% of its amino acid sequence with P-gp. Unlike P-gp, MRP-1 is found in the choroid plexus epithelium and ependymal epithelium cells for the protection of the blood-cerebrospinal fluid barrier (BCB) (Keppler, 2011). Under physiological conditions, both the transporters expel the harmful substance to maintain the equilibrium of the internal environment of the brain.
Various animal trials have shown an increase in the expression of the P-gp in refractory epilepsy (Rizzi et al., 2002; Volk et al., 2005; Volk et al., 2004). Similarly, MRP-1 is overexpressed in animal models of refractory MTLE (Feldmann et al., 2013; Sisodiya et al., 2002). A study conducted on blood samples collected from epileptic patients showed increased expression of these efflux transporters in drug-resistant epileptics compared to patients controlled by AEDs. Most available efflux transporter studies on MTLE patient samples lack suitable control tissue to compare the data which is essential for result interpretation (Dombrowski et al., 2001; Kubota et al., 2006; Sisodiya et al., 2002; Tishler et al., 1995; Weidner et al., 2018). For control, most studies have used either disease-adjacent tissue or tissue obtained from surgeries done for other pathologies, such as arteriovenous malformation, aneurysms, etc. P-gp and MRP-1 dysfunction has also been reported in many neurological diseases, including tumors (de Klerk et al., 2010; Ginguené et al., 2010; Jablonski et al., 2014; Kortekaas et al., 2005; Lam et al., 2001; Sakata et al., 2011; Vogelgesang et al., 2006; Wijesuriya et al., 2010). Therefore, the inclusion of control tissue from brains without known neurological disease is necessary to validate the results.
The current study was designed to analyze the expression of P-gp and MRP-1 in detail and to find out the relative importance of these two in promoting drug resistance in MTLE. The study was conducted using hippocampal tissues obtained from drug-resistant MTLE patients undergoing surgery and age-matched control tissue obtained from the autopsy. We have studied P-gp and MRP-1 at both gene and protein levels. Moreover, immuno-histochemical analysis and confocal fluorescence microscopy were used to determine the cellular localization of these transporters.
2. Materials and Methods
Subjects
The hippocampal tissue was obtained from 15 drug-resistant MTLE patients who underwent MTLE surgery in the Department of Neurosurgery of the Postgraduate Institute of Medical Education and Research, Chandigarh, India. Table 1 presents the clinical data of the patients. The tissue was taken from the patients with pathologically proven hippocampal sclerosis (HS) only. The exclusion criteria included patients with seizure types other than partial seizures and tissues showing any structural intracranial insults, for example, gliomas, meningitis, and neurofibromatosis.
Controls
The hippocampal tissue taken from the autopsies (n=15) performed in the Department of Forensic Medicine of the Postgraduate Institute of Medical Education and Research was used as control tissue. Samples were collected from the autopsies performed within 4 hours after death with only non-neurological causes. Death due to non-neurological causes was considered for the study while patients with any severe head injury, hemorrhage, etc. were not included in the study. Table 2 presents clinical data.
Tissue was collected only after written informed consent from the relatives of patients and controls.
Processing of hippocampal tissue
Under sterile conditions, the collected tissue was immediately placed in the saline. The collected tissue was then divided into sections, one section was fixed in ribonucleic acid (RNA) later at -20ᴼC, one section was frozen at -80ᴼC and another section was fixed in 10% formalin overnight at room temperature.
In each case, a part of the fixed tissue was processed for histology. Using the standard procedure, hematoxylin and eosin staining was performed and the slides were then assessed by a histopathologist to identify HS.
Real-time polymerase chain reaction (RT-PCR)
The trizol method (Ambion) was used to isolate total RNA by taking an amount of 0.5-1 g of tissue kept in the RNA later. Spectrophotometric measurements (Biotek Epoch) were performed to assess RNA quality and quantity. The absorbance taken for measurements was at A260/A280. Complementary DNA (cDNA) was synthesized using a BioradiScript cDNA synthesis kit as per instructions. For RT-PCR, primers at 250 nM concentration were used–human MDR-1 forward 5’-TCAGCTGTTGTCTTTGGTGC-3’; reverse 5’-GGTCGGGTGGGATAGTTGAA-3’, human MRP-1 forward 5’-TTGGTGATATTCGCCATTGA-3’; reverse 5’-ACGCATAGTGGATGGCTTTC-3’, and human Glyceraldehyde 3-phosphate dehydrogenase (GAPDH) forward 5’-TGAACGGGAAGCTCACTGG-3’, reverse 5’-TCCACCACCCTGTTGCTGTA-3’. Evaluation of gene expression was performed using SYBR Green chemistry on ABi step one plus RT-PCR system. The data was standardized (Livak & Schmittgen, 2001; Schmittgen & Livak, 2008). The data was represented in the form of plots and a standard criterion was followed to describe the gene’s status whether up-regulated or down-regulated.
Western blot (WB)
Hippocampal tissue was properly thawed and washed with phosphate-buffered saline (PBS). Total proteins were extracted ice cold 1X RIPA lysis buffer. One mL of 1X RIPA lysis buffer was added along with 2 µL protease inhibitor (Sigma-Aldrich). The bicinchoninic acid (BCA) method was used to analyze protein concentration using the BCA kit (BioRad). After heating, the samples were resolved on sodium-dodecyl sulphate polyacrylamide gel using 4% stacking and 8% separating gel. Polyvinylidene difluoride (PVDF) membrane was used to blot the resolved proteins. The blocking was performed in the BSA at 25°C. Blotted PVDF membranes were incubated with specific primary antibodies overnight at 4°C, mouse monoclonal MDR-1 at a concentration of 1:200 (Santa-Cruz Biotech., sc-71557), mouse monoclonal MRP-1 at a concentration of 1:50 (Abcam, ab24102), and mouse monoclonal β-actin (an internal control) at a concentration of 1:5000 (Thermo fisher, M5A-15739). After proper washing with tris-buffered saline, 0.1% Tween 20 (TBST) buffer, blotted membranes were incubated with respective secondary antibodies at room temperature–rabbit anti-mouse (1:10,000, Abcam, ab97046). Enhanced chemiluminescence (ECL) kit (BioRad) was used to visualize blotted membranes. To interpret data, ImageJ Plus software was used for the densitometry analysis.
Immunohistochemistry (IHC)
Immunohistochemical analysis was performed to confirm RT-PCR and WB results by evaluating the protein localization and expression. After processing with standard protocol, 5 µm thick sections were taken on poly-L-lysine coated slides. Deparaffinization was done in xylene (three 10-minute changes) followed by hydration of sections through graded alcohols (absolute or 100% ethanol, 70% ethanol, 50% ethanol, and distilled water for 5 minutes each). Hydrogen peroxide and deionized water in a ratio of 1:9 were used for endogenous blocking by incubating sections for 10-15 minutes. Antigen retrieval was performed using tris-ethylenediaminetetraacetic acid (EDTA) buffer at pH 9.0 to increase the immunogenicity. The sections were placed in an incubator at 55°C for 4-8 hours. Incubation with primary antibodies-mouse monoclonal MDR-1 (1:200, Santa-Cruz Biotech., sc-71557) and mouse monoclonal MRP-1 (1:20, Abcam, ab24102) was performed by an overnight incubation at 4°C. Primary antibody was omitted in the negative control. Horseradish peroxidase (HRP)-conjugated rabbit anti-mouse secondary antibody (1:2000, Abcam, ab97046) was used at room temperature. A total of 0.5% 3, 3’-diaminobenzidine was used to develop peroxidase activity. Hematoxylin was used as a counterstain. The slides were properly cleaned and coverslipped after mounting with di-n-butyl phthalate. The observation was done under a light microscope by two unbiased observers.
Semi-quantitative analysis of immunohistochemistry (IHC) using histo (H)-score
The cells with clearly outlined nuclei were observed and counted in 10 random fields of view in each section of the patient (n=15) and non-epileptic control (n=15) at scale bars 100 µm for the detailed analysis. Histo-score (H-score) was calculated using the Equation 1:
1. H-score=(1×[% Cells with 1+]+2×[% Cells with 2+] +3×[% Cells with 3+])
Where 1+, 2+ and 3+ are the intensity scores of immunostaining according to the appearance (Cheon et al., 2001).
Each section was examined under a light microscope by two unbiased observers in a blinded manner. It was calculated in the 10 high power fields in the section and the average was taken as H-score. Based on the H-score, the immunoreactivity (IR) was categorized as mild (<50), moderate (50-100), or strong (>150). The selected sections were photographed using an Olympus microscope with ProgRes® Capture Pro software, version 2.9.01.
Immunofluorescence
For immunolabelling, tissues were processed with standard protocol. Sections with a thickness of 5 µm were taken on poly-L-lysine coated slides. Deparaffinization was performed in xylene (three 10-minute changes) followed by hydration of sections through graded alcohols (absolute or 100% ethanol, 70% ethanol, and 50% ethanol for 5 minutes each). The tissue sections were then washed in the running water (deionized) for one minute. After PBS rinsing, antigen retrieval was done to increase the immunogenicity using tris-EDTA buffer at pH 6.1 in the oven for 12 minutes. The slides were incubated with two different primary antibodies (used in IHC) mixed in the immunofluorescence (IF) buffer and incubated at room temperature for one hour. Antibody binding was observed by incubation with appropriate Alexa Flour (647-red) anti-mouse conjugated secondary antibodies (Thermo-fisher Scientific A21235, dilution 2 µ/mL) diluted in the immunofluorescence buffer in a dark for one hour. After washing 2-3 times with PBS, the slides were counterstained with 60 µL 4′,6-diamidino-2-phenylindole (DAPI) and mounted using glycerol. Slides were stored in the dark by covering them with aluminum foil at 4˚C before analysis using a confocal immunofluorescence microscope (Evos FL auto BX53). All the samples were processed on the same day to avoid confounding with the quantification. Fluorescence of cells and images were determined at scale bars 100 µm using the ImageJ plus software. The color channels were split by selecting the image. After making the composite and splitting the different channels, the images were stacked. An image montage was created as displayed images. For densitometric analysis, z-stacks of the photographed images were converted to grayscale. Signal intensity was quantified as integrated density by simply marking a circle around the cell. For further analysis, the mean gray value, and integrated density were calculated. Corrected total cell fluorescence (CTCF) was interpreted using the Equation 2:
2. CTCF=Integrated density (Measured area of the selected cell×Mean fluorescence of background)
Background signals were measured in signal-free areas.
Statistical analysis
The software used for data analysis and graph preparation was GraphPad Prism software, version 8 and SPSS software, version 23. Statistical significance was determined using the student’s t-test comparing control versus patients. Mean±SD, Mean±SE, and the range were calculated for age, onset age of seizure, epilepsy duration, and seizure frequency. The drug-efflux transporters, P-gp and MRP-1 were correlated with the duration of epilepsy, duration of drug resistance, and seizure frequency. Correlation was determined by calculating Spearman’s rank correlation coefficient, ρ. P≤0.05 was considered significant. Unpaired student’s t-test was applied to determine any significant difference in H-score and of immunofluorescence (CTCF values), between MTLE cases and non-epileptic controls.
3. Results
Clinical data
Tables 1 and 2 present the clinical and demographic data of the patients and controls. In the patient group (9 men and 6 women), the mean age of the patients was 29.27±10.12 years, the onset age of seizures was 12.13±6.26 years, the duration of epilepsy was 15.13±10.70 years and seizure frequency was 8.60±5.86 month. The whole data of patients are expressed compared to the age-matched controls. In the non-epileptic control group (13 men and 2 women), the mean age of the controls was 40.47±13.68 years.
Expression of transcripts of P-gp and MRP-1 genes in hippocampal tissue
Figure 1 (a-d) shows relative messenger ribonucleic acid (mRNA) levels of P-gp and MRP-1 genes of drug-resistant MTLE patients and non-epileptic controls. Both P-gp and MRP-1 were detected in the hippocampal tissue. It has been observed that mRNA levels of P-gp and MRP-1 were higher in the patient tissues compared to the control tissues (Figure 1b and 1d). The Mean±SD (ΔCt value) of the patient group was 10.12±5.47 and for the control group was 0.51±0.73 for P-gp. And Mean±SD (ΔCt) of the patient group was 2.99±2.40 and for the control group was 0.97±0.69 for MRP-1. The fold change was calculated for each patient (n=15), 66% of the patients showed overexpression of P-gp. Eleven out of Fifteen patients showed overexpression of MRP-1 (Figure 1a and 1c). Elevated levels of P-gp and MRP-1 in the patients were between 4-6 folds compared to the controls. The results were statistically significant for P-gp (P<0.0001) and MRP-1 (P=0.01). Fold change seen for P-gp in the MTLE patients was more pronounced than MRP-1.
Expression and localization of P-gp and MRP-1 proteins in hippocampal tissue
WB analysis further revealed increased protein expression of both P-gp and MRP-1 with an apparent molecular weight of 170 and 172 kDa, respectively in the patients and controls using sc-71557 and ab24102 antibodies (Figure 1e). The densitometric analysis showed that the results using β-actin as standard were statistically significant (Figure 1f). The Mean±SD of the ratio of the area was 0.60±0.02 in the patients and 0.42±0.08 in the controls for P-gp (P=0.006) and 0.67±0.04 in the patients and 0.36±0.04 in the controls for MRP-1 (P<0.001).
The cellular localization of P-gp and MRP-1 was determined by immunohistochemistry using the same antibodies. The results demonstrated that these proteins were present in both diseased and control tissues. P-gp showed increased immunostaining in the MTLE patients compared to the controls (Figure 2). In the diseased patients, the IR was moderate to strong. Maximum staining was observed at the BBB (Figure 2b and 2c). The endothelial cells in blood vessels demonstrated cytoplasmic as well as membranous staining. The neuropil surrounding the capillaries depicted moderate immunostaining; it includes foot processes in astrocytes. Moderate to severe intensity cytoplasmic IR was also observed in the glial cells (Figure 2c). In addition, moderate IR was displayed by neurons; it was punctate in pattern and cytoplasmic as well as membranous in location. In the controls, mild IR was observed in endothelial cells of the capillaries at the BBB. Very mild cytoplasmic IR was also observed in the neurons (Figure 2a). No immunostaining glial cells were found in the control cases.
Immunohistochemical analysis of MRP-1 was performed and increased expression was observed in the MTLE cases compared to the non-epileptic controls (Figure 3). In the MTLE patients, IR was cytoplasmic in glial cells. Some neurons were also immunopositive (Figure 3a). In the control group, mild IR was observed in neurons and glial cells (Figure 3b).
In the vessel, stained endothelial cells were observed neither in patients nor in controls (Figure 3c and 3d). Semi-quantitative analysis by H-score also confirmed the IHC results (Table 3).
Further, immunofluorescence of P-gp and MRP-1 was checked in the MTLE and non-epileptic control tissue. Immunofluorescence staining confirmed the expression of P-gp and MRP-1 in the hilar region of the dentate gyrus. The immunofluorescence images labeled with P-gp (red) and MRP-1 (red) only described the presence or absence of particular protein along with nuclear dye 4′,6-diamidino-2-phenylindole (DAPI) (blue) in patients and controls. Increased immunofluorescence was observed in the MTLE cases for both the efflux transporters (Figure 4). The results were statistically significant for P-gp. The Mean±SE was 116293±11698 in the MTLE cases and 38887±2583 in the controls with a P 0.0002. The Mean±SE for MRP-1 was 79172±5032 in the MTLE cases and 49942±6304 in the controls with a P=0.006, which was statistically significant. The number of positive cells for P-gp showed a significant difference in patients and controls, while positive cells in the case of MRP-1 were significant but not significantly different between patients and controls.
Correlation of disease parameters with P-gp and MRP-1
There may be a possibility of a relationship between drug-efflux transporters and the disease parameters of epilepsy. We tried to find any relation between increased expression of drug-efflux transporters and different disease parameters. We correlated the expression pattern of P-gp and MRP-1 with the duration of epilepsy, duration of drug resistance, and frequency of seizures using Spearman’s rank correlation. P-gp or MRP-1 showed no correlation with any of the described parameters (Table 4).
4. Discussion
Drug efflux transporters are crucial for the maintenance of homeostasis in the brain in a physiological state. Pathological conditions, such as epilepsy seem to increase the activity of xenobiotic efflux manyfold. Thus, efflux transporters become a critical determinant of drug distribution within the central nervous system (CNS). We have investigated the expression pattern of drug efflux transporters P-gp and MRP-1 in the tissue resected from multidrug-resistant MTLE patients and compared it with non-epileptic controls. We have found statistically increased gene expression profiles for both the efflux transporters in patients. Similar results were obtained in the protein analysis. Immunohistochemical and immunofluorescent studies have provided histological as well as cellular localization of these increased efflux transporters in hippocampal tissue in drug-resistant MTLE.
Drug resistance has been observed in about 1/3rd of the total patients treated with different AEDs. One of the most resistant forms of epilepsy in humans is MTLE with HS (Pohlen et al., 2017). Therefore, we only incorporated patients with confirmed HS in the present study. About 30%–50% of epileptic patients are resistant to the present treatments, which is associated with a five-fold death rate compared to the population (Sharma et al., 2015). The removal of epileptic tissue with surgery remains the only solution for drug-resistant patients (Bergey et al., 2017), but even then seizure freedom was attained for at least 1 year in only 50%-80% of cases (Spencer & Huh, 2008). Overexpression of the drug-efflux transporters was first described for multi-drug resistant cancer cells. Overexpression of transporters was also found in capillary endothelial cells of brain tissue obtained from patients with resistant epilepsy. Various studies explain the involvement of ABC efflux transporters in drug-resistance MTLE; the vital transporters are P-gp and MRP-1 (Aronica et al., 2004; Dombrowski et al., 2001; Kubota et al., 2006; Sisodiya et al., 2002; Sisodiya et al., 2006; Tishler et al., 1995; Weidner et al., 2018). Both efflux transporters maintain the stability of the internal environment by extruding the xenobiotics in physiological conditions. The expression pattern of these transporters changes from physiological to pathological states. In pathological conditions, drug efflux leads to suboptimal concentrations of drugs at the target site, causing multidrug resistance.
P-gp or MDR-1 is an ATP-binding cassette subfamily B member 1 (ABCB1). It is encoded by the MDR1 (ABCB1) gene in humans located at chromosomal region 7q21 (Potschka et al., 2001). This is a single-stranded transmembrane glycoprotein composed of 1 280 amino acids. Various barrier and excretory tissues express P-gp. P-gp delivers hydrophobic and amphipathic molecules of cells or membranes by active transport from inside to outside. This physiological function of expelling xenobiotics of extensive molecular variability is considered the critical defense mechanism that protects the internal brain milieu. Under physiological conditions, P-gp is expressed in the luminal membrane of the brain capillary endothelial cells and in the astrocyte foot processes surrounding the capillaries that constitute the BBB. Its expression is slightly evident in neurons or glial cells. In pathological conditions, such as epilepsy, stroke, etc. biochemical cues from the variations in the internal environment of the brain lead to increased expression of P-gp (Miller et al., 2008). In the diseased state, P-gp is not only highly expressed in endothelial cells but also the brain parenchyma (D’GIANO, 1997). In our results, we have found over-expression of P-gp in the endothelial cells of the blood vessels as well as in the hippocampal neurons (Figure 2b and 2c). In animal tissue, it has been found that under physiological conditions, the MDR1 gene expression is limited to capillary endothelial cells and astrocytes around capillaries. However, after epileptic seizures, P-gp is also expressed in the astrocytes and neurons in the parenchyma. Therefore, there is not only an increase in the expression level of the P-gp but also the number of sites that express these transporters (Volk et al., 2005). According to our results, the mRNA expression of the gene (MDR-1) increased five folds in MTLE patients compared to the non-epileptic controls in the present study. Similarly, on WB, P-gp levels were also significantly raised in the patient group.
MRP-1 is a specific organic anion transporter. This is composed of 1 531 amino acids and is encoded by the ABCC gene located at chromosomal region 16p31.1. It is distributed in the kidneys, liver, lungs, testes, and peripheral blood mononuclear cells. In the brain, MRP-1 is distributed in the choroid plexus epithelium and ependymal epithelium cells of BCB. These cells prevent the entry of harmful substances or drugs into brain tissue (Sodani et al., 2012). Sisodiya et al. found increased expression of MRP-1 in samples collected from epileptic patients (Sisodiya et al., 2002). In the present study, we have also found that the MRP-1 gene was over-expressed in the epileptic brains and also translated into much higher MRP proteins. Over-expression of MRP-1 has been reported but conflicting reports exist on its location in the nervous system. In the normal brain, the expression of MRP-1 in the neurons and glial cells has not been constantly stated in the literature (Ashraf et al., 2014). However, in the present study, MRP-1 IR was detected in both neurons and glial cells in control tissue, though it was mild compared to the IR seen in the epileptic tissue. Vliet et al have reported MRP-1 expression in endothelial cells of the capillaries in hippocampal tissue from chronic epilepsy (Van Vliet et al., 2005). Contrary to this, in the present study, MRP-1 immuno-positivity was not observed in endothelial cells of capillaries in either control or diseased tissues (Figure 3 a-d). Similar to our results, a consistent MRP-1 overexpression in the parenchyma (neurons and astrocytes) not in endothelial cells in epileptic tissue has been reported by various studies (Chen et al., 2013; Kubota et al., 2006; Yi, 2012). Decleves et al. have also reported higher expression of MRP-1 in cultured astrocytes compared to cultured endothelial cells (Decleves et al., 2000). This suggests that the efflux mechanism is also at work within the brain parenchyma in neurons and glial cells, and this becomes overactive in the resistant cases, preventing the AEDs from achieving clinically effective concentration at the target site.
Various animal trials have shown genetic as well as protein overexpression of both efflux transporter i.e. P-gp and MRP-1, in the epileptic brain tissue (Kuteykin‐Teplyakov et al., 2009; Rizzi et al., 2002; Seegers et al ., 2002; Volk et al., 2005; Volk et al., 2004). In our study, we have observed similar up-regulation at genetic as well as protein levels for both the transporters. Jinming et al. investigated the expression levels of P-gp and MRP-1 in the peripheral blood of patients with epilepsy and found them increased in the drug-resistant patients compared to the patients responding to AEDs (Jinming et al., 2018). A positron emission tomography (PET) study reported that increased P-gp function in the temporal lobe of patients with drug-resistant TLE reverted to normal after epilepsy surgery; it was observed only in patients who responded to the surgery but not in patients having non-satisfactory surgical outcome (Bauer et al., 2014). It has been suggested that overexpression and increased activity of active efflux mechanisms in epileptic brains play a significant role in the therapeutic failure of pharmacological treatment of AEDs. Our results are consistent with these studies. In the present study, the quantum of increase was more for P-gp than MRP-1, which may indicate that P-gp plays a greater role in causing drug resistance in MTLE.
Conflicting reports exist in the literature regarding the status of P-gp and MDR-1 after acute epilepsy. Few studies have reported increased mRNA expression for P-gp after 3-48 hours of seizure episode, returning to normal within 72 hours to 2 weeks (Rizzi et al., 2002). On the other hand, Kuteykin-Teplyakov et al found that after 6-24 hours of status epilepticus in rats, P-gp and MRP-1 mRNA expression was decreased in the hippocampus, followed by increased expression after two days (Kuteykin‐Teplyakov et al., 2009). The results of these studies show that up-regulation of P-gp and MRP-1 is a temporary phenomenon in the early stage of epilepsy. We have used the hippocampal tissues from long-standing drug-resistant MTLE patients and have consistently found higher levels of both efflux transporters at genetic and protein levels. Therefore, long-term recurrent seizures may lead to permanent genetic up-regulation of the efflux transporters. We correlated P-gp and MRP1 expression profiles with duration of epilepsy, duration of drug-resistance, and frequency of seizures of all the patients, to detect any trend describing the drug-resistance pattern. We found no correlation between any of these parameters with P-gp or MRP-1.
5. Conclusion
Drug resistance is common in MTLE and results in severe morbidity and mortality. We studied the expression pattern of P-gp and MRP-1 in MTLE cases compared to age-matched non-epileptic controls. The tissue location for these transporters was found using monoclonal antibodies. These results show that P-gp and MRP-1 are crucial determinants of bioavailability and tissue distribution of AEDs in the brain. According to our study, P-gp and MRP-1 are overexpressed in most cases of the MTLE. This was confirmed at both genetic as well as protein levels. In MTLE patients, overexpression of P-gp was more pronounced than that of MRP-1. Drug efflux transporters act at brain barriers as well as within the brain parenchyma. The increase in efflux transporters levels can be pharmacologically inhibited to achieve optimal drug penetration to target sites in refractory MTLE and avoid surgery for seizure control.
Limitations
It is still not clear whether overexpression of efflux transporters is intrinsic (present before the onset of epilepsy) or acquired i.e. the result of epilepsy, uncontrolled epileptic seizures, treatment with different AEDs, or a combination of these factors. Moreover, only P-gp and MRP-1 were studied in resistance mechanisms; other drug efflux transporters should also be studied. We only focused on the theory of multidrug resistance due to over-expression of transporters; transporter and target mechanisms may overlap in some patients.
Ethical Considerations
Compliance with ethical guidelines
Ethical approval for the study was taken before tissue collection from the Institutional Ethic Committee, Post Graduate Institute of Medical Education and Research. Informed consent was obtained from all individuals and from the relatives of deceased included in the study.
Funding
This work was supported by the Intramural grant under Institute Research Scheme, by Postgraduate Institute of Medical Education and Research (Code: 71/8-Edu-15/694, dated 27/04/2016).
Authors' contributions
Conceptualization: Mandeep Kaur and Tulika Gupta; Methodology: Mandeep Kaur and Mili Gupta; Investigation: Navneet Singla, Yogender S Bansal, Bishan Das Radotra and Parampreet S Kharbanda; Writing original draft: Mandeep Kaur; Review & editing: Tulika Gupta; Funding acquisition: Tulika Gupta; Resources: Tulika Gupta and Daisy Sahni; Supervision: Daisy Sahni and Sunil Kumar Gupta.
Conflict of interest
The authors declared no conflict of interest.
Acknowledgments
The authors are thankful for funding to Council of Scientific & Industrial Research, for senior research fellowship to Mandeep Kaur.
References
Aronica, E., Gorter, J. A., Ramkema, M., Redeker, S., Ozbas-Gerçeker, F., & Van Vliet, E. A., et al. (2004). Expression and cellular distribution of multidrug resistance-related proteins in the hippocampus of patients with mesial temporal lobe epilepsy. Epilepsia, 45(5), 441-451. [DOI:10.1111/j.0013-9580.2004.57703.x] [PMID]
Ashraf, T., Kao, A., & Bendayan, R. (2014). Functional expression of drug transporters in glial cells: Potential role on drug delivery to the CNS. Advances in Pharmacology, 71, 45-111. [DOI:10.1016/bs.apha.2014.06.010] [PMID]
Bauer, M., Karch, R., Zeitlinger, M., Liu, J., Koepp, M. J., & Asselin, M. C., et al. (2014). In vivo P-glycoprotein function before and after epilepsy surgery. Neurology, 83(15), 1326-1331. [DOI:10.1212/WNL.0000000000000858] [PMID]
Bergey, G. K. (2013). Neurostimulation in the treatment of epilepsy. Experimental Neurology, 244, 87-95. [DOI:10.1016/j.expneurol.2013.04.004] [PMID]
Burtscher, J., & Schwarzer, C. (2017). The opioid system in temporal lobe epilepsy: Functional role and therapeutic potential. Frontiers in Molecular Neuroscience, 10, 245. [DOI:10.3389/fnmol.2017.00245] [PMID]
Chen, Y. H., Wang, C. C., Xiao, X., Wei, L., & Xu, G. (2013). Multidrug resistance-associated protein 1 decreases the concentrations of antiepileptic drugs in cortical extracellular fluid in amygdale kindling rats. Acta Pharmacologica Sinica, 34(4), 473-479. [PMID]
Cheon, K. W., Lee, H. S., Parhar, I. S., & Kang, I. S. (2001). Expression of the second isoform of gonadotrophin-releasing hormone (GnRH-II) in human endometrium throughout the menstrual cycle. Molecular Human Reproduction, 7(5), 447-452. [DOI:10.1093/molehr/7.5.447] [PMID]
D’GIANO, C. (1997). Expression of P-glycoprotein and related proteins in brain of patients with refractory temporal-lobe epilepsy (TLE). Epilepsia, 38(8), 87. [Link]
de Klerk, O. L., Willemsen, A. T., Bosker, F. J., Bartels, A. L., Hendrikse, N. H., & den Boer, J. A., et al. (2010). Regional increase in P-glycoprotein function in the blood-brain barrier of patients with chronic schizophrenia: A PET study with [11C] verapamil as a probe for P-glycoprotein function. Psychiatry Research, 183(2), 151-156. [DOI:10.1016/j.pscychresns.2010.05.002] [PMID]
Declèves, X., Regina, A., Laplanche, J. L., Roux, F., Boval, B., & Launay, J. M., et al. (2000). Functional expression of P‐glycoprotein and multidrug resistance‐associated protein (Mrp1) in primary cultures of rat astrocytes. Journal of Neuroscience Research, 60(5), 594-601. [PMID]
Dombrowski, S. M., Desai, S. Y., Marroni, M., Cucullo, L., Goodrich, K., & Bingaman, W., et al. (2001). Overexpression of multiple drug resistance genes in endothelial cells from patients with refractory epilepsy. Epilepsia, 42(12), 1501-1506. [DOI:10.1046/j.1528-1157.2001.12301.x] [PMID]
Feldmann, M., Asselin, M. C., Liu, J., Wang, S., McMahon, A., & Anton-Rodriguez, J., et al. (2013). P-glycoprotein expression and function in patients with temporal lobe epilepsy: A case-control study. The Lancet Neurology, 12(8), 777-785. [DOI:10.1016/S1474-4422(13)70109-1] [PMID]
Ginguené, C., Champier, J., Maallem, S., Strazielle, N., Jouvet, A., & Fèvre-Montange, M., et al. (2010). P‐glycoprotein (ABCB1) and breast cancer resistance protein (ABCG2) localize in the microvessels forming the blood‐tumor barrier in ependymomas. Brain Pathology, 20(5), 926-935. [PMID]
Jablonski, M. R., Markandaiah, S. S., Jacob, D., Meng, N. J., Li, K., & Gennaro, V., et al. (2014). Inhibiting drug efflux transporters improves efficacy of ALS therapeutics. Annals of Clinical and Translational Neurology, 1(12), 996-1005. [DOI:10.1002/acn3.141] [PMID]
Ji, J., Li, G., Ma, Y., Pan, S., & Yuan, R. (2018). Expression of multidrug resistance genes in peripheral blood of patients with refractory epilepsy and the reverse effect of oxcarbazepine on its expression. Iranian Journal of Public Health, 47(1), 40-48. [PMID]
Keppler, D. (2011). Multidrug resistance proteins (MRPs, ABCCs): Importance for pathophysiology and drug therapy. Handbook of Experimental Pharmacology, (201), 299–323. [DOI:10.1007/978-3-642-14541-4_8] [PMID]
Kortekaas, R., Leenders, K. L., van Oostrom, J. C., Vaalburg, W., Bart, J., & Willemsen, A. T., et al. (2005). Blood-brain barrier dysfunction in parkinsonian midbrain in vivo. Annals of Neurology, 57(2), 176-179. [DOI:10.1002/ana.20369] [PMID]
Kubota, H., Ishihara, H., Langmann, T., Schmitz, G., Stieger, B., & Wieser, H. G., et al. (2006). Distribution and functional activity of P-glycoprotein and multidrug resistance-associated proteins in human brain microvascular endothelial cells in hippocampal sclerosis. Epilepsy Research, 68(3), 213-228. [DOI:10.1016/j.eplepsyres.2005.11.011] [PMID]
Kuteykin-Teplyakov, K., Brandt, C., Hoffmann, K., & Löscher, W. (2009). Complex time‐dependent alterations in the brain expression of different drug efflux transporter genes after status epilepticus. Epilepsia, 50(4), 887-897. [DOI:10.1111/j.1528-1167.2008.01916.x] [PMID]
Kwan, P., Arzimanoglou, A., Berg, A. T., Brodie, M. J., Allen Hauser, W., & Mathern, G., et al. (2010). Definition of drug resistant epilepsy: Consensus proposal by the ad hoc Task Force of the ILAE Commission on Therapeutic Strategies. Epilepsia, 51(6), 1069–1077. [DOI:10.1111/j.1528-1167.2009.02397.x] [PMID]
Kwan, P., & Brodie, M. J. (2005). Potential role of drug transporters in the pathogenesis of medically intractable epilepsy. Epilepsia, 46(2), 224-235. [DOI:10.1111/j.0013-9580.2005.31904.x] [PMID]
Lachos, J., Zattoni, M., Wieser, H. G., Fritschy, J. M., Langmann, T., & Schmitz, G., et al. (2011). Characterization of the gene expression profile of human hippocampus in mesial temporal lobe epilepsy with hippocampal sclerosis. Epilepsy Research and Treatment, 2011, 758407. [DOI:10.1155/2011/758407] [PMID]
Lam, F. C., Liu, R., Lu, P., Shapiro, A. B., Renoir, J. M., & Sharom, F. J., et al. (2001). β‐Amyloid efflux mediated by p‐glycoprotein. Journal of Neurochemistry, 76(4), 1121-1128. [DOI:10.1046/j.1471-4159.2001.00113.x] [PMID]
Laxer, K. D., Trinka, E., Hirsch, L. J., Cendes, F., Langfitt, J., & Delanty, N., et al. (2014). The consequences of refractory epilepsy and its treatment. Epilepsy & Behavior, 37, 59-70. [DOI:10.1016/j.yebeh.2014.05.031] [PMID]
Livak, K. J., & Schmittgen, T. D. (2001). Analysis of relative gene expression data using real-time quantitative PCR and the 2− ΔΔCT method. Methods (San Diego, Calif.), 25(4), 402–408. [PMID]
Löscher, W., & Friedman, A. (2020). Structural, molecular, and functional alterations of the blood-brain barrier during epileptogenesis and epilepsy: A cause, consequence, or both? International Journal of Molecular Sciences, 21(2), 591. [DOI:10.3390/ijms21020591] [PMID]
Miller, D. S., Bauer, B., & Hartz, A. M. (2008). Modulation of P-glycoprotein at the blood-brain barrier: Opportunities to improve central nervous system pharmacotherapy. Pharmacological Reviews, 60(2), 196-209. [DOI:10.1124/pr.107.07109] [PMID]
Pohlen, M. S., Jin, J., Tobias, R. S., & Maheshwari, A. (2017).Pharmacoresistance with newer anti-epileptic drugs in mesial temporal lobe epilepsy with hippocampal sclerosis. Epilepsy Research, 137, 56-60. [DOI:10.1016/j.eplepsyres.2017.09.012] [PMID]
Potschka, H., Fedrowitz, M., & Löscher, W. (2001). P-glycoprotein and multidrug resistance-associated protein are involved in the regulation of extracellular levels of the major antiepileptic drug carbamazepine in the brain. Neuroreport, 12(16), 3557-3560. [DOI:10.1097/00001756-200111160-00037] [PMID]
Rizzi, M., Caccia, S., Guiso, G., Richichi, C., Gorter, J. A., & Aronica, E., et al. (2002). Limbic seizures induce P-glycoprotein in rodent brain: Functional implications for pharmacoresistance. The Journal of Neuroscience : The Official Journal of The Society for Neuroscience, 22(14), 5833–5839. [DOI:10.1523/JNEUROSCI.22-14-05833.2002] [PMID]
Rawat, C., Kukal, S., Dahiya, U. R., & Kukreti, R. (2019). Cyclooxygenase-2 (COX-2) inhibitors: Future therapeutic strategies for epilepsy management. Journal of Neuroinflammation, 16(1), 197. [PMID]
Sakata, S., Fujiwara, M., Ohtsuka, K., Kamma, H., Nagane, M., & Sakamoto, A., et al. (2011). ATP-binding cassette transporters in primary central nervous system lymphoma: Decreased expression of MDR1 P-glycoprotein and breast cancer resistance protein in tumor capillary endothelial cells. Oncology Reports, 25(2), 333-339. [DOI:10.3892/or.2010.1102] [PMID]
Seegers, U., Potschka, H., & Löscher, W. (2002). Transient increase of P-glycoprotein expression in endothelium and parenchyma of limbic brain regions in the kainate model of temporal lobe epilepsy. Epilepsy Research, 51(3), 257-268. [DOI:10.1016/S0920-1211(02)00156-0] [PMID]
Sharma, A. K., Rani, E., Waheed, A., & Rajput, S. K. (2015). Pharmacoresistant epilepsy: A current update on non-conventional pharmacological and non-pharmacological interventions. Journal of Epilepsy Research, 5(1), 1-8. [DOI:10.14581/jer.15001] [PMID]
Sisodiya, S. M., Lin, W. R., Harding, B. N., Squier, M. V., & Thom, M. (2002). Drug resistance in epilepsy: Expression of drug resistance proteins in common causes of refractory epilepsy. Brain : A Journal of Neurology, 125(Pt 1), 22–31.[DOI:10.1093/brain/awf002] [PMID]
Sisodiya, S. M., Martinian, L., Scheffer, G. L., Van der Valk, P., Scheper, R. J., & Harding, B. N., et al. (2006). Vascular colocalization of P‐glycoprotein, multidrug‐resistance associated protein 1, breast cancer resistance protein and major vault protein in human epileptogenic pathologies. Neuropathology and Applied Neurobiology, 32(1), 51-63. [DOI:10.1111/j.1365-2990.2005.00699.x] [PMID]
Schmittgen, T. D., & Livak, K. J. (2008). Analyzing real-time PCR data by the comparative CT method. Nature Protocols, 3(6), 1101–1108. [PMID]
Sodani, K., Patel, A., Kathawala, R. J., & Chen, Z. S. (2012).Multidrug resistance associated proteins in multidrug resistance. Chinese Journal of Cancer, 31(2), 58-72. [DOI:10.5732/cjc.011.10329] [PMID]
Spencer, S., & Huh, L. (2008). Outcomes of epilepsy surgery in adults and children. The Lancet. Neurology, 7(6), 525–537.[DOI:10.1016/S1474-4422(08)70109-1] [PMID]
Tishler, D. M., Weinberg, K. I., Hinton, D. R., Barbaro, N., Annett, G. M., & Raffel, C. (1995). MDR1 gene expression in brain of patients with medically intractable epilepsy. Epilepsia, 36(1), 1-6. [DOI:10.1111/j.1528-1157.1995.tb01657.x] [PMID]
Van Vliet, E. A., Redeker, S., Aronica, E., Edelbroek, P. M., & Gorter, J. A. (2005). Expression of multidrug transporters MRP1, MRP2, and BCRP shortly after status epilepticus, during the latent period, and in chronic epileptic rats. Epilepsia, 46(10), 1569-1580. [DOI:10.1111/j.1528-1167.2005.00250.x] [PMID]
Vogelgesang, S., Glatzel, M., Walker, L. C., Kroemer, H. K., Aguzzi, A., & Warzok, R. W. (2006). Cerebrovascular P-glycoprotein expression is decreased in Creutzfeldt-Jakob disease. Acta Neuropathologica, 111(5), 436-443. [DOI:10.1007/s00401-006-0042-3] [PMID]
Volk, H., Potschka, H., & Löscher, W. (2005). Immunohistochemical localization of P-glycoprotein in rat brain and detection of its increased expression by seizures are sensitive to fixation and staining variables. The Journal of Histochemistry and Cytochemistry : Official Journal of the Histochemistry Society, 53(4), 517–531. [DOI:10.1369/jhc.4A6451.2005] [PMID]
Volk, H. A., Potschka, H., & Löscher, W. (2004). Increased expression of the multidrug transporter P-glycoprotein in limbic brain regions after amygdala-kindled seizures in rats. Epilepsy Research, 58(1), 67-79. [DOI:10.1016/j.eplepsyres.2003.12.009] [PMID]
Weidner, L. D., Kannan, P., Mitsios, N., Kang, S. J., Hall, M. D., & Theodore, W. H., et al. (2018). The expression of inflammatory markers and their potential influence on efflux transporters in drug‐resistant mesial temporal lobe epilepsy tissue. Epilepsia, 59(8), 1507-1517. [DOI:10.1111/epi.14505] [PMID]
Wijesuriya, H. C., Bullock, J. Y., Faull, R. L., Hladky, S. B., & Barrand, M. A. (2010). ABC efflux transporters in brain vasculature of Alzheimer’s subjects. Brain Research, 1358, 228-238. [DOI:10.1016/j.brainres.2010.08.034] [PMID]
Xiong, J., Mao, D. A., & Liu, L. Q. (2015). Research progress on the role of ABC transporters in the drug resistance mechanism of intractable epilepsy. BioMed Research International, 2015, 194541. [DOI:10.1155/2015/194541] [PMID]
Yi, H. (2012). Study of MRP1 and GFAP expression in hippocampal formation of rats with medically intractable epilepsy and effectiveness of topiramate. Journal of Luzhou Medical College, 4. [Link]
Zavala-Tecuapetla, C., Cuellar-Herrera, M., & Luna-Munguia, H. (2020). Insights into potential targets for therapeutic intervention in epilepsy. International Journal of Molecular Sciences, 21(22), 8573. [DOI:10.3390/ijms21228573] [PMID]
Type of Study: Original |
Subject:
Cellular and molecular Neuroscience
Received: 2021/06/29 | Accepted: 2023/07/27 | Published: 2023/09/1
Received: 2021/06/29 | Accepted: 2023/07/27 | Published: 2023/09/1
Send email to the article author
| Rights and permissions | |
 |
This work is licensed under a Creative Commons Attribution-NonCommercial 4.0 International License. |
![]()
Copyright © The Author(s);
This is an open access article distributed under the terms of the Creative Commons Attribution License (CC-By-NC), which permits use, distribution, and reproduction in any medium, provided the original work is properly cited and is not used for commercial purposes.
Contact Information
