

Volume 13, Issue 2 (March & April 2022)
BCN 2022, 13(2): 153-164 |
Back to browse issues page


Download citation:
BibTeX | RIS | EndNote | Medlars | ProCite | Reference Manager | RefWorks
Send citation to:


BibTeX | RIS | EndNote | Medlars | ProCite | Reference Manager | RefWorks
Send citation to:
Ahmadieh H, Ghassemi F. Assessing the Effects of Alzheimer Disease on EEG Signals Using the Entropy Measure: A Meta-analysis. BCN 2022; 13 (2) :153-164
URL: http://bcn.iums.ac.ir/article-1-1869-en.html
URL: http://bcn.iums.ac.ir/article-1-1869-en.html
Assessing the Effects of Alzheimer Disease on EEG Signals Using the Entropy Measure: A Meta-analysis


1- Department of Biomedical Engineering, Biomedical Engineering Faculty, Amirkabir University of Technology, Tehran, Iran.
Full-Text [PDF 1980 kb]
| Abstract (HTML)
Full-Text:
1. Introduction and Aims
Alzheimer disease (AD) is a common neurodegenerative disease that more than 10% of Americans over age 65 years and nearly 50% of people older than 85 years suffer from it (Kumar, Singh, & Ekavali, 2015). This disease was discovered in 1907 by a German psychiatrist and neurologist, Alois Alzheimer. The prevalence of this disease is much higher in people older than 65 years (Alzheimer’s Association, 2015). Several physiological changes take place in AD, such as the degeneration of neurons, formation of neurofibrillary tangles (tau protein masses), and senile plaques (hypercellular masses of beta-amyloidal protein) in the hippocampus, outer cortex of the brain, and other areas, reduction in brain mass, degeneration of the cortex and enlargement of the ventricles. AD is categorized into four stages. The first stage is mild cognitive impairment (MCI), where there is no reliable sign of the disease (Yu, et al., 2019). Then, in the “early stage,” the patients will be faced with difficulty forming words and remembering names and daily events, and they also experiment with short-term memory impairment. In the “middle stage,” the patients miss some of their abilities such as speech, appropriate words use, judgment, logical thought, planning, organizing, visual cognition, and focus. Finally, in the “advanced (severe) stage,” all cognitive activities and motor functions are affected, such as mastication (chewing) and swallowing (Palmer, et al., 2007).
Unfortunately, no definitive treatments have been identified for AD so far. Thus the usual treatment plans are purely palliative (aimed at reducing the rate of progression), and drugs are only effective at certain stages of the disease (Hyman, et al., 2012). However, early diagnosis of the disease is invaluable in reducing the rate of AD progression. Electroencephalography (EEG) abnormalities of AD patients have been extensively studied for several decades (Abásolo, et al., 2006). One of the most critical issues of EEG studies on AD is the improvement of the accuracy of differential diagnosis of AD and early detection in the pre-clinical stage by examining EEG alterations in subjects having risk factors for AD. Although magnetic resonance imaging, positron emission tomography, and single-photon emission computed tomography are currently the most commonly used neuroimaging modalities in MCI studies, quantitative EEGs also have the potential to become a valuable and cheap tool in the early diagnosis of AD (Jeong, 2004). Also, the time resolution of the EEG is better than other tools.
Several studies have investigated the effect of AD on brain activity by comparing the EEG signals between healthy individuals and AD patients. They have revealed several changes in the brain activity in AD patients compared to healthy subjects, such as slow rhythms, reduction in complexity and functional associations, and disordered functional communication between different brain areas. There are also different methods for assessing signal complexity in articles such as sample entropy (Abásolo, et al., 2006), auto-manual information (Cooke, et al., 2012), Lampel-Ziv complexity (Liberati, et al., 2009), measuring complexity in recurrence plots, recurrence quantification analysis (Borenstein, et al., 2005), multi-scale entropy (MSE) (Palmer, et al., 2007), permutation entropy (PE) (Shin, et al., 2009), Tsallis entropy (Abásolo, et al., 2009), largest Lyapunov exponent (Jeong, 2004), correlation dimension (Abásolo, et al., 2007), fractal dimension (Azami, et al. 2017), simplicity dimension, and relative energy of frequency bonds (Ballard, et al., 2011).
Numerous articles have studied the changing complexity of EEG signals in AD patients compared to healthy individuals. These changes can be decreasing or increasing. We want to do a meta-analysis to obtain a general conclusion on this topic. Meta-analysis is a precise method for collecting, integrating, and evaluating scientific evidence. Regarding the complexity of the EEG signal debate, we have focused on the specificity of different entropies. Accordingly, this article aims to answer the question, “Can Alzheimer disease significantly affect EEG signals or not?”
2. Materials and Methods
Different sources must be considered, and there should not be a focus on a specific source or language. This meta-analysis used online search engines in four scientific databases: IEEE, Science Direct, Google Scholar, and Medline (PubMed). To find relevant articles, suitable keywords must be used in the search. Our keywords are “Entropy,” “EEG,” and “Alzheimer.” Our meta-analysis used the definition of the PICO (population, intervention, comparison, outcome) inclusion criteria model (Cooke, et al., 2012).
Inclusion criteria for this meta-analysis are:
• A physician has already diagnosed Alzheimer disease in the patient’s group.
• The effect of Alzheimer disease on the entropy of the EEG signal is reported.
• The reported feature of the EEG signal is entropy.
• Results of the amount of entropy on both groups of healthy and patients have been reported.
After evaluating the Titles and Abstracts of found articles, 102 articles were found on this subject In our initial search. Upon investigating their Abstracts, the number of relevant articles appropriate to this meta-analysis was reduced to 62. Finally, after reviewing the research articles and ensuring they have satisfied the inclusion criteria, this number was reduced to 18. Three papers have used more than one entropy measure of the EEG signal. Hereafter, for discussion on each of the entropy measures used in an article, we create a record in the meta-analysis and call it a study. Two of them have used two entropy measure and another one has used four entropy measures also two articles used two different databases and the rest of the papers used only one entropy measure and one database, 13 studies in total. So, this meta-analysis included 25 studies (4+4+4+13=25 studies). Figure 1 displays PRISMA (preferred reporting items for meta-analyses) flow diagram (Liberati, et al., 2009).

The selected articles were investigated, and two data types were extracted, including general data information and the statistical parameters (Table 1).
.jpg)
.jpg)
3. Meta-analysis
As mentioned in section two, 25 studies can be extracted from 18 selected articles. The meta-analysis of these studies is discussed in section 3-1, which is called “general meta-analysis.” Some articles have used more than one entropy measure, or the same author had written more than one article. This situation causes a problem of dependence that is discussed in section 3-2.
The General Meta-analysis
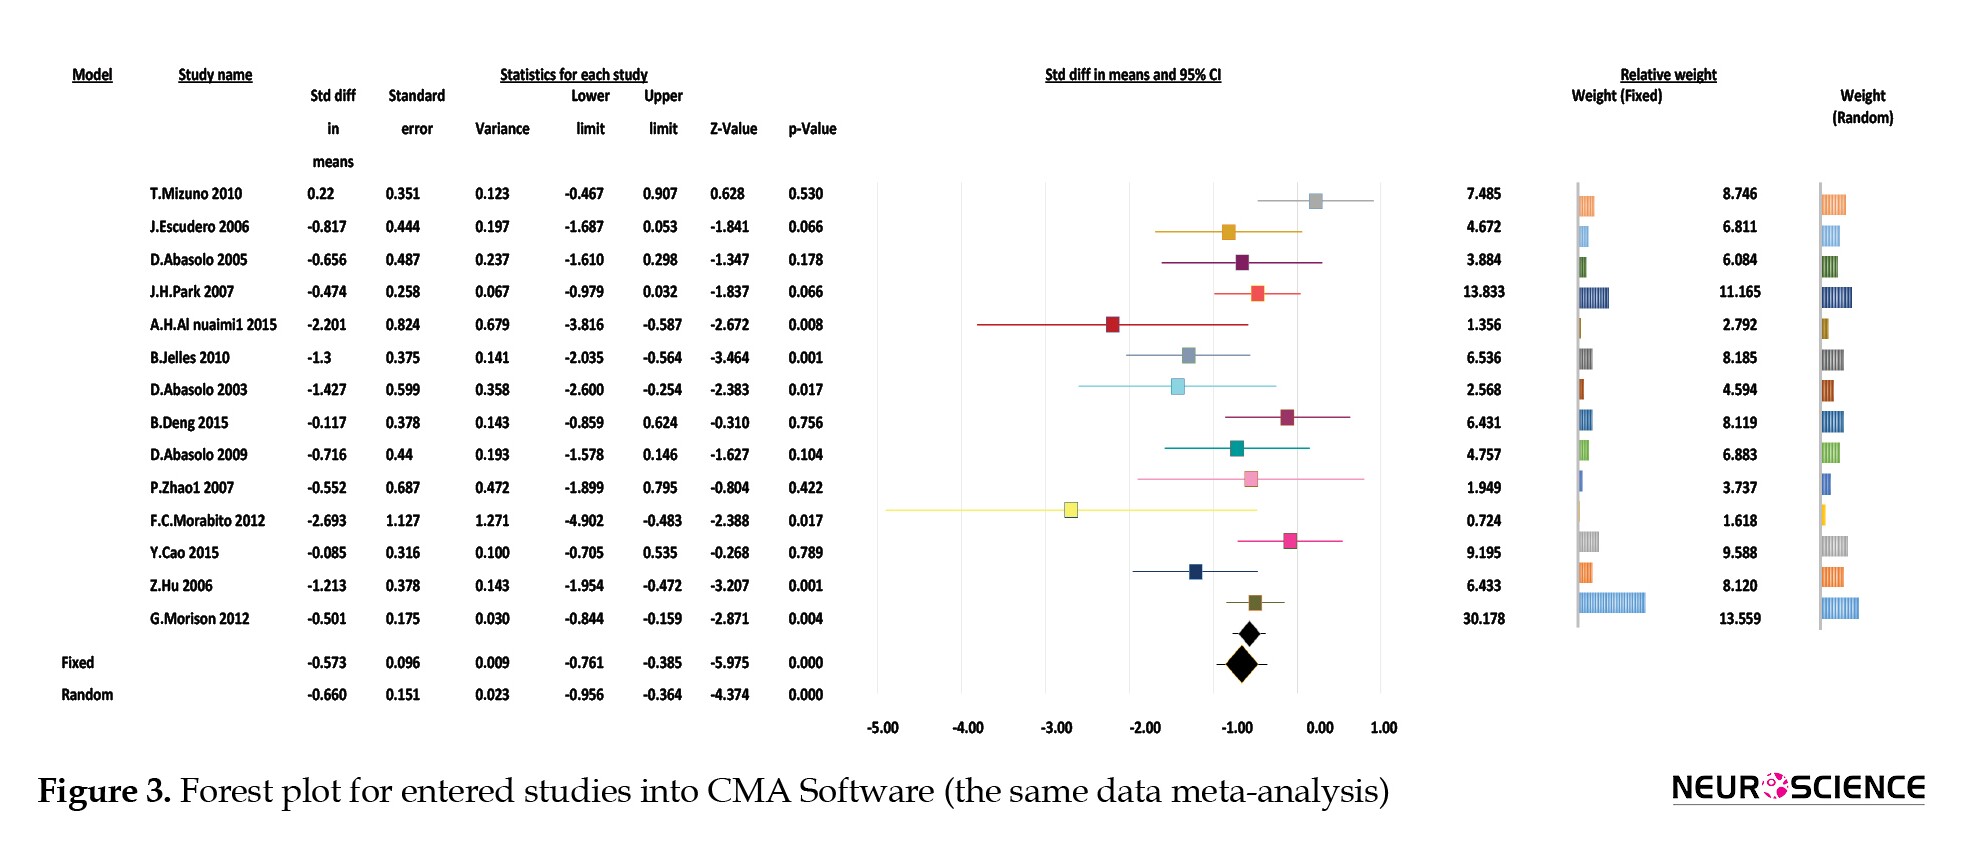
A forest plot as the most important output of a meta-analysis demonstrates the composition of the effect size of each research in the form of fixed or random-effect size models. This plot also displays the standard deviation and error of each study obtained from the combined value. The forest plot is depicted in Figure 2-(a) using comprehensive meta-analysis (CMA) software (Borenstein, et al., 2005) and is calculated for the 25 mentioned studies. The method of calculating the parameters used in the forest plot is given in Appendix A.

As described in Appendix A, the statistical significance shows whether the observed relationship between variables or differences between groups is justified by chance or not. This probability is represented by the probability value (P value). The P value is between 0 and 1. The statistical problems express a P value of which means the value is very low. So the smallness of this probability value represents that the observed difference or relationship between the variables is inherent and not based on chance. Therefore, the null hypothesis is rejected, indicating that the entropy of the EEG signals in the patient group is significantly different from the entropy of the EEG signals in the healthy counterparts.
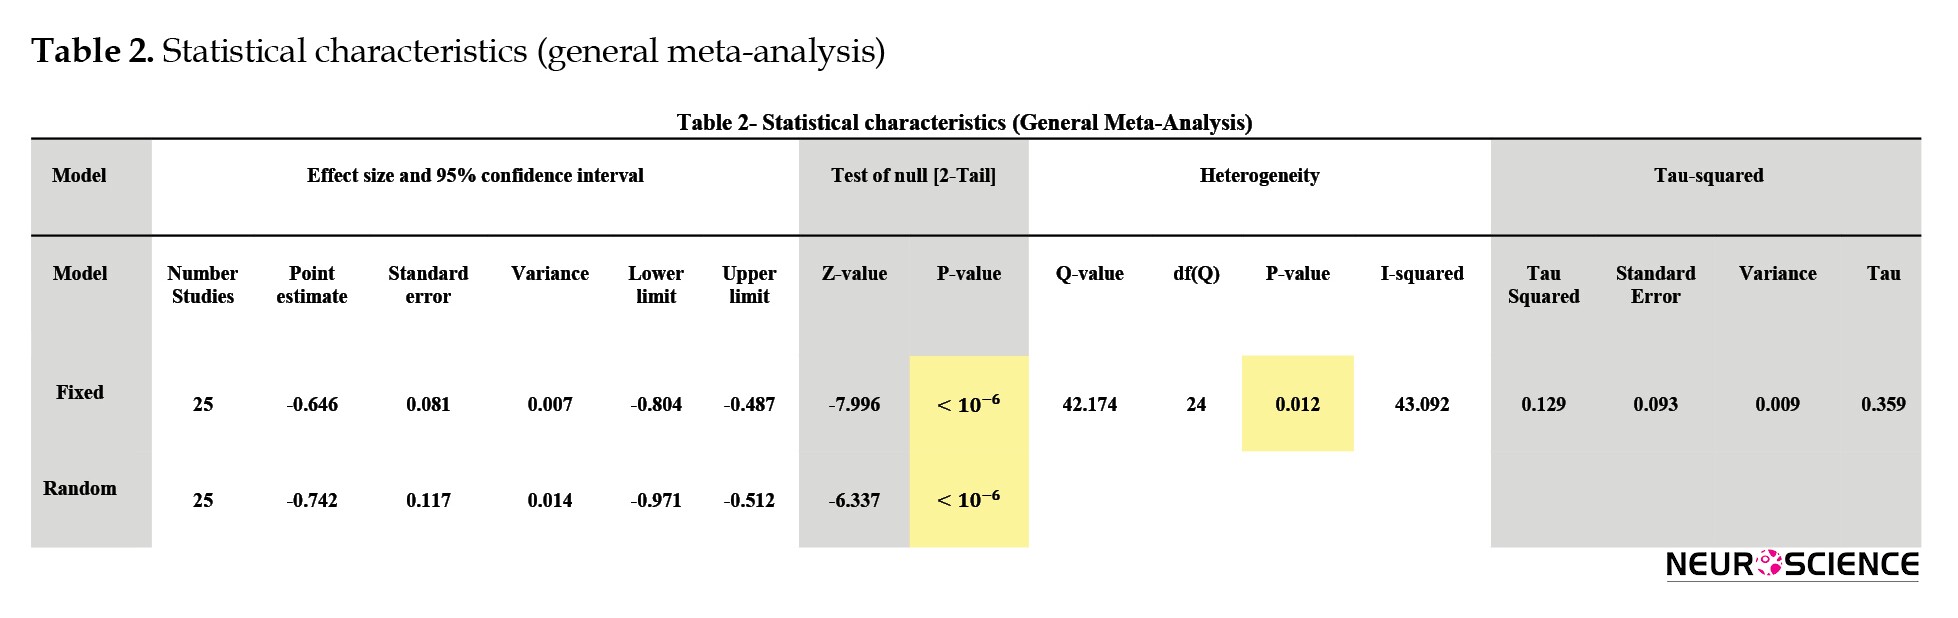
Here, to study the heterogeneity, which is described in Appendix B, the Q index is used. As seen in Table 2-(a), Q has a small value (Q=42.174), and the P value is higher than 0.01. Therefore, the null hypothesis based on the fact that the studies were homogeneous is not rejected. Additionally, another index to test the homogeneity is I2. This index measures the variance ratio between studies to the total variance. This index is smaller than 50%, which also exhibits the homogeneity of the studies.
The same data and the same author meta-analysis
In the meta-analysis, the reviewers collect extensive information on initial studies. When they have two or more initial studies that have been written by the same author or they have more than two studies that have used the same database, these issues cause “same author” or” same data” problem in the meta-analysis that leads to the dependence between studies. We used the method suggested in Shin I. S.’s study (Shin, et al., 2009) to eliminate this dependence. Among the articles with the same data, articles that are more general and comprehensive than the rest of the articles with similar data were chosen. However, when analysts choose a study from several studies to report to get rid of the dependency, they will lose some information, which is the disadvantage of this method.
The same data meta-analysis
In this section, we investigate the case in which the most comprehensive paper was selected from articles with the same data. Of several articles (Hyman, et al., 2012; Abásolo, et al., 2009; Abásolo, et al., 2007; Azami, et al. 2017; Ballard, et al., 2011), we chose one (Abásolo, et al., 2009) that is the most recent one. Another article (Azami, et al. 2017) has four entropy measures, and its database is the same as the database of other articles (Palmer, et al., 2007; Abásolo, et al., 2009; Abásolo, et al., 2007; Ballard, et al., 2011). So we omitted all of those studies. One article (Morabito, et al., 2012) used multiscale permutation entropy (MPE) and multivariate multiscale permutation entropy (MMPE), so we omitted the study with MMPE measure entropy. Two articles (Al-Nuaimi, et al., 2015; Zhao, et al., 2007) used two similar databases in two investigated studies. Therefore, we chose the study with database 2 in (Al-Nuaimi, et al., 2015) and database 1 in (Zhao, et al., 2007). So we performed the meta-analysis with 14 studies in this section.
The forest plot is shown in Figure 2b. The amount of Standardized Mean Difference (SMD) of effect size is calculated for various studies. In addition, the weights of each study are shown. The reported P value in Figure 2b is very small. As mentioned before, in this case, the null hypothesis is rejected. The null hypothesis indicates that the entropy of the EEG signals in the patient group is not significantly different from the entropy of the EEG signals in healthy counterparts. About heterogeneity, as is seen in Table 2b, Q has a small value (Q=25.794), and the P is higher than 0.01. Therefore, the null hypothesis is not rejected. The null hypothesis indicates that the studies are homogeneous. I2 value is smaller than 50%, indicating that the studies are homogeneous.

The same author meta-analysis
In this section, we investigate the case in which the most comprehensive paper was selected from articles with the same author(s). Among some articles (Hyman, et al., 2012; Abásolo, et al., 2009; Abásolo, et al., 2007; Ballard, et al., 2011; Abásolo, et al., 2003; Abásolo, et al., 2005) that Abásolo wrote, we chose one article (Abásolo, et al., 2009) because it is the most recent one. Among four entropy measures used in another article (Azami, et al. 2017) written by Azami and two entropy measures used in another article (Morabito, et al., 2012) written by Morabito, we chose and MPE, respectively, because those are more similar to other entropy measures in other studies. Two articles (Al-Nuaimi, et al., 2015; Zhao, et al., 2007) used two similar databases in two investigated studies, which are written by Al-Nuaimi and Zhao, respectively. Therefore, we chose the study with database 2 in these two articles (Al-Nuaimi, et al., 2015; Zhao, et al., 2007) because the number of participants in this database is more than that in database 1. So we performed the meta-analysis with 13 studies in this section.
The forest plot, the SMD value of the effect size for the various studies, and the weight of each study in this meta-analysis are shown in Figure 2c.
The reported P value in Table 2c is very small . So, the null hypothesis that the entropy of the EEG signals in the patient group is not significantly different from the entropy of the EEG signals in the healthy counterparts is rejected. Then, the alternative hypothesis is confirmed, which indicates that the two mentioned groups are significantly different. As seen, Q has a small value (Q=22.332), and a P is greater than 0.01. Therefore, the null hypothesis based on the fact that the studies are homogeneous was not rejected. According to the I2 value, this index is smaller than 50%. Therefore, it seems that the studies are homogeneous.

4. Funnel plot
Funnel plots (for more information, see Appendix C) were first proposed to detect a specific form of publication bias. The exaggeration of treatment effects in small studies of low quality provides a plausible alternative mechanism for funnel-plot asymmetry. In this situation, the calculated effect in a meta-analysis will tend to overestimate the intervention effect. Greater asymmetry indicates greater bias.
Figure 3 shows the funnel plots of the meta-analyses. In section (A), the funnel plot of the general meta-analysis is shown; in section (B), we can see the funnel plot of the same data meta-analysis, and in section (C), the funnel plot of the same author is depicted. According to this figure, the studies with the low sample sizes are at the bottom of the funnel plot, and those with the larger sample sizes are at the top of this plot. It is seen that there is no asymmetry in shape in any of the plots. Thus, the possibility of bias in this regard is canceled.


5. Discussion
In this meta-analysis, the effect of Alzheimer disease on the EEG signal was studied using the entropy measure. Twenty-five studies were included in this meta-analysis. According to the results and funnel plots of this meta-analysis, entropy seems to be a proper index for comparing the EEG signals in patients with AD with healthy controls. It can be concluded that AD can significantly affect EEG signals and reduce the EEG signal’s entropy. The null hypothesis in this meta-analysis states no significant difference between the two groups. According to the very small obtained P value (near zero), this hypothesis is rejected, and the two groups have a significant difference.
As mentioned, there are many articles on the effects of AD on the EEG signal. However, this article has advantages such as specificity and comprehensiveness compared to previously published articles with a close topic. For example, in one article (Morison, et al., 2012), the effect of AD was studied on only sample entropy and fuzzy entropy of the EEG signal, but in this article, we used all kinds of entropy methods to find it by meta-analysis. So this article is more comprehensive than that article (Morison, et al., 2012). Also, for example, in two articles, the authors studied and conducted a meta-analysis of the AD effect on the EEG signal using all methods such as slowing of rhythms and reduction in complexity and functional associations. In contrast, in this article, we have tried to discuss signal complexity and, specifically, the entropy of EEG signals.
6. Conclusion
In our meta-analysis, one single writer had written several of the found articles, and some articles have used a similar database. So there are dependencies between studies, which were solved with one of the approaches used in Abásolo, D., et al. (Abásolo, et al., 2003). However, the disadvantage of this method is that parts of the data would be omitted. The small amount of Q in the various meta-analyses examined indicates the homogeneity of the meta-analysis. Statistical significance was used to determine whether the two groups were significantly different. Despite the importance of these methods, their use in determining this difference is limited. For example, a statistically significant result (P value) will improve by increasing the sample size despite the clinical explanation of the effect size. Also, the P value is greater than 0.01 in the heterogeneity test, so the null hypothesis suggesting that studies are homogeneous is not rejected, and there is no heterogeneity between studies. We applied a funnel plot for the publication bias, indicating no asymmetry in this plot. Therefore, this meta-analysis has no publication bias.
Ethical Considerations
Compliance with ethical guidelines
This article is a meta-analysis with no human or animal sample.
Funding
This research did not receive any grant from funding agencies in the public, commercial, or non-profit sectors.
Authors' contributions
Reviewed and edited the manuscript: Farnaz Ghassemi; Data collection and Writing – original draft: Hajar Ahmadieh; Investigation, Data analysis, and Methodology: Hajar Ahmadieh, Farnaz Ghassemi.
Conflict of interest
The authors declared no conflict of interest.
References
Kumar, A., Singh, A., & Ekavali (2015). A review on Alzheimer’s disease pathophysiology and its management: An update. Pharmacological reports, 67(2), 195–203. [DOI:10.1016/j.pharep.2014.09.004] [PMID]
Alzheimer’s Association (2015). 2015 Alzheimer’s disease facts and figures. Alzheimer’s & Dementia: The Journal of the Alzheimer’s Association, 11(3), 332–384. [PMID]
Yu, R., Topiwala, A., Jacoby, R., & Fazel, S. (2019). Aggressive behaviors in Alzheimer disease and mild cognitive impairment: Systematic review and meta-analysis. The American Journal of Geriatric Psychiatry, 27(3), 290-300. [DOI:10.1016/j.jagp.2018.10.008] [PMID] [PMCID]
Palmer, K., Berger, A. K., Monastero, R., Winblad, B., Bäckman, L., & Fratiglioni, L. (2007). Predictors of progression from mild cognitive impairment to Alzheimer disease. Neurology, 68(19), 1596-1602. [DOI:10.1212/01.wnl.0000260968.92345.3f] [PMID]
Hyman, B. T., Phelps, C. H., Beach, T. G., Bigio, E. H., Cairns, N. J., Carrillo, M. C., et al. (2012). National Institute on Aging-Alzheimer’s Association guidelines for the neuropathologic assessment of Alzheimer’s disease. Alzheimer’s & Dementia: The Journal of the Alzheimer’s Association, 8(1), 1–13. [DOI:10.1016/j.jalz.2011.10.007] [PMID] [PMCID]
Abásolo, D., Hornero, R., Espino, P., Alvarez, D., & Poza, J. (2006). Entropy analysis of the EEG background activity in Alzheimer’s disease patients. Physiological Measurement, 27(3), 241–253. [DOI:10.1088/0967-3334/27/3/003] [PMID]
7Jeong J. (2004). EEG dynamics in patients with Alzheimer’s disease. Clinical Neurophysiology: Official Journal of the International Federation of Clinical Neurophysiology, 115(7), 1490–1505. [DOI:10.1016/j.clinph.2004.01.001] [PMID]
Cooke, A., Smith, D., & Booth, A. (2012). Beyond PICO: The SPIDER tool for qualitative evidence synthesis. Qualitative Health Research, 22(10), 1435-1443. [DOI:10.1177/1049732312452938] [PMID]
Liberati, A., Altman, D. G., Tetzlaff, J., Mulrow, C., Gøtzsche, P. C., Ioannidis, J. P., et al. (2009). The PRISMA statement for reporting systematic reviews and meta-analyses of studies that evaluate health care interventions: Explanation and elaboration. Journal of Clinical Epidemiology, 62(10), e1-e34. [DOI:10.1016/j.jclinepi.2009.06.006] [PMID]
Borenstein, M., Hedges, L., Higgins, J., & Rothstein, H. (2005). Comprehensive meta-analysis version 2. Maryland: National Institutes of Health. https://www.meta-analysis.com/downloads/Meta-Analysis-Manual.pdf
Shin, I. S. (2009). Same author and same data dependence in meta-analysis [PhD dissertation]. Florida: Florida State University. https://diginole.lib.fsu.edu/islandora/object/fsu:168453/datastream/PDF/view
Abásolo1, D., Hornero, R., & Espino, P. (2009). Approximate entropy of EEG background activity in alzheimer’s disease patients. Intelligent Automation & Soft Computing, 15(4), 591-603. [DOI:10.1080/10798587.2009.10643051]
Abásolo, D., Hornero, R., Espino, P., Escudero, J., & Gómez, C. (2007). Electroencephalogram background activity characterization with approximate entropy and auto mutual information in Alzheimer’s disease patients. Annual International Conference of the IEEE Engineering in Medicine and Biology Society. IEEE Engineering in Medicine and Biology Society. Annual International Conference, 2007, 6192–6195. [PMID]
Azami, H., Abásolo, D., Simons, S., & Escudero, J. (2017). Univariate and multivariate generalized multiscale entropy to characterise EEG signals in Alzheimer’s disease. Entropy, 19(1), 31. [DOI:10.3390/e19010031]
Ballard, C., Khan, Z., Clack, H., & Corbett, A. (2011). Nonpharmacological treatment of Alzheimer disease. Canadian Journal of Psychiatry. Revue Canadienne de Psychiatrie, 56(10), 589–595. [DOI:10.1177/070674371105601004] [PMID]
Morabito, F. C., Labate, D., La Foresta, F., Bramanti, A., Morabito, G., & Palamara, I. (2012). Multivariate multi-scale permutation entropy for complexity analysis of Alzheimer’s disease EEG. Entropy, 14(7), 1186-1202. [DOI:10.3390/e14071186]
Al-Nuaimi, A. H., Jammeh, E., Sun, L., & Ifeachor, E. (2015). Tsallis entropy as a biomarker for detection of Alzheimer’s disease. Annual International Conference of the IEEE Engineering in Medicine and Biology Society. IEEE Engineering in Medicine and Biology Society. Annual International Conference, 2015, 4166–4169. [DOI:10.1109/EMBC.2015.7319312] [PMID]
Zhao, P., Van Eetvelt, P., Goh, C., Hudon, N., Wimalaratna, S., & Ifeachor, E. C. (2007). EEG markers of alzheimer’s disease using tsallis entropy. Paper presented at The 3rd International Conference on Computational Intelligence in Medicine and Healthcare (CIMED2007), Plymouth, UK, 25 July 2007. https://www.researchgate.net/profile/Sunil-Wimalaratna/publication/253667093_EEG_MARK.pdf
Abásolo, D., Hornero, R., Espino, P., Alonso, A., & de la Rosa, R. (2003). Electroencephalogram analysis with approximate entropy to help in the diagnosis of Alzheimer’s disease. Paper presented at 4th International IEEE EMBS Special Topic Conference on Information Technology Applications in Biomedicine, Birmingham, UK, 24-26 April 2003. [DOI:10.1109/ITAB.2003.1222516]
Abásolo, D., Hornero, R., Espino, P., Poza, J., Sánchez, C. I., & de la Rosa, R. (2005). Analysis of regularity in the EEG background activity of Alzheimer’s disease patients with Approximate Entropy. Clinical Neurophysiology: Official Journal of the International Federation of Clinical Neurophysiology, 116(8), 1826–1834. [DOI:10.1016/j.clinph.2005.04.001] [PMID]
Escudero, J., Abásolo, D., Hornero, R., Espino, P., & López, M. (2006). Analysis of electroencephalograms in Alzheimer’s disease patients with multiscale entropy. Physiological Measurement, 27(11), 1091-1106. [DOI:10.1088/0967-3334/27/11/004] [PMID]
Jelles, B., Achtereekte, H. A., Slaets, J. P., & Stam, C. J. (1995). Specific patterns of cortical dysfunction in dementia and Parkinson’s disease demonstrated by the acceleration spectrum entropy of the EEG. Clinical EEG (Electroencephalography), 26(4), 188–192. [DOI:10.1177/155005949502600403] [PMID]
Deng, B., Liang, L., Li, S., Wang, R., Yu, H., Wang, J., & Wei, X. (2015). Complexity extraction of electroencephalograms in Alzheimer’s disease with weighted-permutation entropy. Chaos, 25(4), 043105. [DOI:10.1063/1.4917013] [PMID]
Cao, Y., Cai, L., Wang, J., Wang, R., Yu, H., Cao, Y., et al. (2015). Characterization of complexity in the electroencephalograph activity of Alzheimer’s disease based on fuzzy entropy. Chaos, 25(8), 083116. [DOI:10.1063/1.4929148] [PMID]
Hu, Z., & Shi, P. (2006). Regularity and complexity of human electroencephalogram dynamics: Applications to diagnosis of Alzheimers disease. Paper presented at 18th International Conference on Pattern Recognition (ICPR’06), Hong Kong, China, 20-24 August 2006. [DOI:10.1109/ICPR.2006.990]
Morison, G., Tieges, Z., & Kilborn, K. (2012). Multiscale permutation entropy analysis of the EEG in early stage alzheimer’s patients. Paper presented at Conference on Biomedical Engineering and Sciences, Langkawi, Malaysia, 17-19 December 2012. [DOI:10.1109/IECBES.2012.6498191]
Alzheimer disease (AD) is a common neurodegenerative disease that more than 10% of Americans over age 65 years and nearly 50% of people older than 85 years suffer from it (Kumar, Singh, & Ekavali, 2015). This disease was discovered in 1907 by a German psychiatrist and neurologist, Alois Alzheimer. The prevalence of this disease is much higher in people older than 65 years (Alzheimer’s Association, 2015). Several physiological changes take place in AD, such as the degeneration of neurons, formation of neurofibrillary tangles (tau protein masses), and senile plaques (hypercellular masses of beta-amyloidal protein) in the hippocampus, outer cortex of the brain, and other areas, reduction in brain mass, degeneration of the cortex and enlargement of the ventricles. AD is categorized into four stages. The first stage is mild cognitive impairment (MCI), where there is no reliable sign of the disease (Yu, et al., 2019). Then, in the “early stage,” the patients will be faced with difficulty forming words and remembering names and daily events, and they also experiment with short-term memory impairment. In the “middle stage,” the patients miss some of their abilities such as speech, appropriate words use, judgment, logical thought, planning, organizing, visual cognition, and focus. Finally, in the “advanced (severe) stage,” all cognitive activities and motor functions are affected, such as mastication (chewing) and swallowing (Palmer, et al., 2007).
Unfortunately, no definitive treatments have been identified for AD so far. Thus the usual treatment plans are purely palliative (aimed at reducing the rate of progression), and drugs are only effective at certain stages of the disease (Hyman, et al., 2012). However, early diagnosis of the disease is invaluable in reducing the rate of AD progression. Electroencephalography (EEG) abnormalities of AD patients have been extensively studied for several decades (Abásolo, et al., 2006). One of the most critical issues of EEG studies on AD is the improvement of the accuracy of differential diagnosis of AD and early detection in the pre-clinical stage by examining EEG alterations in subjects having risk factors for AD. Although magnetic resonance imaging, positron emission tomography, and single-photon emission computed tomography are currently the most commonly used neuroimaging modalities in MCI studies, quantitative EEGs also have the potential to become a valuable and cheap tool in the early diagnosis of AD (Jeong, 2004). Also, the time resolution of the EEG is better than other tools.
Several studies have investigated the effect of AD on brain activity by comparing the EEG signals between healthy individuals and AD patients. They have revealed several changes in the brain activity in AD patients compared to healthy subjects, such as slow rhythms, reduction in complexity and functional associations, and disordered functional communication between different brain areas. There are also different methods for assessing signal complexity in articles such as sample entropy (Abásolo, et al., 2006), auto-manual information (Cooke, et al., 2012), Lampel-Ziv complexity (Liberati, et al., 2009), measuring complexity in recurrence plots, recurrence quantification analysis (Borenstein, et al., 2005), multi-scale entropy (MSE) (Palmer, et al., 2007), permutation entropy (PE) (Shin, et al., 2009), Tsallis entropy (Abásolo, et al., 2009), largest Lyapunov exponent (Jeong, 2004), correlation dimension (Abásolo, et al., 2007), fractal dimension (Azami, et al. 2017), simplicity dimension, and relative energy of frequency bonds (Ballard, et al., 2011).
Numerous articles have studied the changing complexity of EEG signals in AD patients compared to healthy individuals. These changes can be decreasing or increasing. We want to do a meta-analysis to obtain a general conclusion on this topic. Meta-analysis is a precise method for collecting, integrating, and evaluating scientific evidence. Regarding the complexity of the EEG signal debate, we have focused on the specificity of different entropies. Accordingly, this article aims to answer the question, “Can Alzheimer disease significantly affect EEG signals or not?”
2. Materials and Methods
Different sources must be considered, and there should not be a focus on a specific source or language. This meta-analysis used online search engines in four scientific databases: IEEE, Science Direct, Google Scholar, and Medline (PubMed). To find relevant articles, suitable keywords must be used in the search. Our keywords are “Entropy,” “EEG,” and “Alzheimer.” Our meta-analysis used the definition of the PICO (population, intervention, comparison, outcome) inclusion criteria model (Cooke, et al., 2012).
Inclusion criteria for this meta-analysis are:
• A physician has already diagnosed Alzheimer disease in the patient’s group.
• The effect of Alzheimer disease on the entropy of the EEG signal is reported.
• The reported feature of the EEG signal is entropy.
• Results of the amount of entropy on both groups of healthy and patients have been reported.
After evaluating the Titles and Abstracts of found articles, 102 articles were found on this subject In our initial search. Upon investigating their Abstracts, the number of relevant articles appropriate to this meta-analysis was reduced to 62. Finally, after reviewing the research articles and ensuring they have satisfied the inclusion criteria, this number was reduced to 18. Three papers have used more than one entropy measure of the EEG signal. Hereafter, for discussion on each of the entropy measures used in an article, we create a record in the meta-analysis and call it a study. Two of them have used two entropy measure and another one has used four entropy measures also two articles used two different databases and the rest of the papers used only one entropy measure and one database, 13 studies in total. So, this meta-analysis included 25 studies (4+4+4+13=25 studies). Figure 1 displays PRISMA (preferred reporting items for meta-analyses) flow diagram (Liberati, et al., 2009).
The selected articles were investigated, and two data types were extracted, including general data information and the statistical parameters (Table 1).
3. Meta-analysis
As mentioned in section two, 25 studies can be extracted from 18 selected articles. The meta-analysis of these studies is discussed in section 3-1, which is called “general meta-analysis.” Some articles have used more than one entropy measure, or the same author had written more than one article. This situation causes a problem of dependence that is discussed in section 3-2.
The General Meta-analysis
A forest plot as the most important output of a meta-analysis demonstrates the composition of the effect size of each research in the form of fixed or random-effect size models. This plot also displays the standard deviation and error of each study obtained from the combined value. The forest plot is depicted in Figure 2-(a) using comprehensive meta-analysis (CMA) software (Borenstein, et al., 2005) and is calculated for the 25 mentioned studies. The method of calculating the parameters used in the forest plot is given in Appendix A.
As described in Appendix A, the statistical significance shows whether the observed relationship between variables or differences between groups is justified by chance or not. This probability is represented by the probability value (P value). The P value is between 0 and 1. The statistical problems express a P value of which means the value is very low. So the smallness of this probability value represents that the observed difference or relationship between the variables is inherent and not based on chance. Therefore, the null hypothesis is rejected, indicating that the entropy of the EEG signals in the patient group is significantly different from the entropy of the EEG signals in the healthy counterparts.
Here, to study the heterogeneity, which is described in Appendix B, the Q index is used. As seen in Table 2-(a), Q has a small value (Q=42.174), and the P value is higher than 0.01. Therefore, the null hypothesis based on the fact that the studies were homogeneous is not rejected. Additionally, another index to test the homogeneity is I2. This index measures the variance ratio between studies to the total variance. This index is smaller than 50%, which also exhibits the homogeneity of the studies.
The same data and the same author meta-analysis
In the meta-analysis, the reviewers collect extensive information on initial studies. When they have two or more initial studies that have been written by the same author or they have more than two studies that have used the same database, these issues cause “same author” or” same data” problem in the meta-analysis that leads to the dependence between studies. We used the method suggested in Shin I. S.’s study (Shin, et al., 2009) to eliminate this dependence. Among the articles with the same data, articles that are more general and comprehensive than the rest of the articles with similar data were chosen. However, when analysts choose a study from several studies to report to get rid of the dependency, they will lose some information, which is the disadvantage of this method.
The same data meta-analysis
In this section, we investigate the case in which the most comprehensive paper was selected from articles with the same data. Of several articles (Hyman, et al., 2012; Abásolo, et al., 2009; Abásolo, et al., 2007; Azami, et al. 2017; Ballard, et al., 2011), we chose one (Abásolo, et al., 2009) that is the most recent one. Another article (Azami, et al. 2017) has four entropy measures, and its database is the same as the database of other articles (Palmer, et al., 2007; Abásolo, et al., 2009; Abásolo, et al., 2007; Ballard, et al., 2011). So we omitted all of those studies. One article (Morabito, et al., 2012) used multiscale permutation entropy (MPE) and multivariate multiscale permutation entropy (MMPE), so we omitted the study with MMPE measure entropy. Two articles (Al-Nuaimi, et al., 2015; Zhao, et al., 2007) used two similar databases in two investigated studies. Therefore, we chose the study with database 2 in (Al-Nuaimi, et al., 2015) and database 1 in (Zhao, et al., 2007). So we performed the meta-analysis with 14 studies in this section.
The forest plot is shown in Figure 2b. The amount of Standardized Mean Difference (SMD) of effect size is calculated for various studies. In addition, the weights of each study are shown. The reported P value in Figure 2b is very small. As mentioned before, in this case, the null hypothesis is rejected. The null hypothesis indicates that the entropy of the EEG signals in the patient group is not significantly different from the entropy of the EEG signals in healthy counterparts. About heterogeneity, as is seen in Table 2b, Q has a small value (Q=25.794), and the P is higher than 0.01. Therefore, the null hypothesis is not rejected. The null hypothesis indicates that the studies are homogeneous. I2 value is smaller than 50%, indicating that the studies are homogeneous.
The same author meta-analysis
In this section, we investigate the case in which the most comprehensive paper was selected from articles with the same author(s). Among some articles (Hyman, et al., 2012; Abásolo, et al., 2009; Abásolo, et al., 2007; Ballard, et al., 2011; Abásolo, et al., 2003; Abásolo, et al., 2005) that Abásolo wrote, we chose one article (Abásolo, et al., 2009) because it is the most recent one. Among four entropy measures used in another article (Azami, et al. 2017) written by Azami and two entropy measures used in another article (Morabito, et al., 2012) written by Morabito, we chose and MPE, respectively, because those are more similar to other entropy measures in other studies. Two articles (Al-Nuaimi, et al., 2015; Zhao, et al., 2007) used two similar databases in two investigated studies, which are written by Al-Nuaimi and Zhao, respectively. Therefore, we chose the study with database 2 in these two articles (Al-Nuaimi, et al., 2015; Zhao, et al., 2007) because the number of participants in this database is more than that in database 1. So we performed the meta-analysis with 13 studies in this section.
The forest plot, the SMD value of the effect size for the various studies, and the weight of each study in this meta-analysis are shown in Figure 2c.
The reported P value in Table 2c is very small . So, the null hypothesis that the entropy of the EEG signals in the patient group is not significantly different from the entropy of the EEG signals in the healthy counterparts is rejected. Then, the alternative hypothesis is confirmed, which indicates that the two mentioned groups are significantly different. As seen, Q has a small value (Q=22.332), and a P is greater than 0.01. Therefore, the null hypothesis based on the fact that the studies are homogeneous was not rejected. According to the I2 value, this index is smaller than 50%. Therefore, it seems that the studies are homogeneous.
4. Funnel plot
Funnel plots (for more information, see Appendix C) were first proposed to detect a specific form of publication bias. The exaggeration of treatment effects in small studies of low quality provides a plausible alternative mechanism for funnel-plot asymmetry. In this situation, the calculated effect in a meta-analysis will tend to overestimate the intervention effect. Greater asymmetry indicates greater bias.
Figure 3 shows the funnel plots of the meta-analyses. In section (A), the funnel plot of the general meta-analysis is shown; in section (B), we can see the funnel plot of the same data meta-analysis, and in section (C), the funnel plot of the same author is depicted. According to this figure, the studies with the low sample sizes are at the bottom of the funnel plot, and those with the larger sample sizes are at the top of this plot. It is seen that there is no asymmetry in shape in any of the plots. Thus, the possibility of bias in this regard is canceled.
5. Discussion
In this meta-analysis, the effect of Alzheimer disease on the EEG signal was studied using the entropy measure. Twenty-five studies were included in this meta-analysis. According to the results and funnel plots of this meta-analysis, entropy seems to be a proper index for comparing the EEG signals in patients with AD with healthy controls. It can be concluded that AD can significantly affect EEG signals and reduce the EEG signal’s entropy. The null hypothesis in this meta-analysis states no significant difference between the two groups. According to the very small obtained P value (near zero), this hypothesis is rejected, and the two groups have a significant difference.
As mentioned, there are many articles on the effects of AD on the EEG signal. However, this article has advantages such as specificity and comprehensiveness compared to previously published articles with a close topic. For example, in one article (Morison, et al., 2012), the effect of AD was studied on only sample entropy and fuzzy entropy of the EEG signal, but in this article, we used all kinds of entropy methods to find it by meta-analysis. So this article is more comprehensive than that article (Morison, et al., 2012). Also, for example, in two articles, the authors studied and conducted a meta-analysis of the AD effect on the EEG signal using all methods such as slowing of rhythms and reduction in complexity and functional associations. In contrast, in this article, we have tried to discuss signal complexity and, specifically, the entropy of EEG signals.
6. Conclusion
In our meta-analysis, one single writer had written several of the found articles, and some articles have used a similar database. So there are dependencies between studies, which were solved with one of the approaches used in Abásolo, D., et al. (Abásolo, et al., 2003). However, the disadvantage of this method is that parts of the data would be omitted. The small amount of Q in the various meta-analyses examined indicates the homogeneity of the meta-analysis. Statistical significance was used to determine whether the two groups were significantly different. Despite the importance of these methods, their use in determining this difference is limited. For example, a statistically significant result (P value) will improve by increasing the sample size despite the clinical explanation of the effect size. Also, the P value is greater than 0.01 in the heterogeneity test, so the null hypothesis suggesting that studies are homogeneous is not rejected, and there is no heterogeneity between studies. We applied a funnel plot for the publication bias, indicating no asymmetry in this plot. Therefore, this meta-analysis has no publication bias.
Ethical Considerations
Compliance with ethical guidelines
This article is a meta-analysis with no human or animal sample.
Funding
This research did not receive any grant from funding agencies in the public, commercial, or non-profit sectors.
Authors' contributions
Reviewed and edited the manuscript: Farnaz Ghassemi; Data collection and Writing – original draft: Hajar Ahmadieh; Investigation, Data analysis, and Methodology: Hajar Ahmadieh, Farnaz Ghassemi.
Conflict of interest
The authors declared no conflict of interest.
References
Kumar, A., Singh, A., & Ekavali (2015). A review on Alzheimer’s disease pathophysiology and its management: An update. Pharmacological reports, 67(2), 195–203. [DOI:10.1016/j.pharep.2014.09.004] [PMID]
Alzheimer’s Association (2015). 2015 Alzheimer’s disease facts and figures. Alzheimer’s & Dementia: The Journal of the Alzheimer’s Association, 11(3), 332–384. [PMID]
Yu, R., Topiwala, A., Jacoby, R., & Fazel, S. (2019). Aggressive behaviors in Alzheimer disease and mild cognitive impairment: Systematic review and meta-analysis. The American Journal of Geriatric Psychiatry, 27(3), 290-300. [DOI:10.1016/j.jagp.2018.10.008] [PMID] [PMCID]
Palmer, K., Berger, A. K., Monastero, R., Winblad, B., Bäckman, L., & Fratiglioni, L. (2007). Predictors of progression from mild cognitive impairment to Alzheimer disease. Neurology, 68(19), 1596-1602. [DOI:10.1212/01.wnl.0000260968.92345.3f] [PMID]
Hyman, B. T., Phelps, C. H., Beach, T. G., Bigio, E. H., Cairns, N. J., Carrillo, M. C., et al. (2012). National Institute on Aging-Alzheimer’s Association guidelines for the neuropathologic assessment of Alzheimer’s disease. Alzheimer’s & Dementia: The Journal of the Alzheimer’s Association, 8(1), 1–13. [DOI:10.1016/j.jalz.2011.10.007] [PMID] [PMCID]
Abásolo, D., Hornero, R., Espino, P., Alvarez, D., & Poza, J. (2006). Entropy analysis of the EEG background activity in Alzheimer’s disease patients. Physiological Measurement, 27(3), 241–253. [DOI:10.1088/0967-3334/27/3/003] [PMID]
7Jeong J. (2004). EEG dynamics in patients with Alzheimer’s disease. Clinical Neurophysiology: Official Journal of the International Federation of Clinical Neurophysiology, 115(7), 1490–1505. [DOI:10.1016/j.clinph.2004.01.001] [PMID]
Cooke, A., Smith, D., & Booth, A. (2012). Beyond PICO: The SPIDER tool for qualitative evidence synthesis. Qualitative Health Research, 22(10), 1435-1443. [DOI:10.1177/1049732312452938] [PMID]
Liberati, A., Altman, D. G., Tetzlaff, J., Mulrow, C., Gøtzsche, P. C., Ioannidis, J. P., et al. (2009). The PRISMA statement for reporting systematic reviews and meta-analyses of studies that evaluate health care interventions: Explanation and elaboration. Journal of Clinical Epidemiology, 62(10), e1-e34. [DOI:10.1016/j.jclinepi.2009.06.006] [PMID]
Borenstein, M., Hedges, L., Higgins, J., & Rothstein, H. (2005). Comprehensive meta-analysis version 2. Maryland: National Institutes of Health. https://www.meta-analysis.com/downloads/Meta-Analysis-Manual.pdf
Shin, I. S. (2009). Same author and same data dependence in meta-analysis [PhD dissertation]. Florida: Florida State University. https://diginole.lib.fsu.edu/islandora/object/fsu:168453/datastream/PDF/view
Abásolo1, D., Hornero, R., & Espino, P. (2009). Approximate entropy of EEG background activity in alzheimer’s disease patients. Intelligent Automation & Soft Computing, 15(4), 591-603. [DOI:10.1080/10798587.2009.10643051]
Abásolo, D., Hornero, R., Espino, P., Escudero, J., & Gómez, C. (2007). Electroencephalogram background activity characterization with approximate entropy and auto mutual information in Alzheimer’s disease patients. Annual International Conference of the IEEE Engineering in Medicine and Biology Society. IEEE Engineering in Medicine and Biology Society. Annual International Conference, 2007, 6192–6195. [PMID]
Azami, H., Abásolo, D., Simons, S., & Escudero, J. (2017). Univariate and multivariate generalized multiscale entropy to characterise EEG signals in Alzheimer’s disease. Entropy, 19(1), 31. [DOI:10.3390/e19010031]
Ballard, C., Khan, Z., Clack, H., & Corbett, A. (2011). Nonpharmacological treatment of Alzheimer disease. Canadian Journal of Psychiatry. Revue Canadienne de Psychiatrie, 56(10), 589–595. [DOI:10.1177/070674371105601004] [PMID]
Morabito, F. C., Labate, D., La Foresta, F., Bramanti, A., Morabito, G., & Palamara, I. (2012). Multivariate multi-scale permutation entropy for complexity analysis of Alzheimer’s disease EEG. Entropy, 14(7), 1186-1202. [DOI:10.3390/e14071186]
Al-Nuaimi, A. H., Jammeh, E., Sun, L., & Ifeachor, E. (2015). Tsallis entropy as a biomarker for detection of Alzheimer’s disease. Annual International Conference of the IEEE Engineering in Medicine and Biology Society. IEEE Engineering in Medicine and Biology Society. Annual International Conference, 2015, 4166–4169. [DOI:10.1109/EMBC.2015.7319312] [PMID]
Zhao, P., Van Eetvelt, P., Goh, C., Hudon, N., Wimalaratna, S., & Ifeachor, E. C. (2007). EEG markers of alzheimer’s disease using tsallis entropy. Paper presented at The 3rd International Conference on Computational Intelligence in Medicine and Healthcare (CIMED2007), Plymouth, UK, 25 July 2007. https://www.researchgate.net/profile/Sunil-Wimalaratna/publication/253667093_EEG_MARK.pdf
Abásolo, D., Hornero, R., Espino, P., Alonso, A., & de la Rosa, R. (2003). Electroencephalogram analysis with approximate entropy to help in the diagnosis of Alzheimer’s disease. Paper presented at 4th International IEEE EMBS Special Topic Conference on Information Technology Applications in Biomedicine, Birmingham, UK, 24-26 April 2003. [DOI:10.1109/ITAB.2003.1222516]
Abásolo, D., Hornero, R., Espino, P., Poza, J., Sánchez, C. I., & de la Rosa, R. (2005). Analysis of regularity in the EEG background activity of Alzheimer’s disease patients with Approximate Entropy. Clinical Neurophysiology: Official Journal of the International Federation of Clinical Neurophysiology, 116(8), 1826–1834. [DOI:10.1016/j.clinph.2005.04.001] [PMID]
Escudero, J., Abásolo, D., Hornero, R., Espino, P., & López, M. (2006). Analysis of electroencephalograms in Alzheimer’s disease patients with multiscale entropy. Physiological Measurement, 27(11), 1091-1106. [DOI:10.1088/0967-3334/27/11/004] [PMID]
Jelles, B., Achtereekte, H. A., Slaets, J. P., & Stam, C. J. (1995). Specific patterns of cortical dysfunction in dementia and Parkinson’s disease demonstrated by the acceleration spectrum entropy of the EEG. Clinical EEG (Electroencephalography), 26(4), 188–192. [DOI:10.1177/155005949502600403] [PMID]
Deng, B., Liang, L., Li, S., Wang, R., Yu, H., Wang, J., & Wei, X. (2015). Complexity extraction of electroencephalograms in Alzheimer’s disease with weighted-permutation entropy. Chaos, 25(4), 043105. [DOI:10.1063/1.4917013] [PMID]
Cao, Y., Cai, L., Wang, J., Wang, R., Yu, H., Cao, Y., et al. (2015). Characterization of complexity in the electroencephalograph activity of Alzheimer’s disease based on fuzzy entropy. Chaos, 25(8), 083116. [DOI:10.1063/1.4929148] [PMID]
Hu, Z., & Shi, P. (2006). Regularity and complexity of human electroencephalogram dynamics: Applications to diagnosis of Alzheimers disease. Paper presented at 18th International Conference on Pattern Recognition (ICPR’06), Hong Kong, China, 20-24 August 2006. [DOI:10.1109/ICPR.2006.990]
Morison, G., Tieges, Z., & Kilborn, K. (2012). Multiscale permutation entropy analysis of the EEG in early stage alzheimer’s patients. Paper presented at Conference on Biomedical Engineering and Sciences, Langkawi, Malaysia, 17-19 December 2012. [DOI:10.1109/IECBES.2012.6498191]
Type of Study: Original |
Subject:
Computational Neuroscience
Received: 2020/07/23 | Accepted: 2020/10/3 | Published: 2022/03/1
Received: 2020/07/23 | Accepted: 2020/10/3 | Published: 2022/03/1
Send email to the article author
| Rights and permissions | |
 |
This work is licensed under a Creative Commons Attribution-NonCommercial 4.0 International License. |
![]()
Copyright © The Author(s);
This is an open access article distributed under the terms of the Creative Commons Attribution License (CC-By-NC), which permits use, distribution, and reproduction in any medium, provided the original work is properly cited and is not used for commercial purposes.
Contact Information
