

Volume 12, Issue 2 (March & April 2021)
BCN 2021, 12(2): 269-280 |
Back to browse issues page


Download citation:
BibTeX | RIS | EndNote | Medlars | ProCite | Reference Manager | RefWorks
Send citation to:


BibTeX | RIS | EndNote | Medlars | ProCite | Reference Manager | RefWorks
Send citation to:
Sanjari N, Shalbaf A, Shalbaf R, Sleigh J. Assessment of Anesthesia Depth Using Effective Brain Connectivity Based on Transfer Entropy on EEG Signal. BCN 2021; 12 (2) :269-280
URL: http://bcn.iums.ac.ir/article-1-1844-en.html
URL: http://bcn.iums.ac.ir/article-1-1844-en.html


1- Department of Medical Physics and Biomedical Engineering, School of Medicine, Shahid Beheshti University of Medical Sciences, Tehran, Iran.
2- Institute for Cognitive Science Studies, Tehran, Iran.
3- Department of Anesthesia, Waikato Hospital, Hamilton, New Zealand.
2- Institute for Cognitive Science Studies, Tehran, Iran.
3- Department of Anesthesia, Waikato Hospital, Hamilton, New Zealand.
Full-Text [PDF 924 kb]
| Abstract (HTML)
.jpg)
By combining the Wiener causality concept and the conditional mutual information MI (x.y|z), we present a nonparametric criterion for estimating causal connections with the name of TE (Vicente et al., 2011). Suppose two time series of x(t) and y(t) that (t= 1,…, L) are the observations of two random variables x and y, respectively.or TE(x→y) shows that by assumption knowing the past observation of the random variable x, how much is added to the available information about the random variable y (Vicente et al., 2011) (Formula 13).
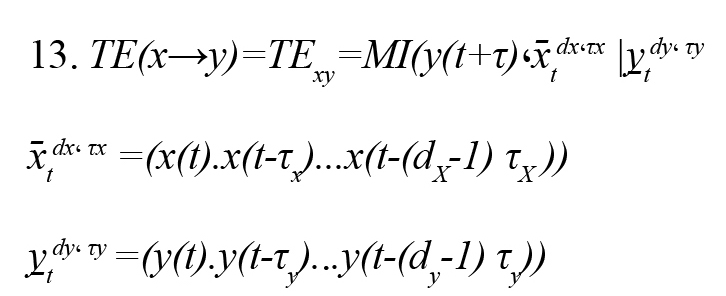
(x̄tdx، τx ) and (y̠tdy، τy ) are the past status vectors and the τX and τY , the present random variable. and are embedding delay x and y and also and are embedding dimensions x and y, respectively. Embedding dimension (d) is the memory of the Markov process in each signal and is estimated by the false nearest neighbors’ method. Also, the embedding delay (τ) is the autocorrelation time of the signal.
2.4. Statistical analysis
Prediction probability statistical method (Pk) (Smith, Dutton, & Smith, 1996) is used to evaluate the ability of the measured index to predict the effective propofol concentration (Ceff) (derived from pharmacokinetic/pharmacodynamic [PK/PD] modeling) (McKay, Voss, Sleigh, Barnard, & Johannsen, 2006) with 2003 Excel software. Given the (Ceff) value S(k) and the effective connectivity index I(k), we choose two data points S(i) and S(j) (S(i) = S(j), (i = j), randomly. Then, we compare the monotony of I(i) and I(j) with the monotony of S(i) and S(j). We repeat the above steps for 500 times, then the is Pk defined as (Formula 14)
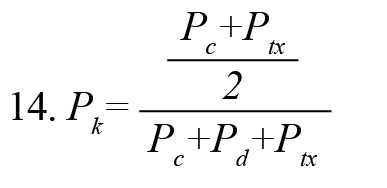
, where , Pc+Pd+Ptx , are the proportions that I(i) and I(j) are concordance, discordance, and an x-only tie, respectively. PK value of 1 indicates that the index can predict (Ceff) correctly 100% of the time, and there is a complete correlation between the index and the depth of anesthesia. Because of abnormal data distribution of the index values, we used the Kruskal-Wallis nonparametric test to determine the statistically significant difference of the index in the awake-unconscious and unconscious-recovery states of all subjects. This test is a series of analysis variance tests used to compare two groups (or more) of the statistical society. The value of the P is a criterion of a significance test.
3. Results
We computed the effective connectivity between two dipolar EEG signals at positions of Fp1– F7 and C3– T3 using TE index in 10-s windows for the entire period. For comparison, we have calculated two other methods of effective connectivity methods, i.e. GC and PDC methods, which have been used to study multi-channel EEG signals. The calculated values of the indexes for a subject and simultaneously the corresponding BIS and Ceff are demonstrated in Figure 3..jpg)
TE index follows the changes in the propofol drug effect effectively. While GC and PDC indexes fail to track the changes due to their linear analysis methods. Figure 4 shows the scatter plot of TE and BIS in eight volunteers (1072 data points).
.jpg)
Data are fitted by a linear line as TE =1.48×BIS-0.61. Also, TE and BIS in all subjects during the whole procedure have the Pearson correlation coefficient of 0.88 that shows the high relationship between these two indexes.
The results show that the propofol significantly decreases both TE and BIS index in a concentration-dependent manner. But, the TE index tracks faster than BIS during the change from awake to unconscious status in 8 subjects (average of 68 s) and has a shorter delay. Also, the BIS index shows some irregular upward trends about 290-340th s and 360-400th s, while this deviation is less seen in the TE index. So, the TE index is more robust than BIS to artifacts.
To evaluate the ability of Ceff prediction of using the proposed method, is computed for all subjects. According to Table 1, the Pk values of GC, PDC, BIS, and TE indexes with Ceff are 0.46, 0.59, 0.75, and 0.84, respectively.
.jpg)
TE has the highest value of Pk among effective connectivity indexes. Also, Pk value between the TE index and the Ceff (0.84) is higher than BIS and Ceff (0.75) which represents the ability of this index to predict Ceff flawlessly. The significance of differences between Pk s is tested statistically using the paired t-test. This difference between TE with other indices is statistically significant (P<0.001) and implies that TE has a convincing ability to follow the propofol effect-site concentrations. Moreover, the relationship between BIS and TE values with effect-site drug concentration Ceff is demonstrated for the same subject in Figure 5.
.jpg)
A sigmoid curve is fitted to the data that describes the relationship between the index and drug concentration effect. As shown in this Figure, with increasing drug concentration, both indexes (BIS, TE) decrease uniformly. The goodness-of-fit between the TE and the Ceff (R2=0.931) is significantly higher than that between BIS and Ceff (R2=0.851).
The ability of the presented index to differentiate awake, unconscious, and recovery states is very important for DOA monitoring. GC, PDC, BIS, and TE index over 10-s windows at these three states are computed. Figure 6 shows the box plots of these computed indexes.
.jpg)
As seen in Figure 6, the variability in TE compared to the BIS index is significantly smaller at the unconscious and recovery states. It demonstrates that the TE index had more robustness to noise during the anesthesia. Moreover, as you can see in Table 1, the TE index performed better in following the Ceff than BIS and the variability in Pk value of TE index compared to BIS index is significantly smaller. It demonstrates that the sensitivity of the TE index to noise is lower than BIS. To evaluate the significant difference, we used the Kruskal-Wallis test, and the P value of each index was determined in different anesthesia states (Table 2).
.jpg)
As you see in Figure 6 and Table 2, TE could differentiate awake-unconscious and unconscious-recovery states very well. However, other connectivity indexes cannot make a difference appropriately, particularly between unconscious and recovery states. Finally, TE rather than BIS index has a lower P value at awake-unconscious states and also in unconscious-recovery states that indicate its superiority over BIS.
4. Discussion
We presented a new nonparametric and nonlinear effective connectivity approach called TE index between two dipolar EEG signals at positions of Fp1–F7 and C3–T3 as a significant index for describing the neurophysiological mechanisms of anesthetic drugs during anesthesia. This index can significantly trace the changes of propofol drug effect-site and recognize well the awake-unconscious states, as well as unconscious-recovery states of the patient while other effective connectivity indexes (GC, PDC) fails to trace changes during anesthesia (Figures 3, 6; Tables 1, 2). So, the TE indicator is a suitable measure to evaluate the dynamic signal EEG during anesthesia.
Different statistical methods have been presented for estimating the causal or brain effective connectivity. GC methods limit the causal connections pattern to specific templates based on the estimation of linear parameters of the MVAR model for individual signal data. While the dynamics of brain connections are unclear and it is difficult to simply isolate the nature of brain connections with a predetermined limiting model. Consequently, using these methods leads to an incorrect estimating of brain connection, and nonlinear methods of effective connectivity must be used. By combining the Wiener causality concept and the conditional mutual information in the context of information theory, we present an important nonparametric and nonlinear criterion for estimating causal connections, i.e. TE. This index does not assume any particular model and can define linear and nonlinear connections existing in a system quantitatively. TE needs much less computational time (0.21 s) than GC (0.47 s) and PDC (0.53 s) and, due to its nonlinear nature, can appropriately identify directional connectivity (Vicente et al., 2011). So, TE as a nonlinear effective connectivity method is a powerful tool for understanding the neurophysiological mechanisms of anesthetics.
Nonlinear effective connectivity in neuronal networks is an essential feature for finding the interaction between separate cortical signals in different brain regions. Propofol changes the information flow in the brain and the process of losing consciousness and awareness during the anesthesia period to decrease intravenous. So, the results show that the TE index has a good ability to trace the changes of propofol drug effect-site during the entire experiments.
The result shows that TE index compared to BIS (as an anesthesia depth commercial monitor based on the single channel of EEG) has several advantages. First, BIS calculation is very complex and takes more time than our method. Second, unlike BIS, the TE index is much more resistant to noise without complex calculations. Third, the TE index responds faster reaction (about 68 s) on the change from awake to unconscious state. Fourth, the TE index has less irregularity than BIS in the unconscious state during the anesthesia (Figure 3). Fifth, the TE index can discriminate different states of unconsciousness better than BIS (Figure 6, Table 2). Finally, based on the statistical method of and goodness-of-fit R2, TE index has a higher correlation coefficient with the Ceff than BIS index (Table 1, Figure 5). All advantages mentioned in this section represent that the TE index estimates the drug concentration dynamic better than the BIS index. Also, there is some information in the connection between EEG channels that cannot be extracted from only one EEG channel in BIS calculation.
The following two points should be considered in the future. In this study, EEG signals were evaluated in only 8 subjects with propofol anesthesia. It is better to record more subjects. Although, noteworthy results demonstrate that the differences are comparatively substantial. Second, due to the recorded limitations of EEG in the operation room, only two channels of EEG from the frontal and temporal parts of the brain were recorded. It is better to use several EEG channels and select the best choice to evaluate the anesthesia depth better.
This study shows that the nonlinear effective connectivity index, called TE between pair signals of EEG at frontal and temporal regions, can effectively trace the changes in propofol drug effect and estimates the patient’s unconscious states. TE index is also better than BIS as a single channel commercial index in the clinical setting due to its faster response and higher correlation with the drug concentration effect-site, less irregularity in the unconscious state, and a better ability to discriminate between the three states of anesthesia. Thus, the TE index is a confident and effective connectivity indicator for designing a new monitoring system of two EEG channels for the depth of anesthesia estimation.
Ethical Considerations
Compliance with ethical guidelines
All study procedures involving human participants were following the ethical standards of the Institutional Research Committee with the 1964 Helsinki Declaration. This study received Ethics Committee approval from Waikato Hospital, New Zealand. Informed written consent was obtained from all study patients.
Funding
The article is supported by Research Department of School of Medicine Shahid Beheshti University of Medical Sciences (Grant No.: 13730).
Authors' contributions
Conceptualization, methodology, investigation, writing- reviewing and editing, and validation: All authors; Supervision: Ahmad Shalbaf; Writing- original draft preparation: Neda Sanjari, Ahmad Shalbaf.
Conflict of interest
The authors declared no conflicts of interest.
References
Afshani, F., Shalbaf, A., Shalbaf, R., & Sleigh, J. (2019). Frontal-temporal functional connectivity of EEG signal by standardized permutation mutual information during anesthesia. Cognitive Neurodynamics, 13(6), 531-40. [DOI:10.1007/s11571-019-09553-w] [PMID] [PMCID]
Akeju, O., Westover, M. B., Pavone, K. J., Sampson, A. L., Hartnack, K. E., & Brown, E. N., et al. (2014). Effects of sevoflurane and propofol on frontal electroencephalogram power and coherence. Anesthesiology, 121(5), 990-8. [DOI:10.1097/ALN.0000000000000436] [PMID] [PMCID]
Alkire, M. T., Hudetz, A. G., & Tononi, G. (2008). Consciousness and anesthesia. Science, 322(5903), 876-80. [DOI:10.1126/science.1149213] [PMID] [PMCID]
Astolfi, L., Cincotti, F., Mattia, D., Marciani, M. G., Baccala, L. A., & de Vico Fallani, F., et al. (2007). Comparison of different cortical connectivity estimators for high‐resolution EEG recordings. Human Brain Mapping, 28(2), 143-57. [DOI:10.1002/hbm.20263] [PMID] [PMCID]
Baccalá, L. A., & Sameshima, K. (2001). Partial directed coherence: A new concept in neural structure determination. Biological Cybernetics, 84(6), 463-74. [DOI:10.1007/PL00007990] [PMID]
Gao, Y., Ren, L., Li, R., & Zhang, Y. (2018). Electroencephalogram-electromyography coupling analysis in stroke based on symbolic transfer entropy. Frontiers in Neurology, 8, 716. [DOI:10.3389/fneur.2017.00716] [PMID] [PMCID]
Gugino, L., Chabot, R., Prichep, L., John, E., Formanek, V., & Aglio, L. (2001). Quantitative EEG changes associated with loss and return of consciousness in healthy adult volunteers anaesthetized with propofol or sevoflurane. British Journal of Anaesthesia, 87(3), 421-8. [DOI:10.1093/bja/87.3.421] [PMID]
Hagihira, S., Takashina, M., Mori, T., Mashimo, T., & Yoshiya, I. (2001). Practical issues in bispectral analysis of electroencephalographic signals. Anesthesia & Analgesia, 93(4), 966-70. [DOI:10.1097/00000539-200110000-00032] [PMID]
Hayashi, K., Mukai, N., & Sawa, T. (2014). Simultaneous bicoherence analysis of occipital and frontal electroencephalograms in awake and anesthetized subjects. Clinical Neurophysiology, 125(1), 194-201. [DOI:10.1016/j.clinph.2013.06.024] [PMID]
Huang, C. S., Pal, N. R., Chuang, C. H., & Lin, C. T. (2015). Identifying changes in EEG information transfer during drowsy driving by transfer entropy. Frontiers in Human Neuroscience, 9, 570. [DOI:10.3389/fnhum.2015.00570] [PMID] [PMCID]
Johansen, J. W., Sebel, P. S., & Fisher, D. M. (2000). Development and clinical application of electroencephalographic bispectrum monitoring. The Journal of the American Society of Anesthesiologists, 93(5), 1336-44. [DOI:10.1097/00000542-200011000-00029] [PMID]
Kamiński, M., Ding, M., Truccolo, W. A., & Bressler, S. L. (2001). Evaluating causal relations in neural systems: Granger causality, directed transfer function and statistical assessment of significance. Biological Cybernetics, 85(2), 145-57. [DOI:10.1007/s004220000235] [PMID]
Lang, E. W., Tomé, A. M., Keck, I. R., Górriz-Sáez, J., & Puntonet, C. G. (2012). Brain connectivity analysis: A short survey. Computational Intelligence and Neuroscience, 2012, 2012:412512. [DOI:10.1155/2012/412512] [PMID] [PMCID]
Lee, J., Nemati, S., Silva, I., Edwards, B. A., Butler, J. P., & Malhotra, A. (2012). Transfer entropy estimation and directional coupling change detection in biomedical time series. Biomedical Engineering Online, 11(1), 19. [DOI:10.1186/1475-925X-11-19] [PMID] [PMCID]
Lee, U., Kim, S., Noh, G. J., Choi, B. M., Hwang, E., & Mashour, G. A. (2009). The directionality and functional organization of frontoparietal connectivity during consciousness and anesthesia in humans. Consciousness and Cognition, 18(4), 1069-78. [DOI:10.1016/j.concog.2009.04.004] [PMID]
Lee, U., Kim, S., Noh, G.J., Choi, B.M., & Mashour, G. A. (2008). Propofol induction reduces the capacity for neural information integration: Implications for the mechanism of consciousness and general anesthesia. Nature Precedings, 1-30. [DOI:10.1038/npre.2008.1244.2]
Li, D., Hambrecht-Wiedbusch, V. S., & Mashour, G. A. (2017). Accelerated recovery of consciousness after general anesthesia is associated with increased functional brain connectivity in the high-gamma bandwidth. Frontiers in Systems Neuroscience, 11, 16. [DOI:10.3389/fnsys.2017.00016] [PMID] [PMCID]
Li, T., & Wen, P. (2016). Depth of anaesthesia assessment using interval second-order difference plot and permutation entropy techniques. IET Signal Processing, 11(2), 221-7. [DOI:10.1049/iet-spr.2015.0114]
Li, X., Wang, F., & Wu, G. (2017). Monitoring depth of anesthesia using detrended fluctuation analysis based on EEG signals. Journal of Medical and Biological Engineering, 37(2), 171-80. [DOI:10.1007/s40846-016-0196-y]
Liang, Z., Ren, Y., Yan, J., Li, D., Voss, L. J., & Sleigh, J. W., et al. (2016). A comparison of different synchronization measures in electroencephalogram during propofol anesthesia. Journal of Clinical Monitoring and Computing, 30(4), 451-66. [DOI:10.1007/s10877-015-9738-z] [PMID]
Liang, Z., Wang, Y., Sun, X., Li, D., Voss, L. J., & Sleigh, J. W., et al. (2015). EEG entropy measures in anesthesia. Frontiers in Computational Neuroscience, 9, 16. [DOI:10.3389/fncom.2015.00016] [PMID] [PMCID]
Liu, Q., Chen, Y. F., Fan, S. Z., Abbod, M. F., & Shieh, J. S. (2016). Improved spectrum analysis in EEG for measure of depth of anesthesia based on phase-rectified signal averaging. Physiological Measurement, 38(2), 116. [DOI:10.1088/1361-6579/38/2/116] [PMID]
Liu, Q., Chen, Y. F., Fan, S. Z., Abbod, M. F., & Shieh, J. S. (2017). Quasi-periodicities detection using phase-rectified signal averaging in EEG signals as a depth of anesthesia monitor. IEEE Transactions on Neural Systems and Rehabilitation Engineering, 25(10), 1773-84. [DOI:10.1109/TNSRE.2017.2690449] [PMID]
McKay, I. D., Voss, L. J., Sleigh, J. W., Barnard, J. P., & Johannsen, E. K. (2006). Pharmacokinetic-pharmacodynamic modeling the hypnotic effect of sevoflurane using the spectral entropy of the electroencephalogram. Anesthesia & Analgesia, 102(1), 91-7. [DOI:10.1213/01.ane.0000184825.65124.24] [PMID]
Monk, T. G., Saini, V., Weldon, B. C., & Sigl, J. C. (2005). Anesthetic management and one-year mortality after noncardiac surgery. Anesthesia & Analgesia, 100(1), 4-10. [DOI:10.1213/01.ANE.0000147519.82841.5E] [PMID]
Nallasamy, N., & Tsao, D. Y. (2011). Functional connectivity in the brain: effects of anesthesia. The Neuroscientist, 17(1), 94-106. [DOI:10.1177/1073858410374126] [PMID]
Nguyen-Ky, T., Wen, P., & Li, Y. (2010). An improved detrended moving-average method for monitoring the depth of anesthesia. IEEE Transactions on Biomedical Engineering, 57(10), 2369-78. [DOI:10.1109/TBME.2010.2053929] [PMID]
Nguyen-Ky, T., Wen, P., & Li, Y. (2013). Consciousness and depth of anesthesia assessment based on Bayesian analysis of EEG signals. IEEE Transactions on Biomedical Engineering, 60(6), 1488-98. [DOI:10.1109/TBME.2012.2236649] [PMID]
Nguyen-Ky, T., Wen, P., & Li, Y. (2014). Monitoring the depth of anaesthesia using Hurst exponent and Bayesian methods. IET Signal Processing, 8(9), 907-17. [DOI:10.1049/iet-spr.2013.0113]
Nicolaou, N., & Georgiou, J. (2014). Spatial analytic phase difference of EEG activity during anesthetic-induced unconsciousness. Clinical Neurophysiology, 125(10), 2122-31. [DOI:10.1016/j.clinph.2014.02.011] [PMID]
Niso, G., Bruña, R., Pereda, E., Gutiérrez, R., Bajo, R., & Maestú, F., et al. (2013). HERMES: towards an integrated toolbox to characterize functional and effective brain connectivity. Neuroinformatics, 11(4), 405-34. [DOI:10.1007/s12021-013-9186-1] [PMID]
Pilge, S., Zanner, R., Schneider, G., Blum, J., Kreuzer, M., & Kochs, E. F. (2006). Time delay of index calculation: analysis of cerebral state, bispectral, and narcotrend indices. The Journal of the American Society of Anesthesiologists, 104(3), 488-94. [DOI:10.1097/00000542-200603000-00016] [PMID]
Schrouff, J., Perlbarg, V., Boly, M., Marrelec, G., Boveroux, P., & Vanhaudenhuyse, A., et al. (2011). Brain functional integration decreases during propofol-induced loss of consciousness. NeuroImage, 57(1), 198-205. [DOI:10.1016/j.neuroimage.2011.04.020] [PMID]
Sebel, P. S., Bowdle, T. A., Ghoneim, M. M., Rampil, I. J., Padilla, R. E., & Gan, T. J., et al. (2004). The incidence of awareness during anesthesia: A multicenter United States study. Anesthesia & Analgesia, 99(3), 833-9. [DOI:10.1213/01.ANE.0000130261.90896.6C] [PMID]
Shalbaf, A., Saffar, M., Sleigh, J. W., & Shalbaf, R. (2017). Monitoring the depth of anesthesia using a new adaptive neurofuzzy system. IEEE Journal of Biomedical and Health Informatics, 22(3), 671-7. [DOI:10.1109/JBHI.2017.2709841] [PMID]
Shalbaf, A., Shalbaf, R., Saffar, M., & Sleigh, J. (2020). Monitoring the level of hypnosis using a hierarchical SVM system. Journal of Clinical Monitoring and Computing, 34(2), 331-8. [DOI:10.1007/s10877-019-00311-1] [PMID]
Smith, W. D., Dutton, R. C., & Smith, T. N. (1996). Measuring the performance of anesthetic depth indicators. The Journal of the American Society of Anesthesiologists, 84(1), 38-51. [DOI:10.1097/00000542-199601000-00005] [PMID]
Vicente, R., Wibral, M., Lindner, M., & Pipa, G. (2011). Transfer entropy-a model-free measure of effective connectivity for the neurosciences. Journal of Computational Neuroscience, 30(1), 45-67. [DOI:10.1007/s10827-010-0262-3] [PMID] [PMCID]
Williams, M., & Sleigh, J. (1999). Auditory recall and response to command during recovery from propofol anaesthesia. Anaesthesia and Intensive care, 27(3), 265-8. [DOI:10.1177/0310057X9902700307] [PMID]
Yang, C., Jeannès, R. L. B., Bellanger, J. J., & Shu, H. (2012). A new strategy for model order identification and its application to transfer entropy for EEG signals analysis. IEEE Transactions on Biomedical Engineering, 60(5), 1318-27. [DOI:10.1109/TBME.2012.2234125] [PMID]
Full-Text:
1. Introduction
Depth of Anesthesia (DOA) is the main issue for anesthesiologists to reduce the use of anesthetics, maintain the appropriate level of anesthesia during surgery, prevent unwanted consciousness (Gugino et al., 2001; Sebel et al., 2004), and avoid long-term recovery (Monk, Saini, Weldon, & Sigl, 2005). Since the main target of anesthetic drugs is the synaptic activity of the central nervous system, monitoring brain signals such as Electroencephalogram (EEG) can be helpful to predict the patient’s state of consciousness during anesthesia.
In recent years, several nonlinear methods based on single-channel EEG signals such as fractal dimension (Li et al., 2017; Nguyen, Wen, & Li, 2010), Bayesian analysis (Nguyen-Ky, Wen, & Li, 2013, Nguyen-Ky, Wen, & Li, 2014), phase-rectified signal averaging (Liu, Chen, Fan, Abbod, & Shieh, 2016; Liu, Chen, Fan, Abbod, & Shieh, 2017) and entropy (Li & Wen, 2016; Liang et al., 2015; Shalbaf, Saffar, Sleigh, & Shalbaf, 2017; Shalbaf, Saffar, & Sleigh, 2020) have been proposed for DOA assessment. Today, Bispectral index (BIS) monitoring is the most commonly used single-channel EEG to measure DOA during general anesthesia and has been widely accepted for its accuracy. But this monitor is sensitive to artifacts (Nguyen-Ky et al., 2013), does not respond to some anesthetics (Johansen, Sebel, & Fisher, 2000), and has a long delay in responding to EEG changes (Hagihira,Takashina, Mori, Mashimo, & Yoshiya, 2001; Pilge et al., 2006).
It is essential to study how the communications of different brain regions in general anesthesia are changed. Anesthesia disrupts the interaction between cortical brain regions (Alkire, Hudetz, & Tononi, 2008; Lee et al., 2009; Lee, Kim, Noh, Choi, & Mashour, 2008; Nallasamy & Tsao, 2011; Schrouff et al., 2011), and as a result, it damages the proper functioning of the brain, especially the perception of consciousness (Alkire et al., 2008; Schrouff et al., 2011). Therefore, disconnecting or altering the communication between brain regions, especially frontal to temporal regions (Lee et al., 2009), can be a key factor in the anesthesia process.
Nowadays, there is a new and advanced concept in brain integration that focuses on brain connectivity (Lang, Tomé, Keck, Górriz-Sáez, & Puntonet, 2012). This field of neuroscience allows researchers to obtain more comprehensive information about brain function. The broad field of brain connectivity has two general subdivisions: (1) functional connectivity, which deals with the functionally integrated relationship between spatially separated brain regions, and (2) effective connectivity, which characterizes the transient causal interactions among brain regions. Numerous functional connectivity methods such as cross-correlation, phase-locking value, and mutual information have been proposed to evaluate the relationship between simultaneous signals during general anesthesia (Afshani, Shalbaf, Shalba, & Sleigh, 2019; Akeju et al., 2014; Hayashi, Mukai, & Sawa, 2014; Li et al., 2017; Liang et al., 2016; Nicolaou & Georgiou, 2014). But, these techniques are only based on changes in statistical correlations between indirect observations of neuronal activities. So, nonlinear effective connectivity methods which characterize the transient causal interactions among brain regions might be more helpful in studying the mechanisms of anesthetics. By combining the Wiener causality concept and the conditional mutual information in the context of information theory, we present a nonparametric and nonlinear criterion for estimating causal connections, i.e. Transfer Entropy (TE), which can measure all linear and nonlinear causal connections in a system (Vicente, Wibral, Lindner, & Pipa, 2011). This method does not need a priori assumptions on connectivity patterns and recently, has become popular and widely applied for analyzing multi-channel EEG signals (Gao, Ren, Li, & Zhang, 2018; Huang, Pal, Chuang, & Lin, 2015; Lee et al., 2012; Wibral, Vicente, & Lindner, 2014; Yang, Jeannès, Bellanger, & Shu, 2012).
The main novelty of this study is to use an effective connectivity method, i.e. the TE index, to investigate the nonlinear relationships of 2-channel EEG in the frontal and temporal regions during anesthesia. We have used this new index for following the anesthetic drug concentration and monitoring DOA during surgery. We finally compare it with the BIS index as a commercial monitor based on single-channel EEG.
2. Methods
2.1. Subjects and data acquisition
EEG data of 8 volunteers (5 men and 3 women, aged 18-42 years) under propofol anesthesia were recorded with the approval of the Waikato Hospital Ethics Committee (Williams & Sleigh, 1999). Two dipolar EEG signals were used at positions of Fp1– F7 and C3– T3 and also FpZ as the reference electrode. Using these electrodes, we recorded the action potentials of the left frontal and temporal regions. The EEG signals, as well as the BIS index, were recorded using an A-1000 BIS monitor (Aspect Medical Systems) at a sampling rate of 256 Hz and 0.2 Hz, respectively. The low-pass and high-pass filters were set at 0.5 and 70 Hz, respectively. The BIS index value ranged between 0 and 100, but it is considered between 0 and 1 to compare it with other indexes.
After safe access to the relevant vein, all volunteers received propofol anesthetic drug at a constant concentration of 150 mL/h by a syringe pump continuously. The 2-channel EEG and BIS index were recorded simultaneously with the start of injection. Then a verbal list of different objects is read at 30-s intervals. The endpoint of the injection is where the filled water syringe dropped from the fingers of the sample. This moment is marked as the Loss of Consciousness (LOC) time. Then, the volunteer is allowed to go through the process of waking up and play a pre-recorded tape containing some simple verbal commands such as “right foot movement”. The recovery time (command time) is recorded as soon as the volunteer can answer correctly to the relevant command. Sixty seconds after recovery time, the study was ended. Finally, the samples were asked to recall the first number and the last object they recall when propofol was induced, and these two times were recorded as “number time”, and “object time”, respectively. So in this study, three states named awake (before object time), unconscious (after LOC time and before number time), and recovery (after command or recovery time) are assessed. Figure 1 shows the position of the electrodes on the head and the sequence diagram of the experimental design.
.jpg)
2.2. Effect-site concentration (Ceff)
The concentration of injection anesthetic drugs in the blood is acquired approximately. By sampling venous blood from the patient’s arm, the anesthetic drug concentration in the blood can be assessed by laboratory equipment (Williams & Sleigh, 1999). Sampling is performed continuously, and the blood concentration of the anesthetic is acquiring continuously with the analyzer. The effect-site concentration Ceff of the anesthetic for each volunteer is calculated using VA-SIM application (Sainsbury, 1993).
2.3. Effective connectivity
Effective or causal connectivity is a new and growing topic in modern neuroscience to study the mechanisms of brain communication based on its potential to describe causal interactions (Astolfi et al., 2007; Lang et al., 2012). This branch of neuroscience offers more comprehensive information on brain function and better diagnostic and therapeutic strategies for brain patients. These techniques are proposed to determine directional influences between any pair of EEG channels. All effective connectivity estimation was done in MATLAB (The MathWorks, Inc., Natick, MA, USA) via the open-source HERMES toolbox (Niso et al., 2013).
2.3.1. Granger Causality (GC)
A popular statistical method for estimating the effective connectivity is Granger Causality (GC) which is a data-driven method (Kamiński, Ding, Truccolo, & Bressler 2001). It is based on the estimation of parameters of the Multi-Variable Auto-Regressive (MVAR) model and is widely used to explain causality between two time series. For N simultaneously observed stationary time series X(t) (Formula 1), i.e.
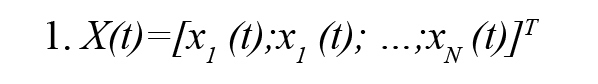
The MVAR model process of order P is an expressive description of the X(t) and given by (Formula 2)
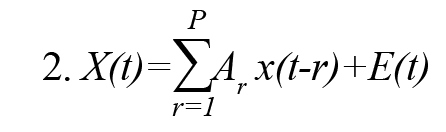
In this Model, E(t) is a zero mean white noise process, and P represents the order of the model. Ar is the autoregressive coefficients matrix and its elements aij (r) describe the linear relationship between time series, xj (t) and xi (t) at different time lags r and indicates the influence of xj (t) on xi (t). A process xj (t) is said to Granger-cause another process xi (t) if the elements aij (r) are not all zero.
2.3.2. Partial Directed Coherence (PDC)
One of the quantitative spectral measures of GC in the frequency domain is Partial Directed Coherence (PDC) (Baccalá & Sameshima, 2001). PDC is a complex measure that can be interpreted as the conditional GC from j to i. This method is to determine the direction of information flow between pairs of time series-based frequency domains. PDC from the ith channel to the jth channel jth at frequency f is defined Formulas 3 and 4:
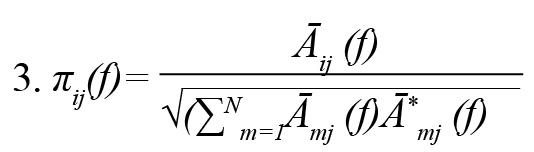
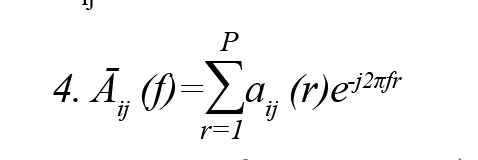
Āij (f), where is frequency domain description of .
2.3.3. Transfer Entropy (TE)
By combining the Wiener causality concept and the conditional mutual information in the context of information theory, we present an essential nonparametric criterion, i.e. Transfer Entropy (TE), for estimating causal connections. It can measure all linear and nonlinear causal connections in a system (Vicente et al., 2011).
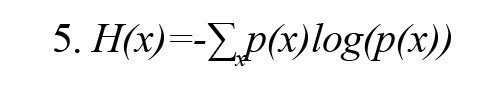
Shannon entropy H(x) with probability density function p(x) for a variable x is defined as (Vicente et al., 2011) (Formula 5):
MI(x, y) demonstrates the mutual information between x and y, two discrete variables, and is defined by Formula 6.
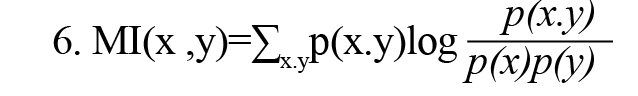
In Formula 2, p(x) and p(y) are the probability density functions, and p(x,y) is also the joint probability density function. MI(x, y) measures the amount of information obtained by observing each random variable x or y relative to another and is equal to zero if and only if the random variables x and y are independent. As a result, MI(x, y) can measure the result of linear and nonlinear dependencies between random variables x and y. MI(x, y) can be rewritten using the concept of Shannon entropy according to Formula 7 (Vicente et al., 2011).
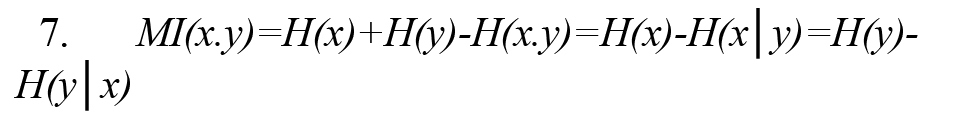
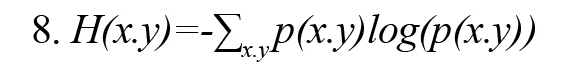
In Formula 3, H (x, y) is the joint entropy defined as Formula 8. Also, the conditional entropies H(x|y) and H(y|x) are defined by Formulas 9 and 10, respectively (Vicente et al., 2011):
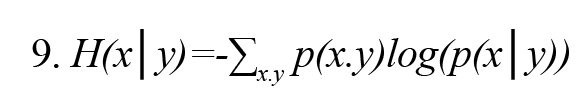
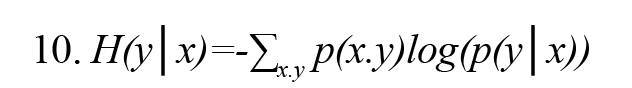
In Formulas 9 and 10, p(x│y) and p(y│x) are the conditional probability density function x on condition y and y on condition x, respectively.
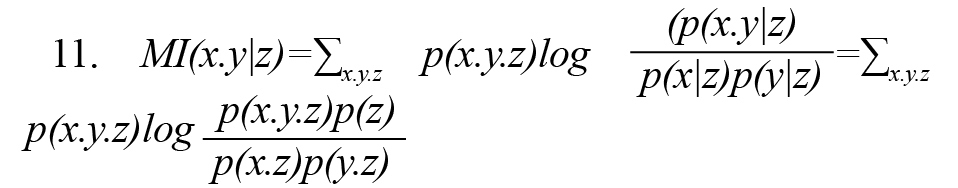
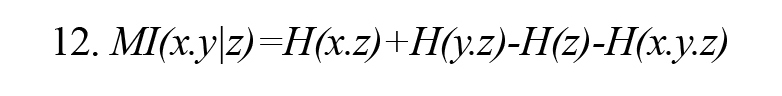
Conditional mutual information MI (x.y|z) (or partial mutual information) is conditional on observing the random variable z on random variables x and y and is calculated by either of Formulas 11 and 12 (Vicente et al., 2011).Figure 2 illustrates the concept of conditional mutual information symbolically.
Depth of Anesthesia (DOA) is the main issue for anesthesiologists to reduce the use of anesthetics, maintain the appropriate level of anesthesia during surgery, prevent unwanted consciousness (Gugino et al., 2001; Sebel et al., 2004), and avoid long-term recovery (Monk, Saini, Weldon, & Sigl, 2005). Since the main target of anesthetic drugs is the synaptic activity of the central nervous system, monitoring brain signals such as Electroencephalogram (EEG) can be helpful to predict the patient’s state of consciousness during anesthesia.
In recent years, several nonlinear methods based on single-channel EEG signals such as fractal dimension (Li et al., 2017; Nguyen, Wen, & Li, 2010), Bayesian analysis (Nguyen-Ky, Wen, & Li, 2013, Nguyen-Ky, Wen, & Li, 2014), phase-rectified signal averaging (Liu, Chen, Fan, Abbod, & Shieh, 2016; Liu, Chen, Fan, Abbod, & Shieh, 2017) and entropy (Li & Wen, 2016; Liang et al., 2015; Shalbaf, Saffar, Sleigh, & Shalbaf, 2017; Shalbaf, Saffar, & Sleigh, 2020) have been proposed for DOA assessment. Today, Bispectral index (BIS) monitoring is the most commonly used single-channel EEG to measure DOA during general anesthesia and has been widely accepted for its accuracy. But this monitor is sensitive to artifacts (Nguyen-Ky et al., 2013), does not respond to some anesthetics (Johansen, Sebel, & Fisher, 2000), and has a long delay in responding to EEG changes (Hagihira,Takashina, Mori, Mashimo, & Yoshiya, 2001; Pilge et al., 2006).
It is essential to study how the communications of different brain regions in general anesthesia are changed. Anesthesia disrupts the interaction between cortical brain regions (Alkire, Hudetz, & Tononi, 2008; Lee et al., 2009; Lee, Kim, Noh, Choi, & Mashour, 2008; Nallasamy & Tsao, 2011; Schrouff et al., 2011), and as a result, it damages the proper functioning of the brain, especially the perception of consciousness (Alkire et al., 2008; Schrouff et al., 2011). Therefore, disconnecting or altering the communication between brain regions, especially frontal to temporal regions (Lee et al., 2009), can be a key factor in the anesthesia process.
Nowadays, there is a new and advanced concept in brain integration that focuses on brain connectivity (Lang, Tomé, Keck, Górriz-Sáez, & Puntonet, 2012). This field of neuroscience allows researchers to obtain more comprehensive information about brain function. The broad field of brain connectivity has two general subdivisions: (1) functional connectivity, which deals with the functionally integrated relationship between spatially separated brain regions, and (2) effective connectivity, which characterizes the transient causal interactions among brain regions. Numerous functional connectivity methods such as cross-correlation, phase-locking value, and mutual information have been proposed to evaluate the relationship between simultaneous signals during general anesthesia (Afshani, Shalbaf, Shalba, & Sleigh, 2019; Akeju et al., 2014; Hayashi, Mukai, & Sawa, 2014; Li et al., 2017; Liang et al., 2016; Nicolaou & Georgiou, 2014). But, these techniques are only based on changes in statistical correlations between indirect observations of neuronal activities. So, nonlinear effective connectivity methods which characterize the transient causal interactions among brain regions might be more helpful in studying the mechanisms of anesthetics. By combining the Wiener causality concept and the conditional mutual information in the context of information theory, we present a nonparametric and nonlinear criterion for estimating causal connections, i.e. Transfer Entropy (TE), which can measure all linear and nonlinear causal connections in a system (Vicente, Wibral, Lindner, & Pipa, 2011). This method does not need a priori assumptions on connectivity patterns and recently, has become popular and widely applied for analyzing multi-channel EEG signals (Gao, Ren, Li, & Zhang, 2018; Huang, Pal, Chuang, & Lin, 2015; Lee et al., 2012; Wibral, Vicente, & Lindner, 2014; Yang, Jeannès, Bellanger, & Shu, 2012).
The main novelty of this study is to use an effective connectivity method, i.e. the TE index, to investigate the nonlinear relationships of 2-channel EEG in the frontal and temporal regions during anesthesia. We have used this new index for following the anesthetic drug concentration and monitoring DOA during surgery. We finally compare it with the BIS index as a commercial monitor based on single-channel EEG.
2. Methods
2.1. Subjects and data acquisition
EEG data of 8 volunteers (5 men and 3 women, aged 18-42 years) under propofol anesthesia were recorded with the approval of the Waikato Hospital Ethics Committee (Williams & Sleigh, 1999). Two dipolar EEG signals were used at positions of Fp1– F7 and C3– T3 and also FpZ as the reference electrode. Using these electrodes, we recorded the action potentials of the left frontal and temporal regions. The EEG signals, as well as the BIS index, were recorded using an A-1000 BIS monitor (Aspect Medical Systems) at a sampling rate of 256 Hz and 0.2 Hz, respectively. The low-pass and high-pass filters were set at 0.5 and 70 Hz, respectively. The BIS index value ranged between 0 and 100, but it is considered between 0 and 1 to compare it with other indexes.
After safe access to the relevant vein, all volunteers received propofol anesthetic drug at a constant concentration of 150 mL/h by a syringe pump continuously. The 2-channel EEG and BIS index were recorded simultaneously with the start of injection. Then a verbal list of different objects is read at 30-s intervals. The endpoint of the injection is where the filled water syringe dropped from the fingers of the sample. This moment is marked as the Loss of Consciousness (LOC) time. Then, the volunteer is allowed to go through the process of waking up and play a pre-recorded tape containing some simple verbal commands such as “right foot movement”. The recovery time (command time) is recorded as soon as the volunteer can answer correctly to the relevant command. Sixty seconds after recovery time, the study was ended. Finally, the samples were asked to recall the first number and the last object they recall when propofol was induced, and these two times were recorded as “number time”, and “object time”, respectively. So in this study, three states named awake (before object time), unconscious (after LOC time and before number time), and recovery (after command or recovery time) are assessed. Figure 1 shows the position of the electrodes on the head and the sequence diagram of the experimental design.
2.2. Effect-site concentration (Ceff)
The concentration of injection anesthetic drugs in the blood is acquired approximately. By sampling venous blood from the patient’s arm, the anesthetic drug concentration in the blood can be assessed by laboratory equipment (Williams & Sleigh, 1999). Sampling is performed continuously, and the blood concentration of the anesthetic is acquiring continuously with the analyzer. The effect-site concentration Ceff of the anesthetic for each volunteer is calculated using VA-SIM application (Sainsbury, 1993).
2.3. Effective connectivity
Effective or causal connectivity is a new and growing topic in modern neuroscience to study the mechanisms of brain communication based on its potential to describe causal interactions (Astolfi et al., 2007; Lang et al., 2012). This branch of neuroscience offers more comprehensive information on brain function and better diagnostic and therapeutic strategies for brain patients. These techniques are proposed to determine directional influences between any pair of EEG channels. All effective connectivity estimation was done in MATLAB (The MathWorks, Inc., Natick, MA, USA) via the open-source HERMES toolbox (Niso et al., 2013).
2.3.1. Granger Causality (GC)
A popular statistical method for estimating the effective connectivity is Granger Causality (GC) which is a data-driven method (Kamiński, Ding, Truccolo, & Bressler 2001). It is based on the estimation of parameters of the Multi-Variable Auto-Regressive (MVAR) model and is widely used to explain causality between two time series. For N simultaneously observed stationary time series X(t) (Formula 1), i.e.
The MVAR model process of order P is an expressive description of the X(t) and given by (Formula 2)
In this Model, E(t) is a zero mean white noise process, and P represents the order of the model. Ar is the autoregressive coefficients matrix and its elements aij (r) describe the linear relationship between time series, xj (t) and xi (t) at different time lags r and indicates the influence of xj (t) on xi (t). A process xj (t) is said to Granger-cause another process xi (t) if the elements aij (r) are not all zero.
2.3.2. Partial Directed Coherence (PDC)
One of the quantitative spectral measures of GC in the frequency domain is Partial Directed Coherence (PDC) (Baccalá & Sameshima, 2001). PDC is a complex measure that can be interpreted as the conditional GC from j to i. This method is to determine the direction of information flow between pairs of time series-based frequency domains. PDC from the ith channel to the jth channel jth at frequency f is defined Formulas 3 and 4:
Āij (f), where is frequency domain description of .
2.3.3. Transfer Entropy (TE)
By combining the Wiener causality concept and the conditional mutual information in the context of information theory, we present an essential nonparametric criterion, i.e. Transfer Entropy (TE), for estimating causal connections. It can measure all linear and nonlinear causal connections in a system (Vicente et al., 2011).
Shannon entropy H(x) with probability density function p(x) for a variable x is defined as (Vicente et al., 2011) (Formula 5):
MI(x, y) demonstrates the mutual information between x and y, two discrete variables, and is defined by Formula 6.
In Formula 2, p(x) and p(y) are the probability density functions, and p(x,y) is also the joint probability density function. MI(x, y) measures the amount of information obtained by observing each random variable x or y relative to another and is equal to zero if and only if the random variables x and y are independent. As a result, MI(x, y) can measure the result of linear and nonlinear dependencies between random variables x and y. MI(x, y) can be rewritten using the concept of Shannon entropy according to Formula 7 (Vicente et al., 2011).
In Formula 3, H (x, y) is the joint entropy defined as Formula 8. Also, the conditional entropies H(x|y) and H(y|x) are defined by Formulas 9 and 10, respectively (Vicente et al., 2011):
In Formulas 9 and 10, p(x│y) and p(y│x) are the conditional probability density function x on condition y and y on condition x, respectively.
Conditional mutual information MI (x.y|z) (or partial mutual information) is conditional on observing the random variable z on random variables x and y and is calculated by either of Formulas 11 and 12 (Vicente et al., 2011).Figure 2 illustrates the concept of conditional mutual information symbolically.
By combining the Wiener causality concept and the conditional mutual information MI (x.y|z), we present a nonparametric criterion for estimating causal connections with the name of TE (Vicente et al., 2011). Suppose two time series of x(t) and y(t) that (t= 1,…, L) are the observations of two random variables x and y, respectively.or TE(x→y) shows that by assumption knowing the past observation of the random variable x, how much is added to the available information about the random variable y (Vicente et al., 2011) (Formula 13).
(x̄tdx، τx ) and (y̠tdy، τy ) are the past status vectors and the τX and τY , the present random variable. and are embedding delay x and y and also and are embedding dimensions x and y, respectively. Embedding dimension (d) is the memory of the Markov process in each signal and is estimated by the false nearest neighbors’ method. Also, the embedding delay (τ) is the autocorrelation time of the signal.
2.4. Statistical analysis
Prediction probability statistical method (Pk) (Smith, Dutton, & Smith, 1996) is used to evaluate the ability of the measured index to predict the effective propofol concentration (Ceff) (derived from pharmacokinetic/pharmacodynamic [PK/PD] modeling) (McKay, Voss, Sleigh, Barnard, & Johannsen, 2006) with 2003 Excel software. Given the (Ceff) value S(k) and the effective connectivity index I(k), we choose two data points S(i) and S(j) (S(i) = S(j), (i = j), randomly. Then, we compare the monotony of I(i) and I(j) with the monotony of S(i) and S(j). We repeat the above steps for 500 times, then the is Pk defined as (Formula 14)
, where , Pc+Pd+Ptx , are the proportions that I(i) and I(j) are concordance, discordance, and an x-only tie, respectively. PK value of 1 indicates that the index can predict (Ceff) correctly 100% of the time, and there is a complete correlation between the index and the depth of anesthesia. Because of abnormal data distribution of the index values, we used the Kruskal-Wallis nonparametric test to determine the statistically significant difference of the index in the awake-unconscious and unconscious-recovery states of all subjects. This test is a series of analysis variance tests used to compare two groups (or more) of the statistical society. The value of the P is a criterion of a significance test.
3. Results
We computed the effective connectivity between two dipolar EEG signals at positions of Fp1– F7 and C3– T3 using TE index in 10-s windows for the entire period. For comparison, we have calculated two other methods of effective connectivity methods, i.e. GC and PDC methods, which have been used to study multi-channel EEG signals. The calculated values of the indexes for a subject and simultaneously the corresponding BIS and Ceff are demonstrated in Figure 3.
TE index follows the changes in the propofol drug effect effectively. While GC and PDC indexes fail to track the changes due to their linear analysis methods. Figure 4 shows the scatter plot of TE and BIS in eight volunteers (1072 data points).
Data are fitted by a linear line as TE =1.48×BIS-0.61. Also, TE and BIS in all subjects during the whole procedure have the Pearson correlation coefficient of 0.88 that shows the high relationship between these two indexes.
The results show that the propofol significantly decreases both TE and BIS index in a concentration-dependent manner. But, the TE index tracks faster than BIS during the change from awake to unconscious status in 8 subjects (average of 68 s) and has a shorter delay. Also, the BIS index shows some irregular upward trends about 290-340th s and 360-400th s, while this deviation is less seen in the TE index. So, the TE index is more robust than BIS to artifacts.
To evaluate the ability of Ceff prediction of using the proposed method, is computed for all subjects. According to Table 1, the Pk values of GC, PDC, BIS, and TE indexes with Ceff are 0.46, 0.59, 0.75, and 0.84, respectively.
TE has the highest value of Pk among effective connectivity indexes. Also, Pk value between the TE index and the Ceff (0.84) is higher than BIS and Ceff (0.75) which represents the ability of this index to predict Ceff flawlessly. The significance of differences between Pk s is tested statistically using the paired t-test. This difference between TE with other indices is statistically significant (P<0.001) and implies that TE has a convincing ability to follow the propofol effect-site concentrations. Moreover, the relationship between BIS and TE values with effect-site drug concentration Ceff is demonstrated for the same subject in Figure 5.
A sigmoid curve is fitted to the data that describes the relationship between the index and drug concentration effect. As shown in this Figure, with increasing drug concentration, both indexes (BIS, TE) decrease uniformly. The goodness-of-fit between the TE and the Ceff (R2=0.931) is significantly higher than that between BIS and Ceff (R2=0.851).
The ability of the presented index to differentiate awake, unconscious, and recovery states is very important for DOA monitoring. GC, PDC, BIS, and TE index over 10-s windows at these three states are computed. Figure 6 shows the box plots of these computed indexes.
As seen in Figure 6, the variability in TE compared to the BIS index is significantly smaller at the unconscious and recovery states. It demonstrates that the TE index had more robustness to noise during the anesthesia. Moreover, as you can see in Table 1, the TE index performed better in following the Ceff than BIS and the variability in Pk value of TE index compared to BIS index is significantly smaller. It demonstrates that the sensitivity of the TE index to noise is lower than BIS. To evaluate the significant difference, we used the Kruskal-Wallis test, and the P value of each index was determined in different anesthesia states (Table 2).
As you see in Figure 6 and Table 2, TE could differentiate awake-unconscious and unconscious-recovery states very well. However, other connectivity indexes cannot make a difference appropriately, particularly between unconscious and recovery states. Finally, TE rather than BIS index has a lower P value at awake-unconscious states and also in unconscious-recovery states that indicate its superiority over BIS.
4. Discussion
We presented a new nonparametric and nonlinear effective connectivity approach called TE index between two dipolar EEG signals at positions of Fp1–F7 and C3–T3 as a significant index for describing the neurophysiological mechanisms of anesthetic drugs during anesthesia. This index can significantly trace the changes of propofol drug effect-site and recognize well the awake-unconscious states, as well as unconscious-recovery states of the patient while other effective connectivity indexes (GC, PDC) fails to trace changes during anesthesia (Figures 3, 6; Tables 1, 2). So, the TE indicator is a suitable measure to evaluate the dynamic signal EEG during anesthesia.
Different statistical methods have been presented for estimating the causal or brain effective connectivity. GC methods limit the causal connections pattern to specific templates based on the estimation of linear parameters of the MVAR model for individual signal data. While the dynamics of brain connections are unclear and it is difficult to simply isolate the nature of brain connections with a predetermined limiting model. Consequently, using these methods leads to an incorrect estimating of brain connection, and nonlinear methods of effective connectivity must be used. By combining the Wiener causality concept and the conditional mutual information in the context of information theory, we present an important nonparametric and nonlinear criterion for estimating causal connections, i.e. TE. This index does not assume any particular model and can define linear and nonlinear connections existing in a system quantitatively. TE needs much less computational time (0.21 s) than GC (0.47 s) and PDC (0.53 s) and, due to its nonlinear nature, can appropriately identify directional connectivity (Vicente et al., 2011). So, TE as a nonlinear effective connectivity method is a powerful tool for understanding the neurophysiological mechanisms of anesthetics.
Nonlinear effective connectivity in neuronal networks is an essential feature for finding the interaction between separate cortical signals in different brain regions. Propofol changes the information flow in the brain and the process of losing consciousness and awareness during the anesthesia period to decrease intravenous. So, the results show that the TE index has a good ability to trace the changes of propofol drug effect-site during the entire experiments.
The result shows that TE index compared to BIS (as an anesthesia depth commercial monitor based on the single channel of EEG) has several advantages. First, BIS calculation is very complex and takes more time than our method. Second, unlike BIS, the TE index is much more resistant to noise without complex calculations. Third, the TE index responds faster reaction (about 68 s) on the change from awake to unconscious state. Fourth, the TE index has less irregularity than BIS in the unconscious state during the anesthesia (Figure 3). Fifth, the TE index can discriminate different states of unconsciousness better than BIS (Figure 6, Table 2). Finally, based on the statistical method of and goodness-of-fit R2, TE index has a higher correlation coefficient with the Ceff than BIS index (Table 1, Figure 5). All advantages mentioned in this section represent that the TE index estimates the drug concentration dynamic better than the BIS index. Also, there is some information in the connection between EEG channels that cannot be extracted from only one EEG channel in BIS calculation.
The following two points should be considered in the future. In this study, EEG signals were evaluated in only 8 subjects with propofol anesthesia. It is better to record more subjects. Although, noteworthy results demonstrate that the differences are comparatively substantial. Second, due to the recorded limitations of EEG in the operation room, only two channels of EEG from the frontal and temporal parts of the brain were recorded. It is better to use several EEG channels and select the best choice to evaluate the anesthesia depth better.
This study shows that the nonlinear effective connectivity index, called TE between pair signals of EEG at frontal and temporal regions, can effectively trace the changes in propofol drug effect and estimates the patient’s unconscious states. TE index is also better than BIS as a single channel commercial index in the clinical setting due to its faster response and higher correlation with the drug concentration effect-site, less irregularity in the unconscious state, and a better ability to discriminate between the three states of anesthesia. Thus, the TE index is a confident and effective connectivity indicator for designing a new monitoring system of two EEG channels for the depth of anesthesia estimation.
Ethical Considerations
Compliance with ethical guidelines
All study procedures involving human participants were following the ethical standards of the Institutional Research Committee with the 1964 Helsinki Declaration. This study received Ethics Committee approval from Waikato Hospital, New Zealand. Informed written consent was obtained from all study patients.
Funding
The article is supported by Research Department of School of Medicine Shahid Beheshti University of Medical Sciences (Grant No.: 13730).
Authors' contributions
Conceptualization, methodology, investigation, writing- reviewing and editing, and validation: All authors; Supervision: Ahmad Shalbaf; Writing- original draft preparation: Neda Sanjari, Ahmad Shalbaf.
Conflict of interest
The authors declared no conflicts of interest.
References
Afshani, F., Shalbaf, A., Shalbaf, R., & Sleigh, J. (2019). Frontal-temporal functional connectivity of EEG signal by standardized permutation mutual information during anesthesia. Cognitive Neurodynamics, 13(6), 531-40. [DOI:10.1007/s11571-019-09553-w] [PMID] [PMCID]
Akeju, O., Westover, M. B., Pavone, K. J., Sampson, A. L., Hartnack, K. E., & Brown, E. N., et al. (2014). Effects of sevoflurane and propofol on frontal electroencephalogram power and coherence. Anesthesiology, 121(5), 990-8. [DOI:10.1097/ALN.0000000000000436] [PMID] [PMCID]
Alkire, M. T., Hudetz, A. G., & Tononi, G. (2008). Consciousness and anesthesia. Science, 322(5903), 876-80. [DOI:10.1126/science.1149213] [PMID] [PMCID]
Astolfi, L., Cincotti, F., Mattia, D., Marciani, M. G., Baccala, L. A., & de Vico Fallani, F., et al. (2007). Comparison of different cortical connectivity estimators for high‐resolution EEG recordings. Human Brain Mapping, 28(2), 143-57. [DOI:10.1002/hbm.20263] [PMID] [PMCID]
Baccalá, L. A., & Sameshima, K. (2001). Partial directed coherence: A new concept in neural structure determination. Biological Cybernetics, 84(6), 463-74. [DOI:10.1007/PL00007990] [PMID]
Gao, Y., Ren, L., Li, R., & Zhang, Y. (2018). Electroencephalogram-electromyography coupling analysis in stroke based on symbolic transfer entropy. Frontiers in Neurology, 8, 716. [DOI:10.3389/fneur.2017.00716] [PMID] [PMCID]
Gugino, L., Chabot, R., Prichep, L., John, E., Formanek, V., & Aglio, L. (2001). Quantitative EEG changes associated with loss and return of consciousness in healthy adult volunteers anaesthetized with propofol or sevoflurane. British Journal of Anaesthesia, 87(3), 421-8. [DOI:10.1093/bja/87.3.421] [PMID]
Hagihira, S., Takashina, M., Mori, T., Mashimo, T., & Yoshiya, I. (2001). Practical issues in bispectral analysis of electroencephalographic signals. Anesthesia & Analgesia, 93(4), 966-70. [DOI:10.1097/00000539-200110000-00032] [PMID]
Hayashi, K., Mukai, N., & Sawa, T. (2014). Simultaneous bicoherence analysis of occipital and frontal electroencephalograms in awake and anesthetized subjects. Clinical Neurophysiology, 125(1), 194-201. [DOI:10.1016/j.clinph.2013.06.024] [PMID]
Huang, C. S., Pal, N. R., Chuang, C. H., & Lin, C. T. (2015). Identifying changes in EEG information transfer during drowsy driving by transfer entropy. Frontiers in Human Neuroscience, 9, 570. [DOI:10.3389/fnhum.2015.00570] [PMID] [PMCID]
Johansen, J. W., Sebel, P. S., & Fisher, D. M. (2000). Development and clinical application of electroencephalographic bispectrum monitoring. The Journal of the American Society of Anesthesiologists, 93(5), 1336-44. [DOI:10.1097/00000542-200011000-00029] [PMID]
Kamiński, M., Ding, M., Truccolo, W. A., & Bressler, S. L. (2001). Evaluating causal relations in neural systems: Granger causality, directed transfer function and statistical assessment of significance. Biological Cybernetics, 85(2), 145-57. [DOI:10.1007/s004220000235] [PMID]
Lang, E. W., Tomé, A. M., Keck, I. R., Górriz-Sáez, J., & Puntonet, C. G. (2012). Brain connectivity analysis: A short survey. Computational Intelligence and Neuroscience, 2012, 2012:412512. [DOI:10.1155/2012/412512] [PMID] [PMCID]
Lee, J., Nemati, S., Silva, I., Edwards, B. A., Butler, J. P., & Malhotra, A. (2012). Transfer entropy estimation and directional coupling change detection in biomedical time series. Biomedical Engineering Online, 11(1), 19. [DOI:10.1186/1475-925X-11-19] [PMID] [PMCID]
Lee, U., Kim, S., Noh, G. J., Choi, B. M., Hwang, E., & Mashour, G. A. (2009). The directionality and functional organization of frontoparietal connectivity during consciousness and anesthesia in humans. Consciousness and Cognition, 18(4), 1069-78. [DOI:10.1016/j.concog.2009.04.004] [PMID]
Lee, U., Kim, S., Noh, G.J., Choi, B.M., & Mashour, G. A. (2008). Propofol induction reduces the capacity for neural information integration: Implications for the mechanism of consciousness and general anesthesia. Nature Precedings, 1-30. [DOI:10.1038/npre.2008.1244.2]
Li, D., Hambrecht-Wiedbusch, V. S., & Mashour, G. A. (2017). Accelerated recovery of consciousness after general anesthesia is associated with increased functional brain connectivity in the high-gamma bandwidth. Frontiers in Systems Neuroscience, 11, 16. [DOI:10.3389/fnsys.2017.00016] [PMID] [PMCID]
Li, T., & Wen, P. (2016). Depth of anaesthesia assessment using interval second-order difference plot and permutation entropy techniques. IET Signal Processing, 11(2), 221-7. [DOI:10.1049/iet-spr.2015.0114]
Li, X., Wang, F., & Wu, G. (2017). Monitoring depth of anesthesia using detrended fluctuation analysis based on EEG signals. Journal of Medical and Biological Engineering, 37(2), 171-80. [DOI:10.1007/s40846-016-0196-y]
Liang, Z., Ren, Y., Yan, J., Li, D., Voss, L. J., & Sleigh, J. W., et al. (2016). A comparison of different synchronization measures in electroencephalogram during propofol anesthesia. Journal of Clinical Monitoring and Computing, 30(4), 451-66. [DOI:10.1007/s10877-015-9738-z] [PMID]
Liang, Z., Wang, Y., Sun, X., Li, D., Voss, L. J., & Sleigh, J. W., et al. (2015). EEG entropy measures in anesthesia. Frontiers in Computational Neuroscience, 9, 16. [DOI:10.3389/fncom.2015.00016] [PMID] [PMCID]
Liu, Q., Chen, Y. F., Fan, S. Z., Abbod, M. F., & Shieh, J. S. (2016). Improved spectrum analysis in EEG for measure of depth of anesthesia based on phase-rectified signal averaging. Physiological Measurement, 38(2), 116. [DOI:10.1088/1361-6579/38/2/116] [PMID]
Liu, Q., Chen, Y. F., Fan, S. Z., Abbod, M. F., & Shieh, J. S. (2017). Quasi-periodicities detection using phase-rectified signal averaging in EEG signals as a depth of anesthesia monitor. IEEE Transactions on Neural Systems and Rehabilitation Engineering, 25(10), 1773-84. [DOI:10.1109/TNSRE.2017.2690449] [PMID]
McKay, I. D., Voss, L. J., Sleigh, J. W., Barnard, J. P., & Johannsen, E. K. (2006). Pharmacokinetic-pharmacodynamic modeling the hypnotic effect of sevoflurane using the spectral entropy of the electroencephalogram. Anesthesia & Analgesia, 102(1), 91-7. [DOI:10.1213/01.ane.0000184825.65124.24] [PMID]
Monk, T. G., Saini, V., Weldon, B. C., & Sigl, J. C. (2005). Anesthetic management and one-year mortality after noncardiac surgery. Anesthesia & Analgesia, 100(1), 4-10. [DOI:10.1213/01.ANE.0000147519.82841.5E] [PMID]
Nallasamy, N., & Tsao, D. Y. (2011). Functional connectivity in the brain: effects of anesthesia. The Neuroscientist, 17(1), 94-106. [DOI:10.1177/1073858410374126] [PMID]
Nguyen-Ky, T., Wen, P., & Li, Y. (2010). An improved detrended moving-average method for monitoring the depth of anesthesia. IEEE Transactions on Biomedical Engineering, 57(10), 2369-78. [DOI:10.1109/TBME.2010.2053929] [PMID]
Nguyen-Ky, T., Wen, P., & Li, Y. (2013). Consciousness and depth of anesthesia assessment based on Bayesian analysis of EEG signals. IEEE Transactions on Biomedical Engineering, 60(6), 1488-98. [DOI:10.1109/TBME.2012.2236649] [PMID]
Nguyen-Ky, T., Wen, P., & Li, Y. (2014). Monitoring the depth of anaesthesia using Hurst exponent and Bayesian methods. IET Signal Processing, 8(9), 907-17. [DOI:10.1049/iet-spr.2013.0113]
Nicolaou, N., & Georgiou, J. (2014). Spatial analytic phase difference of EEG activity during anesthetic-induced unconsciousness. Clinical Neurophysiology, 125(10), 2122-31. [DOI:10.1016/j.clinph.2014.02.011] [PMID]
Niso, G., Bruña, R., Pereda, E., Gutiérrez, R., Bajo, R., & Maestú, F., et al. (2013). HERMES: towards an integrated toolbox to characterize functional and effective brain connectivity. Neuroinformatics, 11(4), 405-34. [DOI:10.1007/s12021-013-9186-1] [PMID]
Pilge, S., Zanner, R., Schneider, G., Blum, J., Kreuzer, M., & Kochs, E. F. (2006). Time delay of index calculation: analysis of cerebral state, bispectral, and narcotrend indices. The Journal of the American Society of Anesthesiologists, 104(3), 488-94. [DOI:10.1097/00000542-200603000-00016] [PMID]
Schrouff, J., Perlbarg, V., Boly, M., Marrelec, G., Boveroux, P., & Vanhaudenhuyse, A., et al. (2011). Brain functional integration decreases during propofol-induced loss of consciousness. NeuroImage, 57(1), 198-205. [DOI:10.1016/j.neuroimage.2011.04.020] [PMID]
Sebel, P. S., Bowdle, T. A., Ghoneim, M. M., Rampil, I. J., Padilla, R. E., & Gan, T. J., et al. (2004). The incidence of awareness during anesthesia: A multicenter United States study. Anesthesia & Analgesia, 99(3), 833-9. [DOI:10.1213/01.ANE.0000130261.90896.6C] [PMID]
Shalbaf, A., Saffar, M., Sleigh, J. W., & Shalbaf, R. (2017). Monitoring the depth of anesthesia using a new adaptive neurofuzzy system. IEEE Journal of Biomedical and Health Informatics, 22(3), 671-7. [DOI:10.1109/JBHI.2017.2709841] [PMID]
Shalbaf, A., Shalbaf, R., Saffar, M., & Sleigh, J. (2020). Monitoring the level of hypnosis using a hierarchical SVM system. Journal of Clinical Monitoring and Computing, 34(2), 331-8. [DOI:10.1007/s10877-019-00311-1] [PMID]
Smith, W. D., Dutton, R. C., & Smith, T. N. (1996). Measuring the performance of anesthetic depth indicators. The Journal of the American Society of Anesthesiologists, 84(1), 38-51. [DOI:10.1097/00000542-199601000-00005] [PMID]
Vicente, R., Wibral, M., Lindner, M., & Pipa, G. (2011). Transfer entropy-a model-free measure of effective connectivity for the neurosciences. Journal of Computational Neuroscience, 30(1), 45-67. [DOI:10.1007/s10827-010-0262-3] [PMID] [PMCID]
Williams, M., & Sleigh, J. (1999). Auditory recall and response to command during recovery from propofol anaesthesia. Anaesthesia and Intensive care, 27(3), 265-8. [DOI:10.1177/0310057X9902700307] [PMID]
Yang, C., Jeannès, R. L. B., Bellanger, J. J., & Shu, H. (2012). A new strategy for model order identification and its application to transfer entropy for EEG signals analysis. IEEE Transactions on Biomedical Engineering, 60(5), 1318-27. [DOI:10.1109/TBME.2012.2234125] [PMID]
Type of Study: Original |
Subject:
Computational Neuroscience
Received: 2020/07/1 | Accepted: 2020/12/12 | Published: 2021/03/1
Received: 2020/07/1 | Accepted: 2020/12/12 | Published: 2021/03/1
Send email to the article author
| Rights and permissions | |
 |
This work is licensed under a Creative Commons Attribution-NonCommercial 4.0 International License. |
![]()
Copyright © The Author(s);
This is an open access article distributed under the terms of the Creative Commons Attribution License (CC-By-NC), which permits use, distribution, and reproduction in any medium, provided the original work is properly cited and is not used for commercial purposes.
Contact Information
