


BibTeX | RIS | EndNote | Medlars | ProCite | Reference Manager | RefWorks
Send citation to:
URL: http://bcn.iums.ac.ir/article-1-1766-en.html


 , Bruno Hebling Vieira2 , Mohmmad Reza Khodaei1 , Mahnaz Ashrafi1 , Elahe Parham1 , Gholam Ali Hossein-Zadeh1 , Carlos Ernesto Garrido Salmon2 , Hamid Soltanian Zadeh *1
2- Inbrain Lab, Department of Physics, FFCLRP, University of São Paulo, Ribeirao Preto, Brazil.
1. Introduction
One of the most influential intelligence tests is the Wechsler Adult Intelligence Score (WAIS) (Wechsler, 1944). Its third edition, the WAIS-III, is recommended for subjects aged 16 years or older. It includes 13 sub-tests and comprises 4 indices. It has been normalized for age, i.e. the average score is maintained across the lifespan, even though the test scores vary between ages. The Verbal Comprehension Index (VCI) is obtained from the information, similarities, and vocabulary tests. The Working Memory Index (WMI) is obtained from the arithmetic and digit span tests. The Perceptual Organization Index (POI) is obtained from the block design, matrix reasoning, and picture completion sub-tests. The Processing Speed Index (PSI) is obtained from the digit symbol-coding and symbol search tests. In turn, these indices can be combined into Intelligence Quotients (IQ). The VCI and WMI sub-indices compose the Verbal Intelligence Quotient (VIQ), while POI and PSI compose the Performance Intelligence Quotient (PIQ). Finally, VIQ and PIQ together form the Full-Scale Intelligence Quotient (FSIQ).
Another commonly studied measurement of intelligence is the Raven's progressive matrices (Raven, 1941). This family of tests has been published in many forms in the literature. Their common feature is a sole presence test where a graphical matrix is visually shown, with a missing sector. The participant is instructed to select, among the alternatives presented later, the correct figure that completes the matrix shown initially. Its non-verbal character is especially useful for application in different sociodemographic contexts.
In general, intelligence tests demand new normative information and adaptations due to the evolving understanding of human cognition and clinical practice (Tulsky, Saklofske, & Zhu, 2003). For example, WAIS is revised every two decades, and we currently use its fourth edition (Wechsler, 2008). For an in-depth overview of several intelligence instruments and aptitude tests, see Gregory (2014) chapters 5–6.
It has been noted that there are substantial positive correlations among seemingly unrelated tests. In other words, individuals that score high in a specific sub-test tend to score high in other sub-tests as well. This evidence proves the existence of a general intelligence factor, or g, as Spearman termed it (Spearman, 1904). This general intelligence factor has been constructed to be a numeric score that summarizes the positive correlations among subtests and is therefore positively correlated with the generalized intellectual ability of individuals. However, the psychometric literature is not unanimous on the measurability of g. This score is often assessed by factor analysis or related techniques to summarize various intelligence tests. Some studies claim that specific tests, such as Raven's Progressive Matrices (RPM) (Raven, 1941), has very high loading on g such that they alone could provide sufficient information on the g factor (Jensen, 1980), prompting studies to employ these single tests as proxies for g (Jensen, 1973), but not without criticism (Gignac, 2015).
Not all intelligence measurements are equal. Differences in quality have been shown to have a moderating effect on the correlation between brain volume and intelligence (Gignac & Bates, 2017) and resting-state functional connectivity and intelligence (Dubois, Galdi, Paul, & Adolphs, 2018). In general, some measurements may lend themselves better to a single cognitive dimension, such as the RPM, not fulfilling criteria a good measurement of intelligence. Gignac and Bates (2017) presented an essential guide relating the number of tests, its cognitive dimensions, testing time, and correlation with g to a 4-point quality scale.
Spearman also postulated that inter-individual differences in tests overlooked by the overall mental performance measured by g were due to s—a factor named after specific abilities. It is important to note that IQ is a vehicle of the scientific construct g (Jensen, 1992) and is also influenced by s (Colom, Abad, García, & Juan-Espinosa, 2002).
It has been noted that genetics does not directly cause variations in intelligence. Genetics influences phenotypes, which in turn influences general intelligence. For this reason, the neurobiological basis of intelligence composes an open and heavily explored scientific question. Variations in intellectual skills due to evolution (phylogeny) and development (ontogeny) make neuroimaging a fundamental tool to answer this question.
The drive to find neural substrates of intelligence started roughly with Chase et al. (1984) and Haier et al. (1988), first with Positron Emission Tomography (PET). It was the preferred imaging technique at the time, which allows one to study brain metabolism in vivo. These works established the feasibility of studying inter-individual variations of intelligence using neuroimaging. In a few years, Magnetic Resonance Imaging (MRI) took over PET for the in vivo, macroscopic studies of the brain and was applied to the study of intelligence (Prabhakaran, Smith, Desmond, Glover, & Gabrieli, 1997; Kroger et al., 2002). Compared to other neuroimaging techniques, MRI generates good temporal or spatial resolution and displays optimal soft-tissue contrast. Due to magnetic resonance properties of the cerebral tissues and physiology, MRI contrast can be made sensible to the separation of gray and white matter, brain hemodynamic response, or water diffusion in nerve fibers.
using MRI show a substantial correlation between intracranial volume and general indices of intelligence (Luders, Narr, Thompson, & Toga, 2009), reproducible across genders and age ranges (McDaniel, 2005). Several MRI studies show that other indices that touch upon connectivity, neuroanatomy, and brain microstructure, such as white matter volume, fractional anisotropy in several tracts, and cortical gray matter thickness, are also related to intelligence (Ritchie et al., 2015). Theories on the neural bases of human intelligence are often corroborated with evidence drawn from MRI studies (Barbey 2018; Duncan & Owen, 2000; Duncan 2010; Jung and Haier 2007; Kovacs and Conway 2016). Barbey exposed some of these theories and his Network Neuroscience Theory (NNT) in a recent article (Barbey 2018). They are the lateral prefrontal cortex theory (LPFCT) (Duncan & Owen, 2000), the Parieto-Frontal Integration theory (P-FIT) (Jung and Haier 2007), the Multiple-Demand Theory (M-DT) (Duncan, 2010), and process overlap theory (POT) (Kovacs & Conway, 2016).
The P-FIT, which is perhaps the most studied theory, proposes the existence of a network responsible, at least partially, for the sustenance of human intelligence (Haier, 2015). Substantial empirical evidence from PET and functional Magnetic Resonance Imaging (fMRI) studies (Jung and Haier 2007) verify that notion. This theory postulates that intelligence is associated with efficient connectivity between several cortical regions, located mostly across the dorsolateral prefrontal cortex (Brodmann areas 6, 9, 10, 45, 46, 47) and parietal lobe (Brodmann areas 39, 40) plus adjacent areas in the anterior cingulate cortex, temporal, and occipital lobes (Brodmann areas 32, 21, 37, 18 and 19, respectively). As the theory concerns the communication of distant areas, it also implicates some fasciculi. In this regard, there is the integrative theory of prefrontal cortex function, which considers this region as a flexible hub involved in executive control that can reconfigure its connectivity to better conform to cognitive task demands (Miller & Cohen, 2001). Mounting evidence shows that functional connectivity from this region is a predictor of intelligence (Song et al. 2008; Cole, Yarkoni, Repovš, Anticevic, & Braver, . 2012; Cole, Ito, & Braver, 2015). Other neuroimaging studies not directly linked to previous theories showed morphometric indices of specific brain regions related to the neural substrate of intelligence. For example, Fjell et al. (2015) showed that heterogeneous cortical surface area expansion, both during evolution and development, is positively correlated with intellectual abilities.
Intelligence issues are not just a concern of neuroscientists. Based on its definition, individual intelligence has an enormous impact on the most diverse areas of society. General intelligence is, directly and indirectly, related to job performance (Hunter, 1986). Intelligence quotients from childhood predict adult morbidity and mortality (Gottfredson & Deary, 2004). These outcomes might be more subtle than a simple causal relationship (Byington & Felps, 2010), but the fact remains that intelligence is fundamental to human life.
In this article, we aim to provide a thorough review and unified reference of studies reporting findings on neuroimaging-based correlates of human intelligence. In the next four sections, we review papers dealing with MRI-based morphometry, diffusion MRI, functional MRI, and multimodal approaches fusing more than one modality. Having reported the main findings derived from populations, we also report on the state-of-the-art individualized prediction of intelligence, a flourishing field of study due to the growing popularity of machine learning-based predictive frameworks and individualized neuroimaging assessments.
2. Brain Morphometry and Human Intelligence
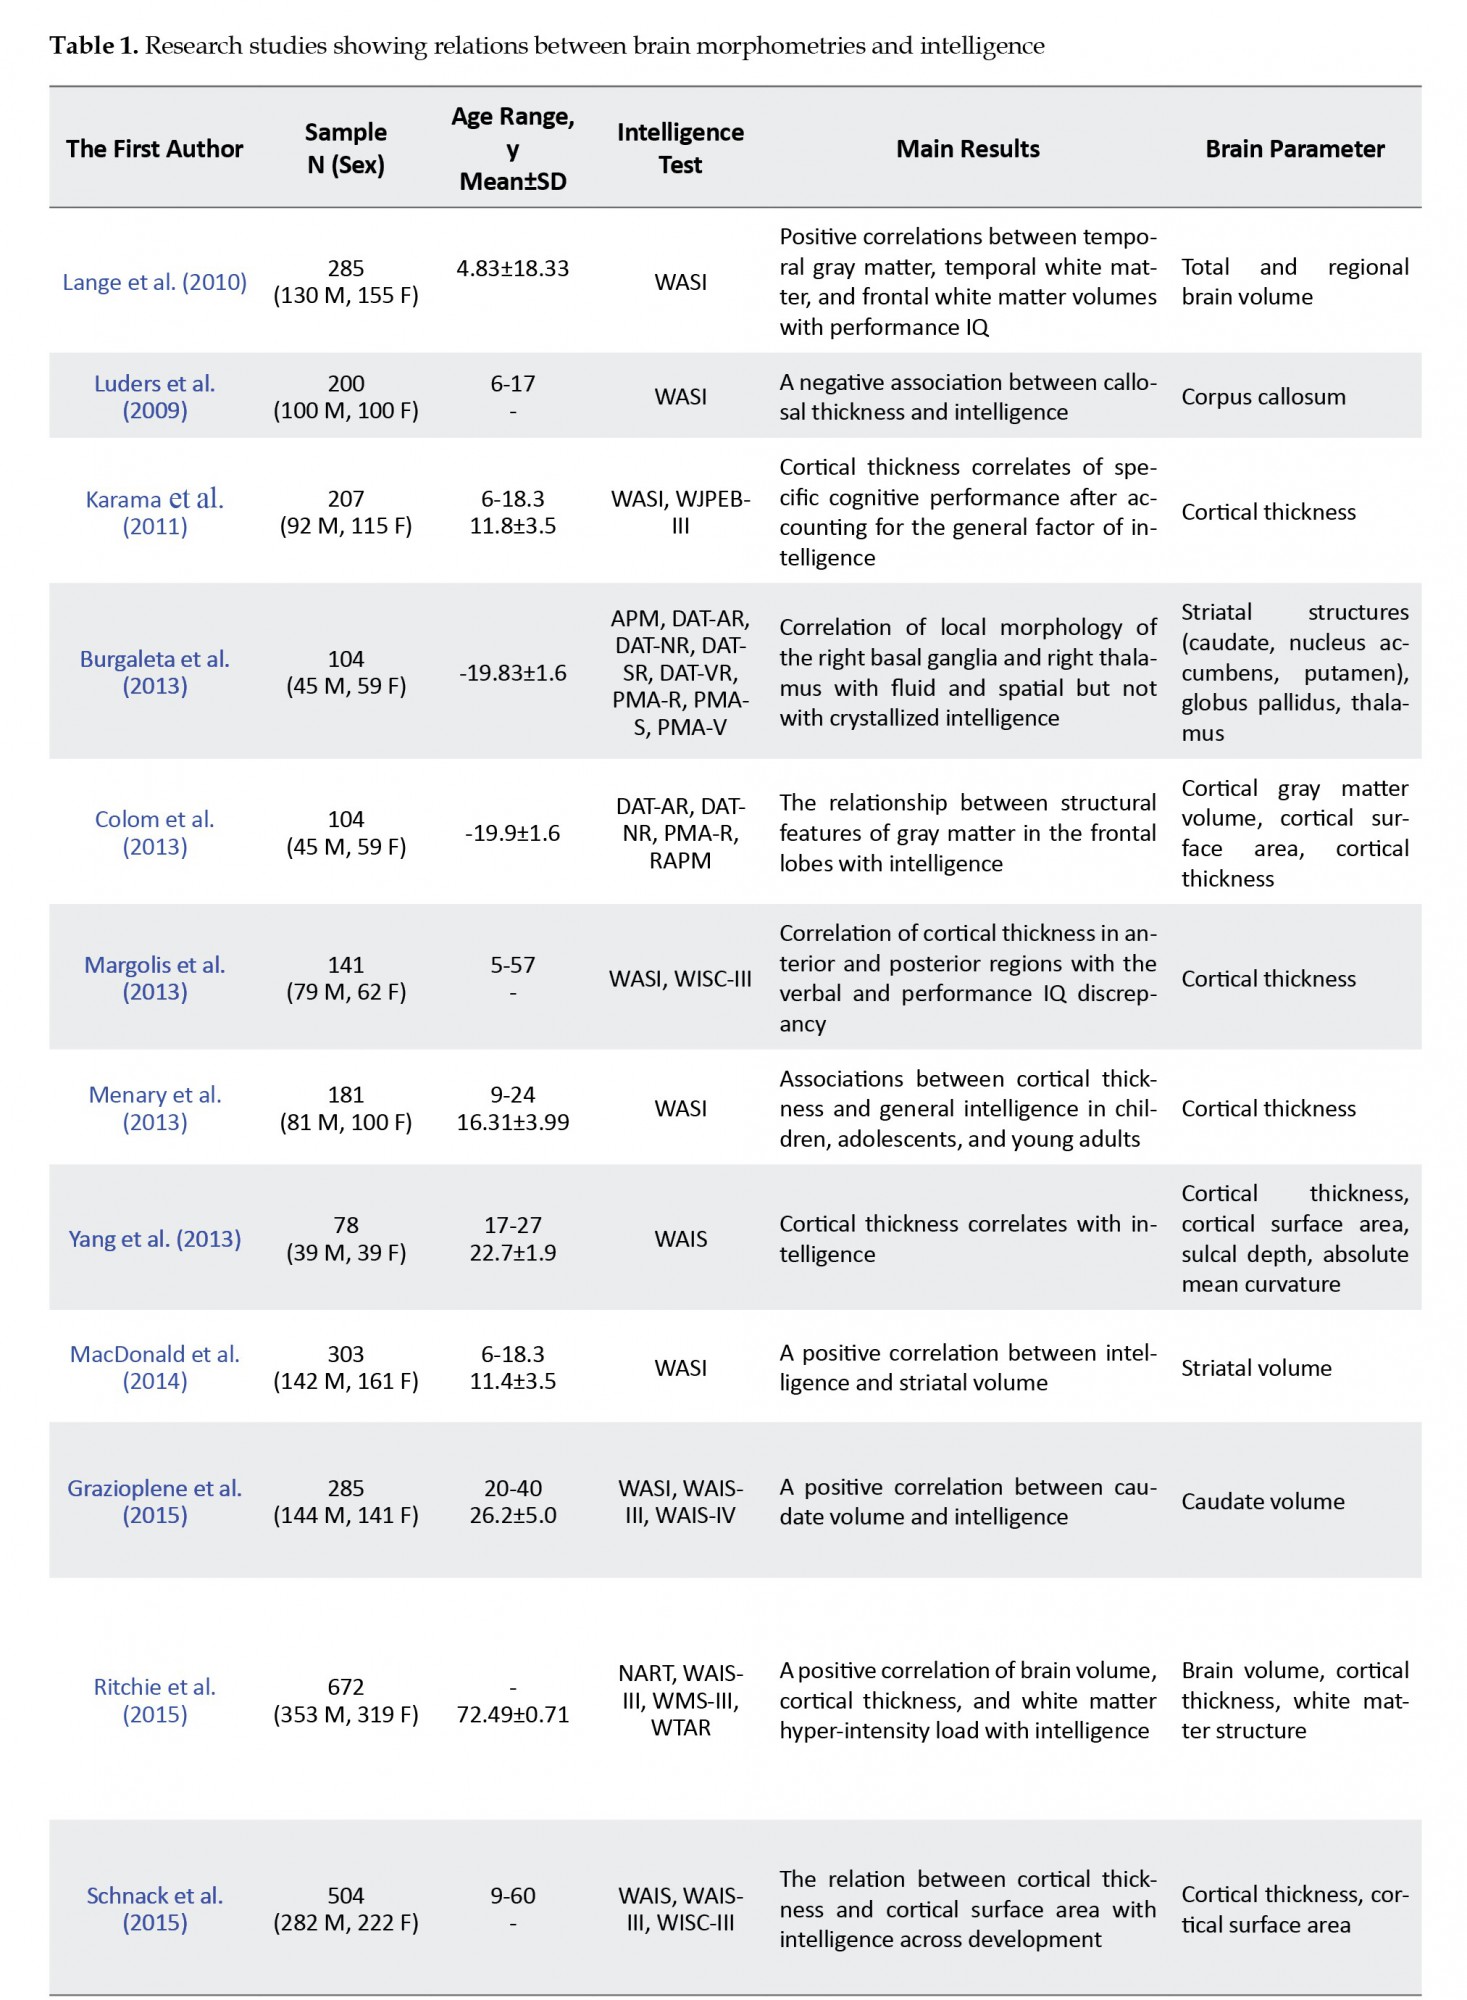
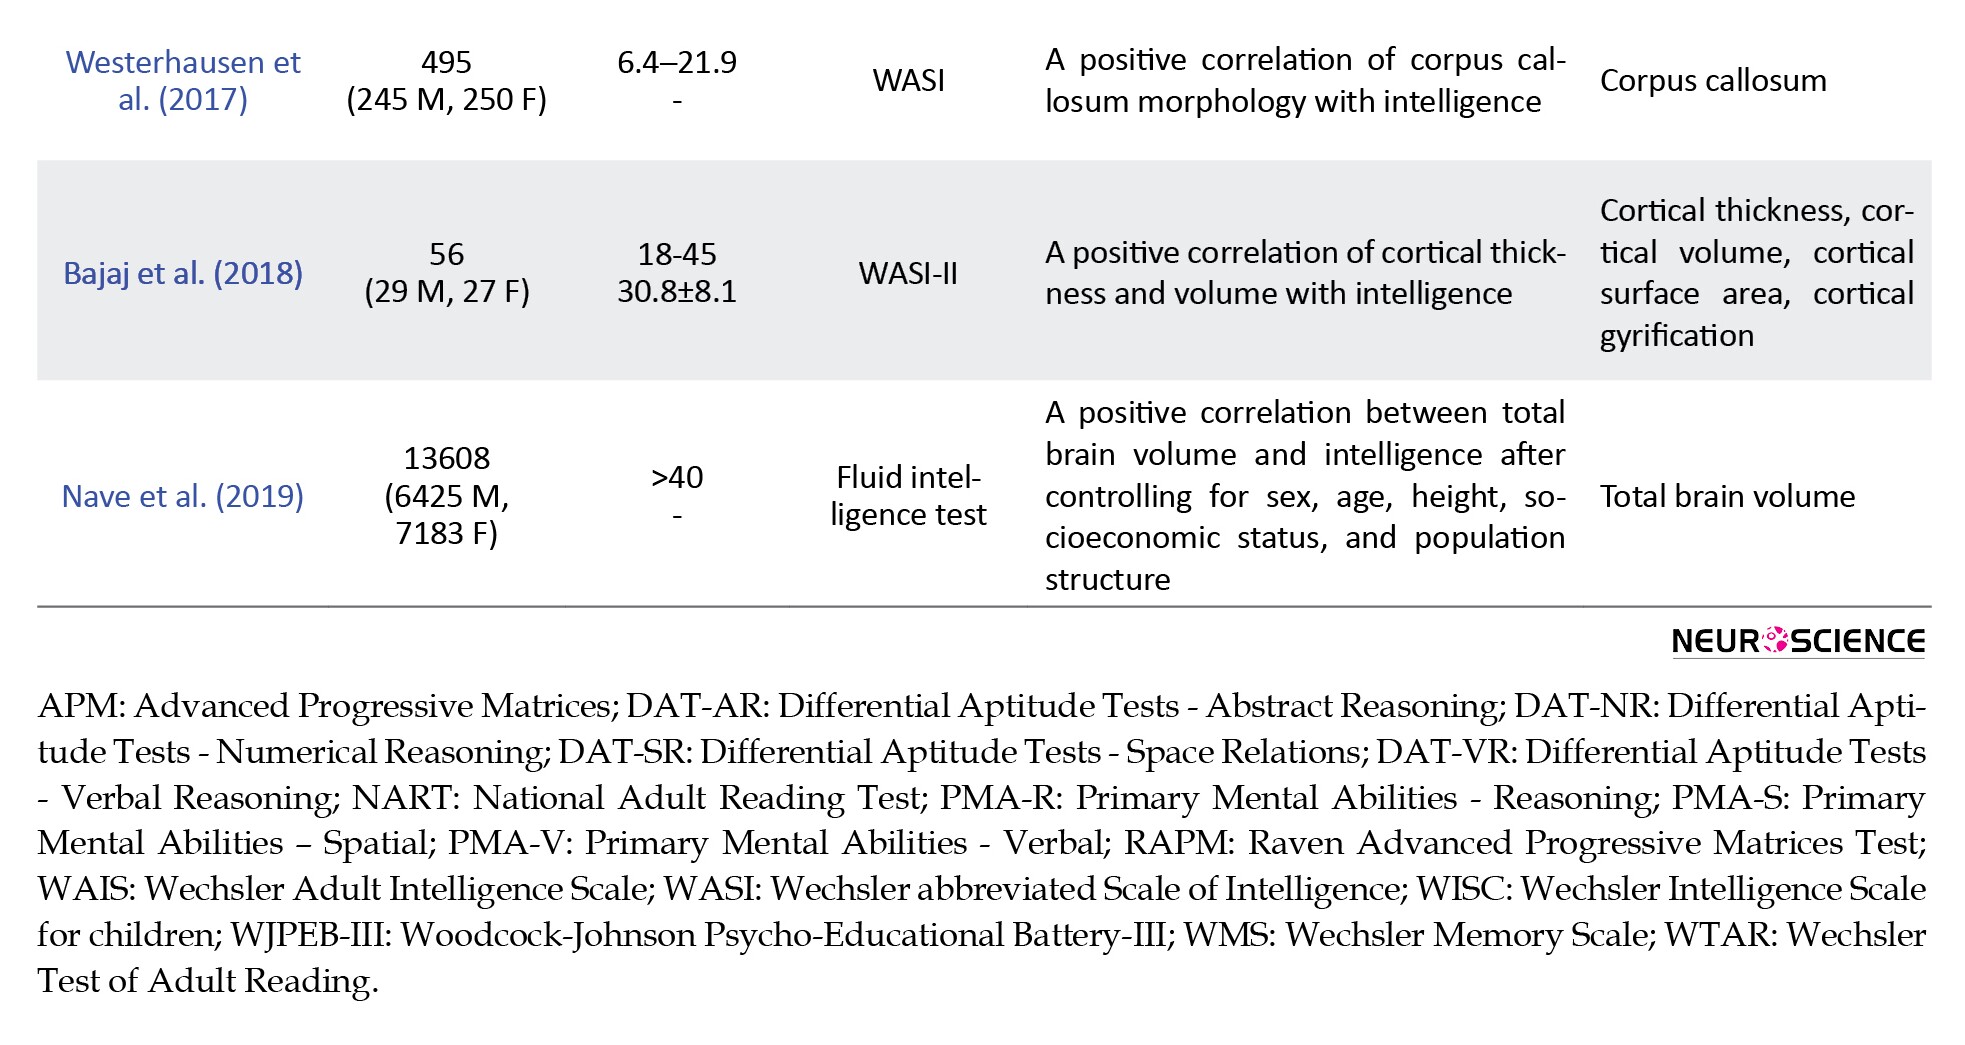
One way of representing the relation between brain volume and intelligence is to consider the correlation between the volumes of different tissues or regions of the brain with particular components of Full-Scale IQ (FSIQ) (general intelligence), e.g. performance IQ (PIQ) or Verbal IQ (VIQ) (fluid intelligence or crystallized intelligence). Lange, Froimowitz, Bigler, and Lainhart (2010) found positive correlations between temporal gray matter, temporal white matter, and frontal white matter volumes with FSIQ (+~0.14-0.27) in children and adolescents are due in large part to their correlations with PIQ and not VIQ. In this regard, (Colom et al., 2013) showed that cortical gray matter volume and cortical surface area in the middle frontal gyrus were correlated with fluid intelligence while, in the inferior frontal gyrus, they were associated with crystallized intelligence. In another significant study, Ritchie et al. (2015) however, how much variance in intelligence other brain measurements would account for if included together with brain volume in a multivariable model. We examined a large sample of individuals in their seventies (n=672 used structural equation modeling to relate 6 common magnetic resonance imaging-derived brain variables, i.e. brain volume, cortical thickness, white matter structure, white matter hyperintensity load, iron deposits, and microbleeds, to general and fluid intelligence. The brain volume accounted for the largest portion of variance (+~12%). Although all neuroimaging variables together accounted for 18%–21% of the variance in intelligence, adding mainly cortical thickness (+~5%) and white matter hyperintensity load (+~2%) increased the predictive value of the model.
Regarding total brain volume, more recently, a preregistered study (Nave, Jung, Karlsson Linnér, Kable, & Koellinger, 2019) investigated the relationship between brain volume and cognitive ability using a sample of adults (N=13608) in the United Kingdom. The analysis was systematically controlled for sex, age, height, socioeconomic status, and population structure, and it was free of publication bias. A robust association between total brain volume and fluid intelligence (r=0.19) was found that was consistent with previous findings in the literature.
Other studies measure the relationship between volumes of subcortical brain regions with intelligence. Burgaleta et al. (2014) performed shape analyses to understand how individual differences in the local morphology of basal ganglia relate to variability in cognitive performance. To this end, structural MRI was acquired in 104 young adults, and the outer surfaces of striatal structures (caudate, nucleus accumbens, and putamen), globus pallidus, and thalamus were estimated for each subject and hemisphere. Moreover, 9 cognitive tests were used to measure fluid, crystallized, and spatial intelligence. Significant correlations were found for fluid and spatial but not crystallized intelligence for the right striatal structures and thalamus after controlling for age, sex, and adjusted for brain size.
Moreover, MacDonald, Ganjavi, Collins, Evans, and Karama (2014) showed that volume of left striatum, including caudate nucleus and putamen, was positively correlated with intelligence specifically for male children. Furthermore, Grazioplene et al. (2015) hypothesized that due to the central role of the caudate in learning, better attentional function, and verbal ability, there is a positive association between intelligence and caudate volume. Indeed, regression of IQ onto bilateral caudate volume controlling for age, sex, and total brain volume indicated a significant positive correlation between caudate volume and intelligence.
Additionally, the corpus callosum is another major anatomical part of the brain, widely explored for any possible correlation with intelligence. In a study, Luders et al. (2011) found mixed results after mapping the correlations between standardized intelligence measures and callosal thickness. Although the strongest correlations were negative and confined to the splenium, the strength and the direction of intelligence-callosal thickness associations vary considerably. While significant correlations in females were mainly positive, significant correlations in males were exclusively negative. However, only the negative correlations in the overall sample remained significant when controlling for multiple comparisons. In a recent study, Westerhausen et al. (2017) re-examined the association between the corpus callosum and intelligence measures in a large longitudinal sample using raw test scores for accounting for the ongoing cognitive development in young adults. Without considering the age effect, they found a positive association between the thickness of splenium of the corpus callosum with both verbal and performance raw test scores.
The correlation between cortical thickness and intelligence is another major issue that has been explored in the literature. Karama et al. (2011) cognitive ability domains, and specific test requirements and idiosyncrasies. Cortical thickness has been previously associated with g. In the present study, we systematically analyzed associations between cortical thickness and cognitive performance with and without adjusting for the effects of g in a representative sample of children and adolescents (N=207, Mean age=11.8; SD=3.5; Range=6 to 18.3. years systematically analyzed associations of cortical thickness with cognitive performance with and without adjusting for the effects of general intelligence in a representative sample of children and adolescents. Cognitive domain and individual test scores and residualized scores were regressed against cortical thickness. They found that general intelligence and cognitive domain scores were positively correlated with cortical thickness in very similar areas across the brain. Furthermore, Yang et al. (2013) used the FSIQ and the cortical measurements to determine how much combining various cortical measures (cortical thickness, cortical surface area, sulcal depth, absolute mean curvature) explain human intelligence. They applied Partial Least Square (PLS) regression to overcome multicollinearity among cortical measures. They showed that 30% of FSIQ was explained by the first latent variable—mostly supported by cortical thickness—extracted from PLS regression analysis.
Moreover, Menary et al. (2013) performed a cortical thickness mapping analysis on data from 182 healthy, typically developing adults to identify correlates of general intelligence scores. They found a widely distributed pattern of positive associations between cortical thickness and general intelligence scores derived from the factor analysis of WASI subtest scores. Additionally, Margolis et al. (2013) investigated whether differences between abilities that affect performance on verbal and performance tasks correlate with cortical thickness. They found that a progressively thinner cortical mantle in anterior and posterior regions bilaterally was associated with more positive VIQ-regressed-on-PIQ scores, and a progressively thicker cortical mantle in anterior and posterior regions bilaterally was associated with more positive PIQ-regressed-on-VIQ scores. In another study, Schnack et al. (2015) examined the relationship between IQ and changes in cortical thickness over time in 504 healthy subjects. While at age 10, more intelligent children have a slightly thinner cortex than children with a lower IQ. By the age of 42, this relationship reverses so that a thicker cortex is associated with higher intelligence. Finally, Bajaj et al. (2018) examined the association between cortical thickness, cortical volume, cortical surface area, and cortical gyrification with PIQ, VIQ, and FSIQ in 56 healthy adults. They observed significant positive relationships between cortical thickness and all three IQ variables in regions within the posterior frontal and superior parietal lobes.
Overall, these findings show that brain morphology, or more specifically, brain volume, volumes of gray matter and white matter, the volume of subcortical anatomical features, and callosal and cortical thicknesses generally have positive correlations with intelligence. These findings are summarized in Table 1.
A possible future work could be finding the relation between the size of functional brain space and intelligence. The term functional space here refers to the space defined by sequential time-points of brain fMRI volumes comprised of high-dimensional signals of all voxels. To this end, topological data analysis can reduce the dimensionality of brain signals and calculate the volume or area of the active region in a low-dimensional space (Saggar et al., 2018).
3. Diffusion Imaging and Human Intelligence
Analyses on the white matter microstructure of a group of adolescents revealed positive correlations between FA and FSIQ in the right inferior fronto-occipital fasciculus (Wang et al., 2012). Clayden et al. (2012) showed that FA tends to increase or stay constant with age, while MD tends to decrease or remain constant in the whole brain. The highest variance in both FA and MD values has been found in the corpus callosum splenium (Clayden et al., 2012). Another research on subjects 18-50 years old shows a positive correlation of IQ scores with FA and their negative correlation with MD in the corpus callosum of men, without such correlations in women (Dunst, Benedek, Koschutnig, Jauk, & Neubauer, 2014). On the other hand, Navas-Sánchez et al. (2014) showed a positive correlation between IQ and FA, mainly in the corpus callosum of a group consisting of male and female subjects. Considering other tracts, a positive correlation between FA in the left corticospinal tract and superior longitudinal fasciculus and verbal IQ has also been observed in girls (Wang et al., 2012).
Nusbaum et al. (2017) studied the differences of WM regional differences in FA, MD, AD, and RD of two children’s profiles with High IQ (HIQ). They divided the children into two groups of homogeneous HIQ and heterogeneous HIQ, defined by a significant difference between verbal comprehension index and perceptual reasoning index. They used 48 regions and 21 fiber-bundles of WM. Hom-HIQ children presented higher FA than Het-HIQ children in widespread WM regions. AD was also greater in numerous WM regions of the Total-HIQ, Hom-HIQ, and Het-HIQ groups when compared to the control group. Hom-HIQ and Het-HIQ groups also differed by their hemispheric lateralization in AD differences compared to controls.
Properties of the brain structural network have been shown to significantly correlate with age but not with IQ scores (Fischer, Wolf, Scheurich, & Fellgiebel, 2014). Moreover, Koenis et al. (2018) stated that a correlation between intelligence and global and local efficiency of the brain increases with age. Another study utilized a graph network approach to examine sex differences in the relationship between WM efficiency, frontoparietal GM volume, and General Cognitive Ability (GCA). The results indicated that in males, a latent factor of frontoparietal GM was significantly related to GCA, while in females, WM efficiency and total GM volume were significantly associated with GCA.
Recently, Kocevar et al. (2019) utilized graph measures to characterize the brain’s structural connectivity and understand its relation with the neural substrate of intelligence in children. They revealed a strong relationship between high intelligence scores and the density of the network, mainly in the temporal and parietal lobes. Besides, WM of major fiber-bundle showed an increased axonal density associated with high intelligence.
Pisner et al. (2017) showed that cognitive performance was directly related to the structural connections in the brain. Moreover, Ponsoda et al. (2017) reported that the number of tracts between specific regions in the brain plays an important role in explaining cognitive ability differences among individuals. To understand the relation between the brain tracts and different types of IQ, several research projects have been done. A study of math-gifted adolescents showed increased FA in white matter connections between frontal lobes, basal ganglia, and parietal regions increase relative to controls (Navas-Sánchez et al., 2014). Also, higher fluid reasoning, visuospatial working memory, and creative capabilities in these children are correlated with enhanced connections between the forceps minor and the splenium. Different types of intelligence have been related to different features of the white matter tracts. For example, fluid intelligence has shown a positive correlation with the FA value of all tracts (Haász et al., 2013).
Moreover, understanding emotions is related to FA in tracts between somatosensory and sensory-motor regions, particularly those of the left superior longitudinal fasciculus and corticospinal tract (Pisner et al., 2017). Also, managing emotions is related to FA in the tracts between the frontal-parietal cingulum and the interhemispheric corpus callosum (Pisner et al., 2017). The FA of the tracts between the left posterior Medial Frontal Cortex (pMFC) and the rostral Anterior Cingulate Cortex (rACC) is related to the executive functions of the attentional control and general intelligence (Ohtani et al., 2017). Moreover, Nestor et al. (2015) utilized the Pearson correlation to investigate the relationship between mOFC-rACC tracts with intelligence and memory. Results showed a significant correlation between these connections and IQ.
Penke et al. (2012) investigated the relationship between general intelligence and 12 major fiber pathways. The FA of the tracts was positively correlated with general intelligence. They provided evidence that lower brain-wide WM tract integrity exerts a substantial adverse effect on general intelligence through reduced information-processing speed. Another study (Ponsoda et al., 2017) investigated the relationship between the structural connectivity pattern of individuals and their cognitive differences for executive control, recognition, learning, language processing, and visuospatial processing. The researchers selected the connections that could better predict the individuals’ cognitive scores. The selected connections are distributed across the entire brain, although their number is limited.
A novel computational approach—network control theory—was applied on DTI data by Kenett et al. (2018) to quantify the relation between the role of different brain regions in “driving” whole-brain neural dynamics related to creativity and intelligence. The strength of this approach is its ability to characterize the potential role of each brain region in regulating whole-brain network function based on its anatomical fingerprint and a simplified model of node dynamics. Results showed that intelligence is related to the ability to “drive” the brain system into easy to reach neural states by the right inferior parietal lobe and lower integration abilities in the left retrosplenial cortex.
More recently, Genç et al. (2018) have used advanced multi-shell diffusion tensor imaging combined with a culture-fair matrix-reasoning test to show that higher intelligence in healthy individuals is related to lower values of dendritic density and arborization.
According to the DTI studies reviewed and summarized in Table 2, there is no significant correlation between the global mean of diffusion indices and IQ, while local diffusion indices are correlated with verbal IQ in the left hemisphere and nonverbal IQ in the right hemisphere. Significant differences were found in network properties such as the total number of edges and global efficiency between people with high IQ and low IQ. Future studies may utilize a larger sample size to obtain a higher confidence level. They may also find robust diffusion indices and brain subnetworks predicting IQ.

4. fMRI and Human Intelligence
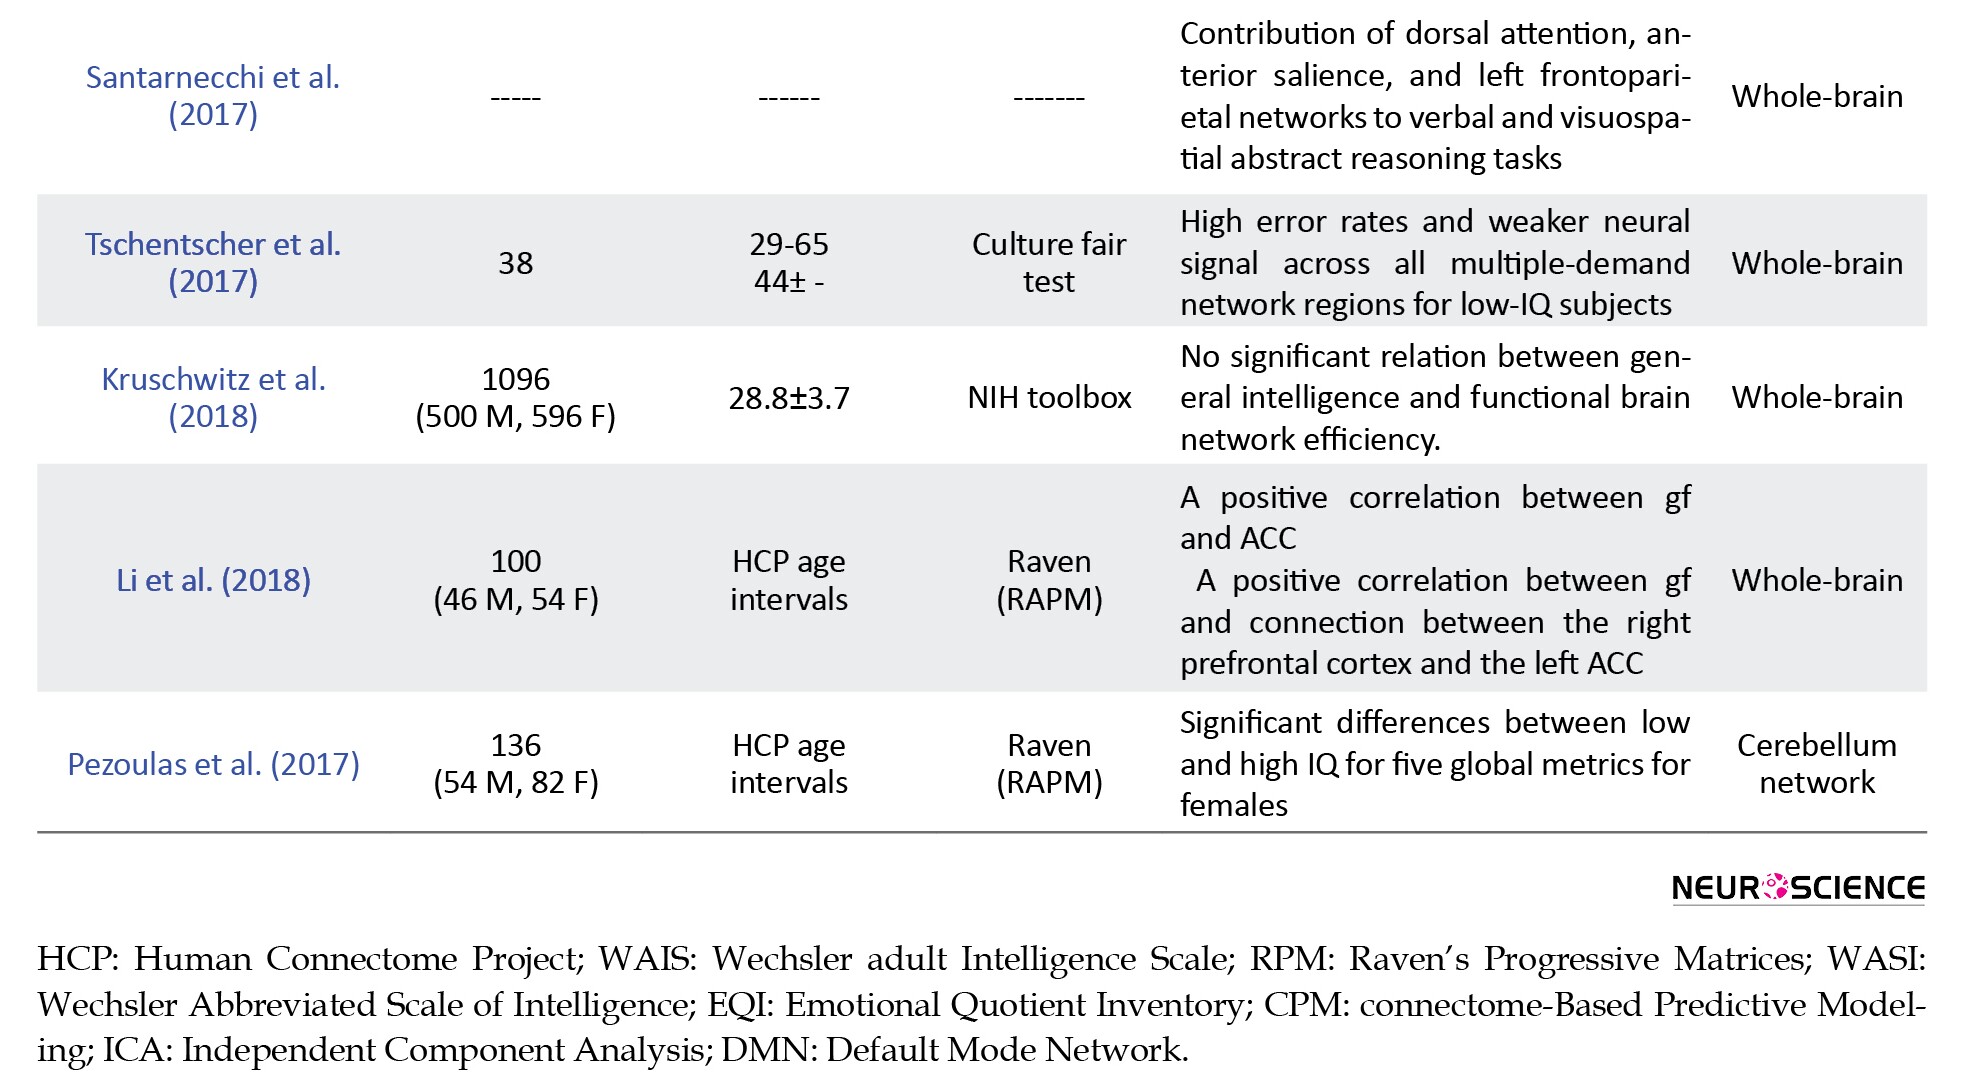
The statistical analysis of this paper (Pezoulas et al., 2017) revealed that local MST metrics did not have any significant differences between the low and high IQ groups. This study used the amplitude of low-frequency BOLD fluctuations to find the regions that were related to gf. The most notable finding was that the left Anterior Cingulate Cortex (ACC) and right Middle Occipital Gyrus (MOG) could predict gf. Besides, to investigate whether the connectivity of these two regions was related to intelligence, FC maps of these regions with regions across the whole brain were computed. The connection of left ACC with other regions was correlated to gf. Most contributing regions were located in the right prefrontal cortex.
Based on previous studies (Koziol et al., 2014; Styliadis, Ioannides, Bamidis, & Papadelis, 2015), the lobes that are most related to intelligence including prefrontal and posterior parietal lobes have many connections to Cerebellum. In this regard, Pezoulas et al. (2017) compared the network of cerebellum in individuals with low and high IQ. This study used the resting-state fMRI data of 136 subjects who participated in HCP. A Minimum Spanning Tree (MST) is a spanning tree that preserves only the edges that minimize the sum of the weights of the edges. It compacts the graph representation to simplify the distinction of different populations by calculating different graph metrics, including degree, between centrality, and eccentricity. The statistical analysis of this paper (Pezoulas et al., 2017) revealed that local MST metrics did not have any significant differences between the low and high IQ groups. Moreover, no significant differences were exhibited on any global metrics between the low and high IQ males. Conversely, significant differences were found for 5 global metrics between females with low and high IQ.
Several studies investigated the relationship between intelligence and global efficiency for the various dataset and obtained contradictory results. To solve this contradiction, Kruschwitz, Waller, Daedelow, Walter, and Veer (2018) performed a replication of the previously reported association between general intelligence and global functional network efficiency using large sample size and high-quality data of HCP. They tested for separate association of crystallized and fluid intelligence with graph metrics such as global efficiency, characteristic path length, and global clustering coefficient. They found no significant relationship between general intelligence and functional brain network efficiency. Moreover, Hilger, Ekman, Fiebach, and Basten, (2017a) evaluated the relationship between nodal and global measures of efficient network organization (i.e. nodal efficiency and global efficiency) and IQ scores. The results indicated no significant relationship between worldwide efficiency and IQ. However, nodal efficiency was significantly associated with intelligence in 3 brain regions. In particular, individuals with higher IQ scores had higher nodal efficiency in the right Anterior Insula (AI) and the dorsal Anterior Cingulate Cortex (dACC). While in the left Temporoparietal Junction Area (TPJ), the association between IQ scores and nodal efficiency was negative. It is reasonable to consider heterogeneity in the distribution of functional connectivity across the brain network, clustered into subnetworks (modules, communities) that are densely connected internally and weakly coupled with the rest of the network. Within these modular brain networks, each node is characterized by a specific profile of within- and between-module connectivity, determining the node’s functional role in neural processing within and across different modules. Hilger, Ekman, Fiebach, and Basten, (2017b) explored the relation between IQ scores and modular structure of the brain. They showed that intelligence was not associated with the global modularity features (e.g. number or size of modules) or the whole-brain proportions of different node types (e.g. connector hubs or provincial hubs). In contrast, there was a significant relationship between intelligence and node-specific measures of within- and between-module connectivity in the frontal and parietal brain regions previously linked to intelligence.
Malpas et al. (2016) also explored the relationship between intelligence and functional connectivity across the whole brain. The results of this paper emphasized that a single functional sub-network was significantly associated with full-scale IQ. This sub-network contained 44 nodes, including 20 nodes in the frontal, 11 in the temporal, 9 in the parietal, and 4 in the occipital lobes. Furthermore, Hearne, Mattingley, and Cocchi (2016) evaluated the relationship between functional connectivity and individual IQ scores using Network-Based Statistics (NBS). Functional connectivity matrices were used as input into NBS. The results showed that connections between prefrontal and frontal cortices comprising the dorsal attention network had significant correlations with intelligence. Significant associations were observed for the posterior cingulate/precuneus, the superior parietal cortex, and the occipital cortex. Resting-state functional connectivity between bilateral prefrontal cortices encompassing the dorsal attention network and the right insula was also associated with the intelligence scores. Pamplona et al. (2015) investigated the association between various graph metrics of functional network and intelligence calculated by the Portuguese language version of the WAIS. Some previous findings were extended to the Portuguese-speaking population, specifically the presence of small-world organization of the brain and the relationship of the intelligence with the connectivity of the frontal, pre-central, parietal, occipital, fusiform, supra-marginal gyrus, and the caudate nucleus. No significant correlation was found between intelligence, and characteristic path length, global efficiency, and local efficiency except that verbal comprehension were associated with global network efficiency.
Finn et al. (2015), using functional connectivity data and Connectome-based Predictive Modeling (CPM), showed that the characteristic connectivity patterns were distributed throughout the brain, but the frontoparietal network emerged as distinctive. Other studies have confirmed that the interaction between parietal and frontal brain regions can describe the individual differences in intelligence. Langeslag et al. (2013) investigated this relationship for young children. These authors applied ICA on resting-state fMRI data of 115 healthy young children. They found that nonverbal intelligence positively correlated with functional connectivity between right parietal and right frontal regions and between right parietal and dorsal anterior cingulate regions. They concluded that connectivity between the parietal and frontal lobes was involved in intelligence in young individuals too.
Until 2011, no study focused on the relationship between intelligence and local functional connectivity of the brain. Wang et al. (2012) investigated the correlation between intelligence and local connectivity using the regional homogeneity (ReHo) as an index for evaluating the local connectivity. They used the resting-state fMRI data of 59 healthy participants. They found a positive correlation between IQ scores and ReHo values of the bilateral inferior parietal lobules, middle frontal, parahippocampal and inferior temporal gyri, the right thalamus, superior frontal, and fusiform gyri, and the left superior parietal lobule. The authors concluded that their findings are consistent with the Parieto-Frontal Integration Theory (P-FIT).
Several studies explored the neural basis of intelligence using task-based datasets. These studies used the data collected while participants were performing a set of tasks related to intelligence. These tasks were either IQ tests or cognitive tests. In the remaining of this section, these studies are reviewed.
A set of frontal and parietal brain regions—the Multiple-Demand (MD) network—has been linked to fluid intelligence. Besides, fluid intelligence is linked to task complexity. The joint influence of fluid intelligence and task complexity to neural activity of multiple demand network was investigated by (Tschentscher, Mitchell, & Duncan, 2017). In this study, 38 subjects were divided into two groups, a high-IQ group, and a low-IQ group. The participants were asked to press a key with the right hand to the cued target and to ignore the images related to a different cue (lure) as well as images associated with no cue (fillers). ANOVA was applied to parameter estimates of targets and lures, with factors “complexity,” “IQ group,” “stimulus” (targets vs lure), “hemisphere” (left vs right), and ROI. The results of this paper indicated that for more complex tasks, low-IQ subjects showed high error rates, as well as weaker neural signals across all multiple-demand network regions.
A recent meta-analysis (Santarnecchi, Emmendorfer, & Pascual-Leone, 2017) investigated the 47 available fMRI and PET studies about gf in humans. The authors classified the studies based on the type of stimuli, the different problem-solving stages (rule inference and rule application), and task difficulty. They found spatially segregated networks of cortical and subcortical regions related to gf processing. Dorsal attention, anterior salience, and left frontoparietal networks mostly contributed to verbal and visuospatial abstract reasoning tasks. More difficult trials engaged in the additional contribution of language and left frontoparietal networks. In a subsequent study, Santarnecchi, Emmendorfer and Tadayon (2017) implying that a fine characterization of brain dynamics recorded during resting-state might be informative for the understanding of evoked behavior. In a recent work, we listed and detailed the sets of regions showing robust co-activation during the solution of fluid intelligence (gf suggested a quantitative validation for their previous meta-analysis study. They assessed their findings for two different datasets with 84 and 130 healthy subjects. The results indicated a strong similarity between the connectivity profile of the gf network and the dorsal attention network. Besides, there was an overlap between the gf network and left and right frontoparietal networks. Consistent with previous studies, a negative correlation was detected between gf regions and medial prefrontal structures of the DMN, a significant predictor of intelligence scores.
Multiple studies found that resting-state networks were present during a wide range of tasks and that functional connectivity patterns were minimally modified during tasks. Schultz and Cole (2016) tested the hypothesis that these small portion of task-evoked FC updates from rest were strongly associated with behavioral performance. They used the fMRI data of 100 unrelated subjects of HCP. They focused on the language, reasoning, and working memory tasks. Cole et al. (2012) found that similarity between rest and task FC configurations was positively correlated with performance in all three tasks. In other words, they defined the FC reconfiguration efficiency factor as the similarity between rest and task FC structure. Considering this definition, it was shown that fluid intelligence was positively correlated with FC reconfiguration efficiency.
Functional networks extracted during task engagement and resting-state were compared by Vakhtin, Ryman, Flores, and Jung (2014) no functional magnetic resonance imaging study to date has conducted a whole-brain network-wise examination of the changes during engagement in tasks that are reliable measures of general intelligence (e.g. Raven’s Progressive Matrices Test; RPM using fMRI data of 79 healthy subjects. For each subject, fMRI data were collected during resting state and engagement in Raven’s progressive matrices test. This study provided a network-wise insight into the P-FIT framework. In this regard, functional networks were derived using ICA for both resting state and RPM task data. Comparing these extracted networks indicated that the regions involved in task-related functional networks were consistent with P-FIT. Moreover, it was shown that general features of functional brain networks were constant across resting state and engagement in a complex cognitive task.
Unlike previous studies which focused on the relationship between intelligence and brain activation of Task-Positive Network (TPN), Basten, Stelzel, and Fiebach (2013) additionally considered the Task-Negative Network (TNN). They investigated the effects of intelligence on neural activity in TPN and TNN using fMRI data of 52 healthy participants scanned while performing working memory tasks. The authors defined the neural effort as signal increase in TPN and signal decrease in TNN. While the neural effort in TPN and TNN increased with task difficulty, the neural effort of these networks related to intelligence was different. There was a positive association in TPN and a negative association in TNN.
Another task-based fMRI study (Ebisch et al., 2012) explored the neural basis of cognitive components underlying gf, including induction, visualization, and spatial relationship abilities. In this study, 22 healthy subjects performed a set of induction, visualization, and spatial relationship tasks while undergoing an fMRI scan. Ebisch et al. (2012) found that these different tasks revealed common activation patterns and concluded that while gf comprises distinguishable cognitive abilities, it is associated with a common network, named frontoparietal network. Graham et al. (2010) compared the neural activity of 28 healthy subjects with different IQ scores. This study compared event-related fMRI activation during cognitive set-shifting tasks between two groups, average-IQ and high-IQ. They found that the prefrontal and anterior cingulate regions of the average-IQ group have more activity during the response selection phase, consistent with the neural efficiency hypothesis. Inversely, during the feedback phase, the high-IQ group revealed greater activation in many regions associated with complex reasoning, including parietal, caudate, fusiform, and occipital regions. Although this result may be considered inconsistent with neural efficiency, it was interpreted as follows: high-IQ individuals were more strategic in evaluating feedback about the next trial and thus executed their responses more quickly (Table 3).

5. Multimodal Imaging and Human Intelligence
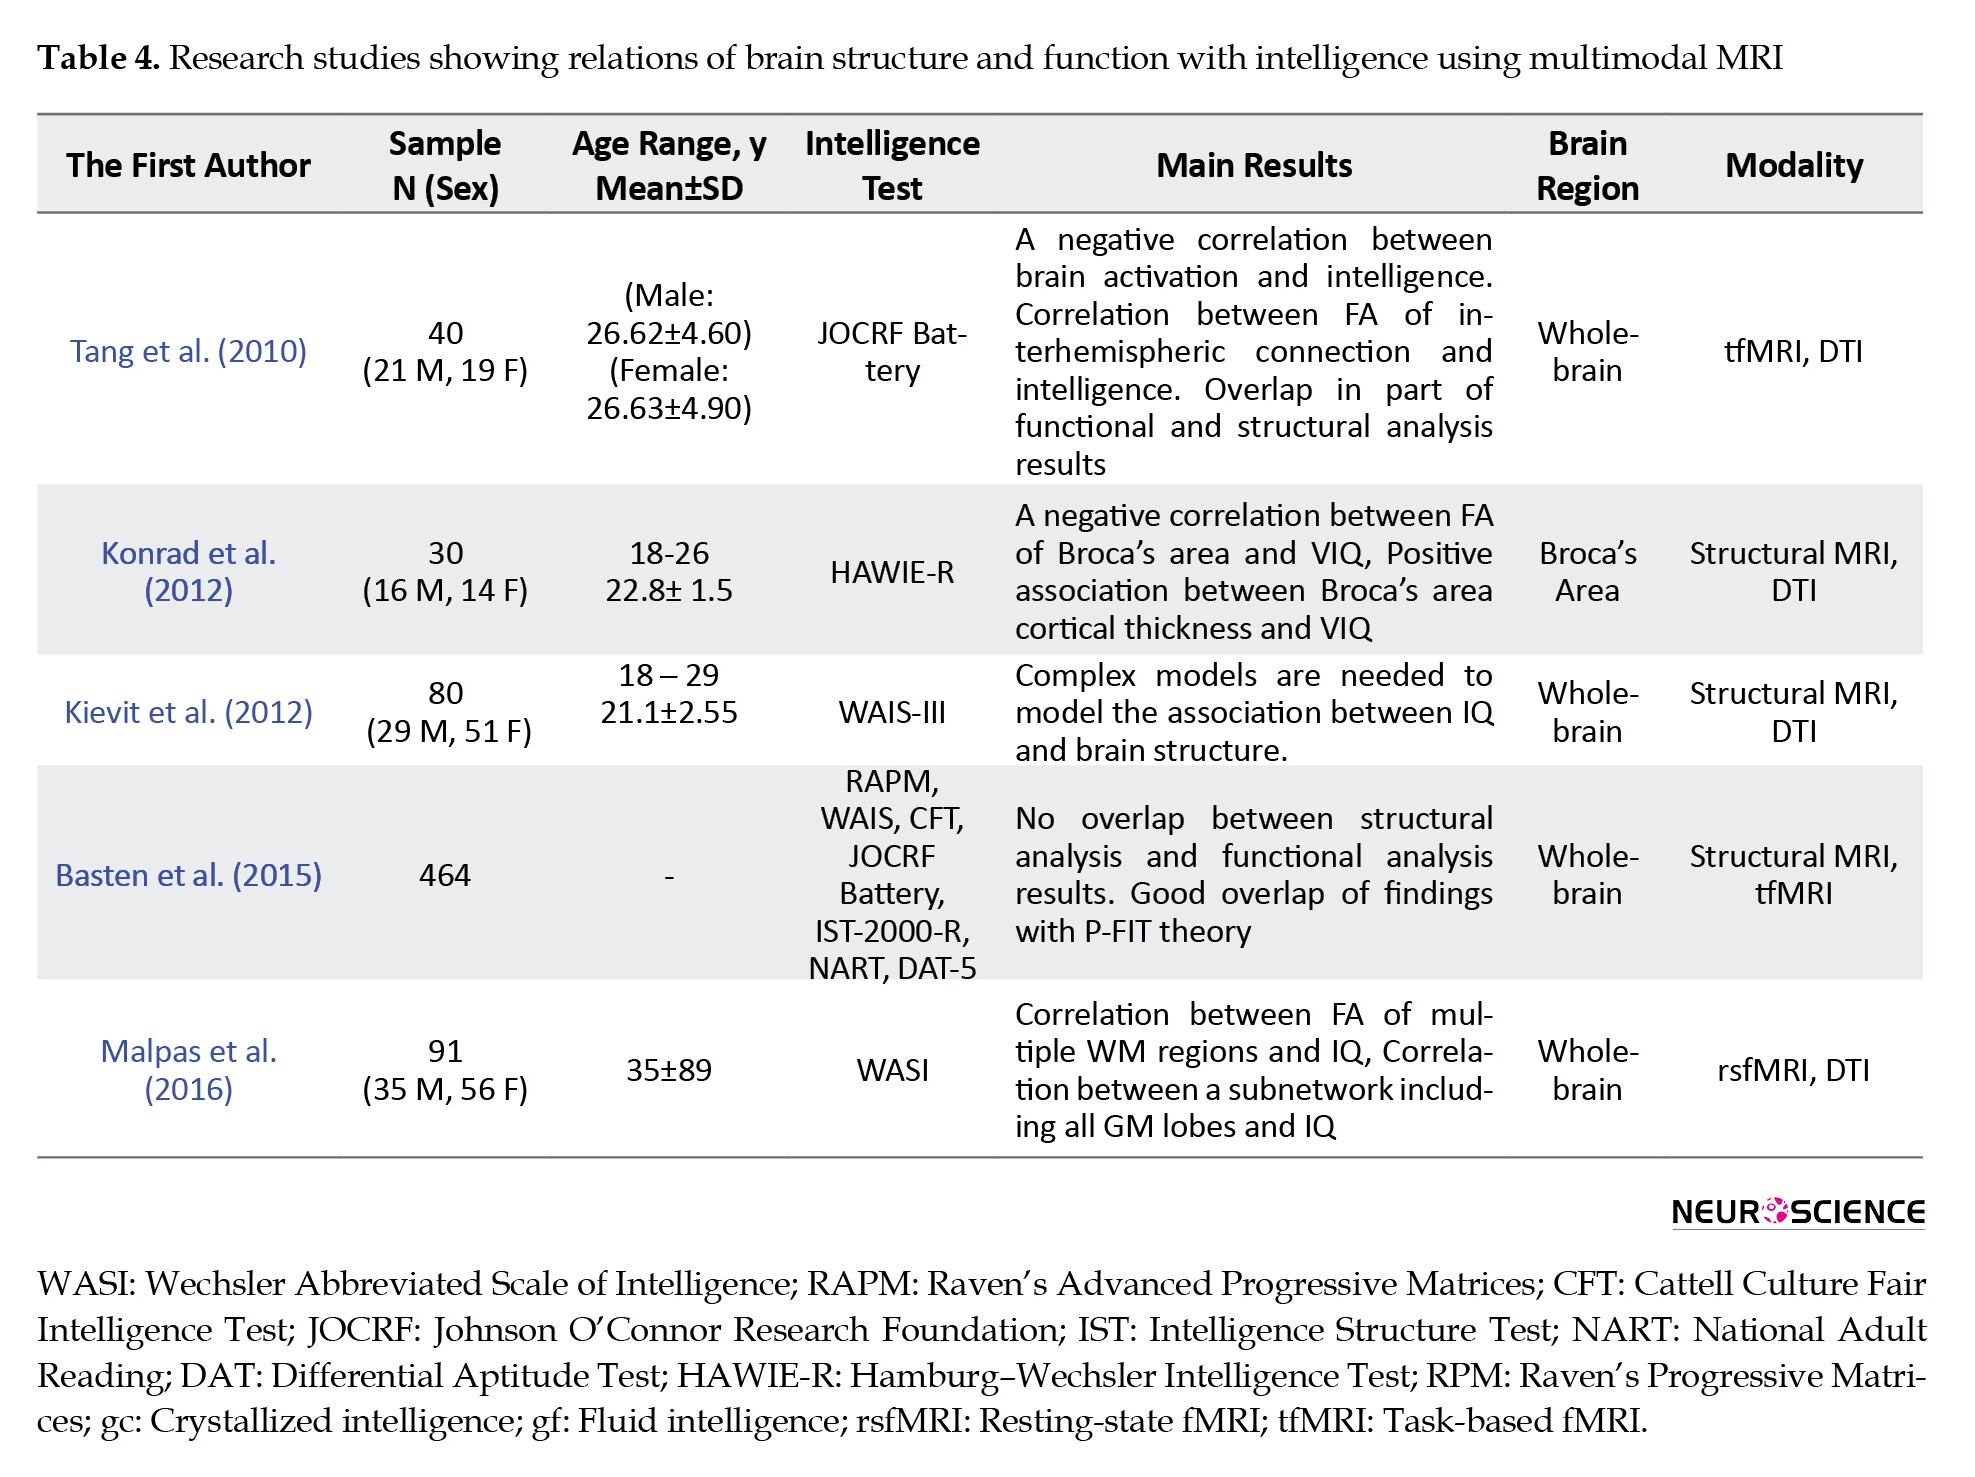
One of the first multimodal fMRI-DTI studies on IQ was performed by Tang et al. (2010). The authors investigated the relation of the brain and intelligence using fMRI and DTI techniques. Their main goal was to determine whether the parietofrontal network underlies the g-factor of intelligence or not. In their study, they assessed intelligence using the 8 tests in the Johnson O’Connor Research Foundation (JOCRF) battery and estimated a general intelligence g-score for each subject. They investigated the relationship between the level of activation during a working memory task and intelligence using fMRI. Besides, they performed tractography to find the connection of the activated regions through the white matter fiber tracts. Finally, they investigated the integrity of the axonal connections using an ROI-based method. Their results were in line with the Parietofrontal Integration Theory (P-FIT) of intelligence. They stated that the brain activation level was negatively correlated with general intelligence, speed of reasoning, numerical ability, and spatial ability. For DTI, positive and negative correlations were reported respectively between men’s and women’s axonal integrity and intelligence in some specific parts of the interhemispheric and intrahemispheric white matter connections. They concluded that the brain structure and function underlie individual differences in intelligence.
In another study, testing the P-FIT theory using a multimodal approach, Basten, Hilger, and Fiebach (2015) performed a voxel-based quantitative meta-analysis of 16 fMRI and 12 structural MRI studies to test whether there is spatial convergence across studies. Their focus was on two types of studies. First, the studies which reported a correlation between brain activation during a cognitive task and intelligence. Second, the studies reported a correlation between the gray matter density, estimated using VBM, and intelligence. For the functional meta-analysis, they only considered studies that used an Individual Differences (ID) approach. Unlike the task approach that investigates neural correlates of processing a particular task, the ID approach finds the area which shows the difference between individuals during a cognitive test. Although they failed to find an overlap between functional and structural results, each of their results had a good match with the P-FIT theory. Based on the differences between their results and those of the P-FIT theory, they proposed an updated account for the P-FIT theory. For the fMRI analysis, in contrast to the P-FIT theory, they did not find a relationship between intelligence and sensory regions in the temporal and occipital lobes. They concluded that the use of the task approach might result in finding activation in sensory cortical regions in addition to the cognitive control regions of the brain. In addition to the brain regions included in the P-FIT theory, from this meta-analysis, they found three new areas that correlate with intelligence, including the Posterior Cingulate Cortex (PCC), caudate, and midbrain. PCC plays an important role in DMN based on the previous studies. For the structural analysis, the frontopolar cortex was associated with intelligence, but unlike the P-FIT theory, the temporal and occipital cortices were also related to intelligence.
One of the most well-known hypotheses relates brain activation to intelligence, is the neural efficiency hypothesis (Neubauer & Fink, 2009). It states that people with higher intelligence need less neural effort during a cognitive task compared to normal people. Basten, Hilger, and Fiebach (2015) reported that people with higher intelligence do not generally show less activation. They stated that, first, for an accurate interpretation of individuals’ differences in the brain activation related to cognitive performance, the behavioral performance must be equal across the subjects to compare activation (neural effort). Secondly, most of the older studies used PET and EEG for finding the correlation between brain activation and intelligence, and they mostly reported negative correlation, which resulted in proposing the neural efficiency hypothesis of intelligence. On the other hand, more recent fMRI studies report a positive correlation between the level of activation and intelligence. In their meta-analysis, most of the correlations are also positive.
In contrast with the two mentioned studies, which used task-based fMRI, more recent studies tend to use resting-state fMRI and also utilize it in a multimodal study to investigate the functional network of the brain. Malpas et al. (2016) investigated the relationship between function and structure of the brain using DTI and resting-state fMRI. General intelligence was estimated using WASI. Network-Based Statistics (NBS) approach was performed on the fMRI data and Tract-Based Spatial Statistics (TBSS) on the DTI data. They reported a positive correlation between FSIQ and FA within the right anterior thalamic radiation, the left superior longitudinal fasciculus, the left inferior frontal-occipital fasciculus, and the left uncinate fasciculus. For the fMRI data, a single subnetwork, which is most dominant in the frontal and parietal regions, correlates with the full-scale IQ. They concluded that a positive correlation between FA across the entire white matter and intelligence shows that smarter individuals have a greater white matter organization. The fMRI findings are mostly in line with the DTI findings and the P-FIT theory.
Structural features of the brain play an essential role in the MRI multimodal studies of intelligence. there is still little evidence about the relationship between verbal intelligence and structural properties of the brain. Konrad et al. (2012) investigated the relationship between verbal intelligence and structural properties of the brain using structural and diffusion MRI. They assessed IQ using the Hamburg-Wechsler Intelligence Test (HAWIE-R), which includes measurement of verbal and performance IQ. Using diffusion MRI, they performed voxel-wise regression analysis to find a possible correlation between FA and MD with verbal IQ. Using T1-weighted MRI, they assessed the relationship between VIQ and brain volume. They found a negative correlation between VIQ and FA and a positive correlation between VIQ and MD in the left-hemispheric Broca’s area. Although their VBM regression analysis did not show significant results, analysis of the FA correlated regions in the Broca’s area showed a positive correlation between the gray matter thickness and VIQ.
In another study using VBM and DTI, Kievit et al. (2012) used Structural Equation Modeling (SEM) to model the association between intelligence measures used to obtain g, and brain features. Using VBM and TBSS, they extracted 8 regions that had a strong correlation with FSIQ. To perform structural equation modeling analysis, they modeled 12 variables: 4 measurements of intelligence (WAIS score) and 8 measurements of DTI and VBM regions. Next, a set of methods from simple to the complex were used for fitting the SEM model. From the 4 tested methods, the Multiple Indicator Multiple Cause Model (MIMIC), as the most complex method tested, showed the best fit and was not declined by the Chi-square test of model fit. In this method, the contribution of various brain ROIs to g is estimated separately. They concluded that complex models are needed to describe the association between brain structures and intelligence.
Based on the multimodal studies reviewed and summarized in Table 4, the results of the structural and functional studies of intelligence do not necessarily overlap even though similarity in findings in some parts of the parietofrontal region of the brain has been reported. Most multimodal studies used the first aforementioned approach in which different modalities were analyzed separately and the analysis results compared. Future studies might integrate different modalities in a unified analysis protocol to explore all information embedded in the multimodal data. Moreover, it seems reasonable to integrate EEG with fMRI to further investigate possible bases of intelligence in the brain.
6. Predicting Intelligence From Neuroimaging Data, the State-of-the-Art of Individualized Prediction of Intelligence
The studies inferring how brain properties can be explained from intelligence through statistical methods, whether morphological, structural, physiological, or metabolic brain characteristics, have led to several discoveries towards the neurobiological basis of intelligence. However, they might miss higher complexity patterns. Shifting the goal from method-driven inference to prediction using statistical learning methods allows one to perform a data-driven search for generalizable patterns in populations (Bzdok, Altman, & Krzywinski, 2018). Not surprisingly, statistical learning has enjoyed growing popularity in the imaging neuroscience community (Amin et al., 2018; Bzdok, 2017; Meng et al., 2017). The machine-learning-based estimation of age from neuroimaging has proven to be a robust biomarker of brain health (Cole & Franke, 2017).
Indeed, following that trend, using machine learning to estimate the individualized intelligence from neuroimaging data is in practice already, including brain surface neuroanatomical features (Yang et al., 2013), connectivity matrices (Finn et al., 2015), and functional activation patterns (Choi et al., 2008). This research area is still developing—the earliest work being only a decade old—and most of the literature has been published in the last three years.
Predictive modeling of intellectual scores from neuroimaging lends itself naturally to regression, as scores are defined on a dense numerical scale. For this reason, the most often employed evaluation metric is the explained variance, defined as one minus the ratio of the variance of the residuals and the variance of the observations. Discrimination between groups of performance levels could also be modeled, but some information is lost in the discretization of scores.
Choi et al. (2008) were the first to build a predictive model of intelligence from neuroimaging data, termed the Neurometric IQ model. They showed that morphometry, specifically cortical thickness, influences gc the most, while gf is mostly associated with the spatial patterns of functional activation of a demanding fluid reasoning task. The authors retrieved a series of functional and anatomical features from these findings, including brain volume as an a priori informative feature. They built a linear model predicting FSIQ, explaining one-half of the variance on the unseen data. Indeed, brain volume is the single most predictive feature for estimating intelligence, as highlighted before in this paper.
Yang et al. (2013) used Partial-Least Squares (PLS) regression on morphometric characteristics of the brain surface, explaining over 30% of the variance in IQ from the first latent variable alone. The authors demonstrated that regional cortical thickness had stronger explanatory importance than local surface area, sulcal depth, or absolute mean curvature. Among all regions, the morphometry of parahippocampal gyri was more correlated to IQ.
Finn et al. (2015) also established the relevance of the connectivity profiles to behavior by demonstrating, in a leave-one-subject-out cross-validation analysis, that functional connectivity profiles can be used to predict the fundamental cognitive trait of fluid intelligence across subjects. It shows that the characteristic connectivity patterns are distributed throughout the brain, but the frontoparietal network emerges as distinctive. Furthermore, connectivity profiles predict levels of fluid intelligence. The networks that are most discriminating of individuals are also most predictive of cognitive behavior. Their results indicate the potential to draw inferences about a single subject based on functional connectivity.
Wang et al. (2015) employed multi- and single-kernel Support Vector Regression (SVR) to predict FSIQ from gray and white matter regional volumetry in typical children and adolescents. The authors report an optimal R2 of 0.516, remarkably higher than that of the total brain volume. This result suggests that local morphometric estimates are more specific to the problem of intelligence estimation.
CPM was first introduced with an application to the prediction of gf, explaining 25% of the variance of this factor of intelligence from resting-state fMRI (Finn et al., 2015). They demonstrate that the CPM protocol performs as well as or better than many of the existing approaches for brain-behavior prediction. Its findings were tested by other authors but not fully corroborated (Dubois, Galdi, Han, Paul, & Adolphs, 2018; Nielsen et al., 2018; Noble et al., 2017; Yoo et al., 2019). CPM is easily implemented and performed (Shen et al., 2017). It consists of filtering edges in a univariate fashion based on their correlation to the behavior variable of interest, summing the edges above the threshold, and building a linear regression model predicting the behavior of interest from this sum. The developers of CPM recommend treating negative and positive edges separately, resulting in two sums of edges per subject. A limitation of CPM is that it arbitrarily assumes that edges contribute equally to prediction, a decision based on the necessity of simpler models due to scarcity of data (Dubois et al., 2018).
Dubois et al. (2018) demonstrated that 20% of the inter-subject variability of general intelligence could be explained from resting-state functional connectivity matrices alone, an effect at the same level of magnitude as brain volume. They also showed that no single anatomical region or brain network was substantially more important for this prediction task. This suggests that general intelligence information is spread across the brain in a redundant fashion. When looking at predictions from single networks, though, it becomes evident that the DMN, FPN, CON, and VIS networks achieve better performance than the AUD, SMN, and DAN networks, mostly in agreement with the P-FIT theory. Their work is also important because it showed, accounting for several confounding factors, resting-state functional connectivity might be just as informative as brain volume, with added discriminability of function.
The predictability of intelligence from resting-state functional connectivity is still debated. Through the use of CPM, Greene, Gao, Scheinost, and Constable (2018) could explain around 20% of the variance of fluid intelligence with task fMRI in contrast to only 6% with resting-state fMRI, with data from the HCP and PNC (Philadelphia Neurodevelopmental Cohort) (Satterthwaite et al., 2016, 2014) cohorts. This result could be explained by the perturbations in brain activity elicited by the tasks being related to individual traits. They also showed that predictive performance varies per task for each sex, which must be explored further. Jiang et al. (2017) obtained a similar result with resting-state fMRI, where intelligence from females can be more reliably estimated than males. These researchers tested different regression models and found ReliefF + LASSO as the best predictor. In Greene et al. (2018), the resting-state lend itself better to predicting intelligence for males but with trivial performance.
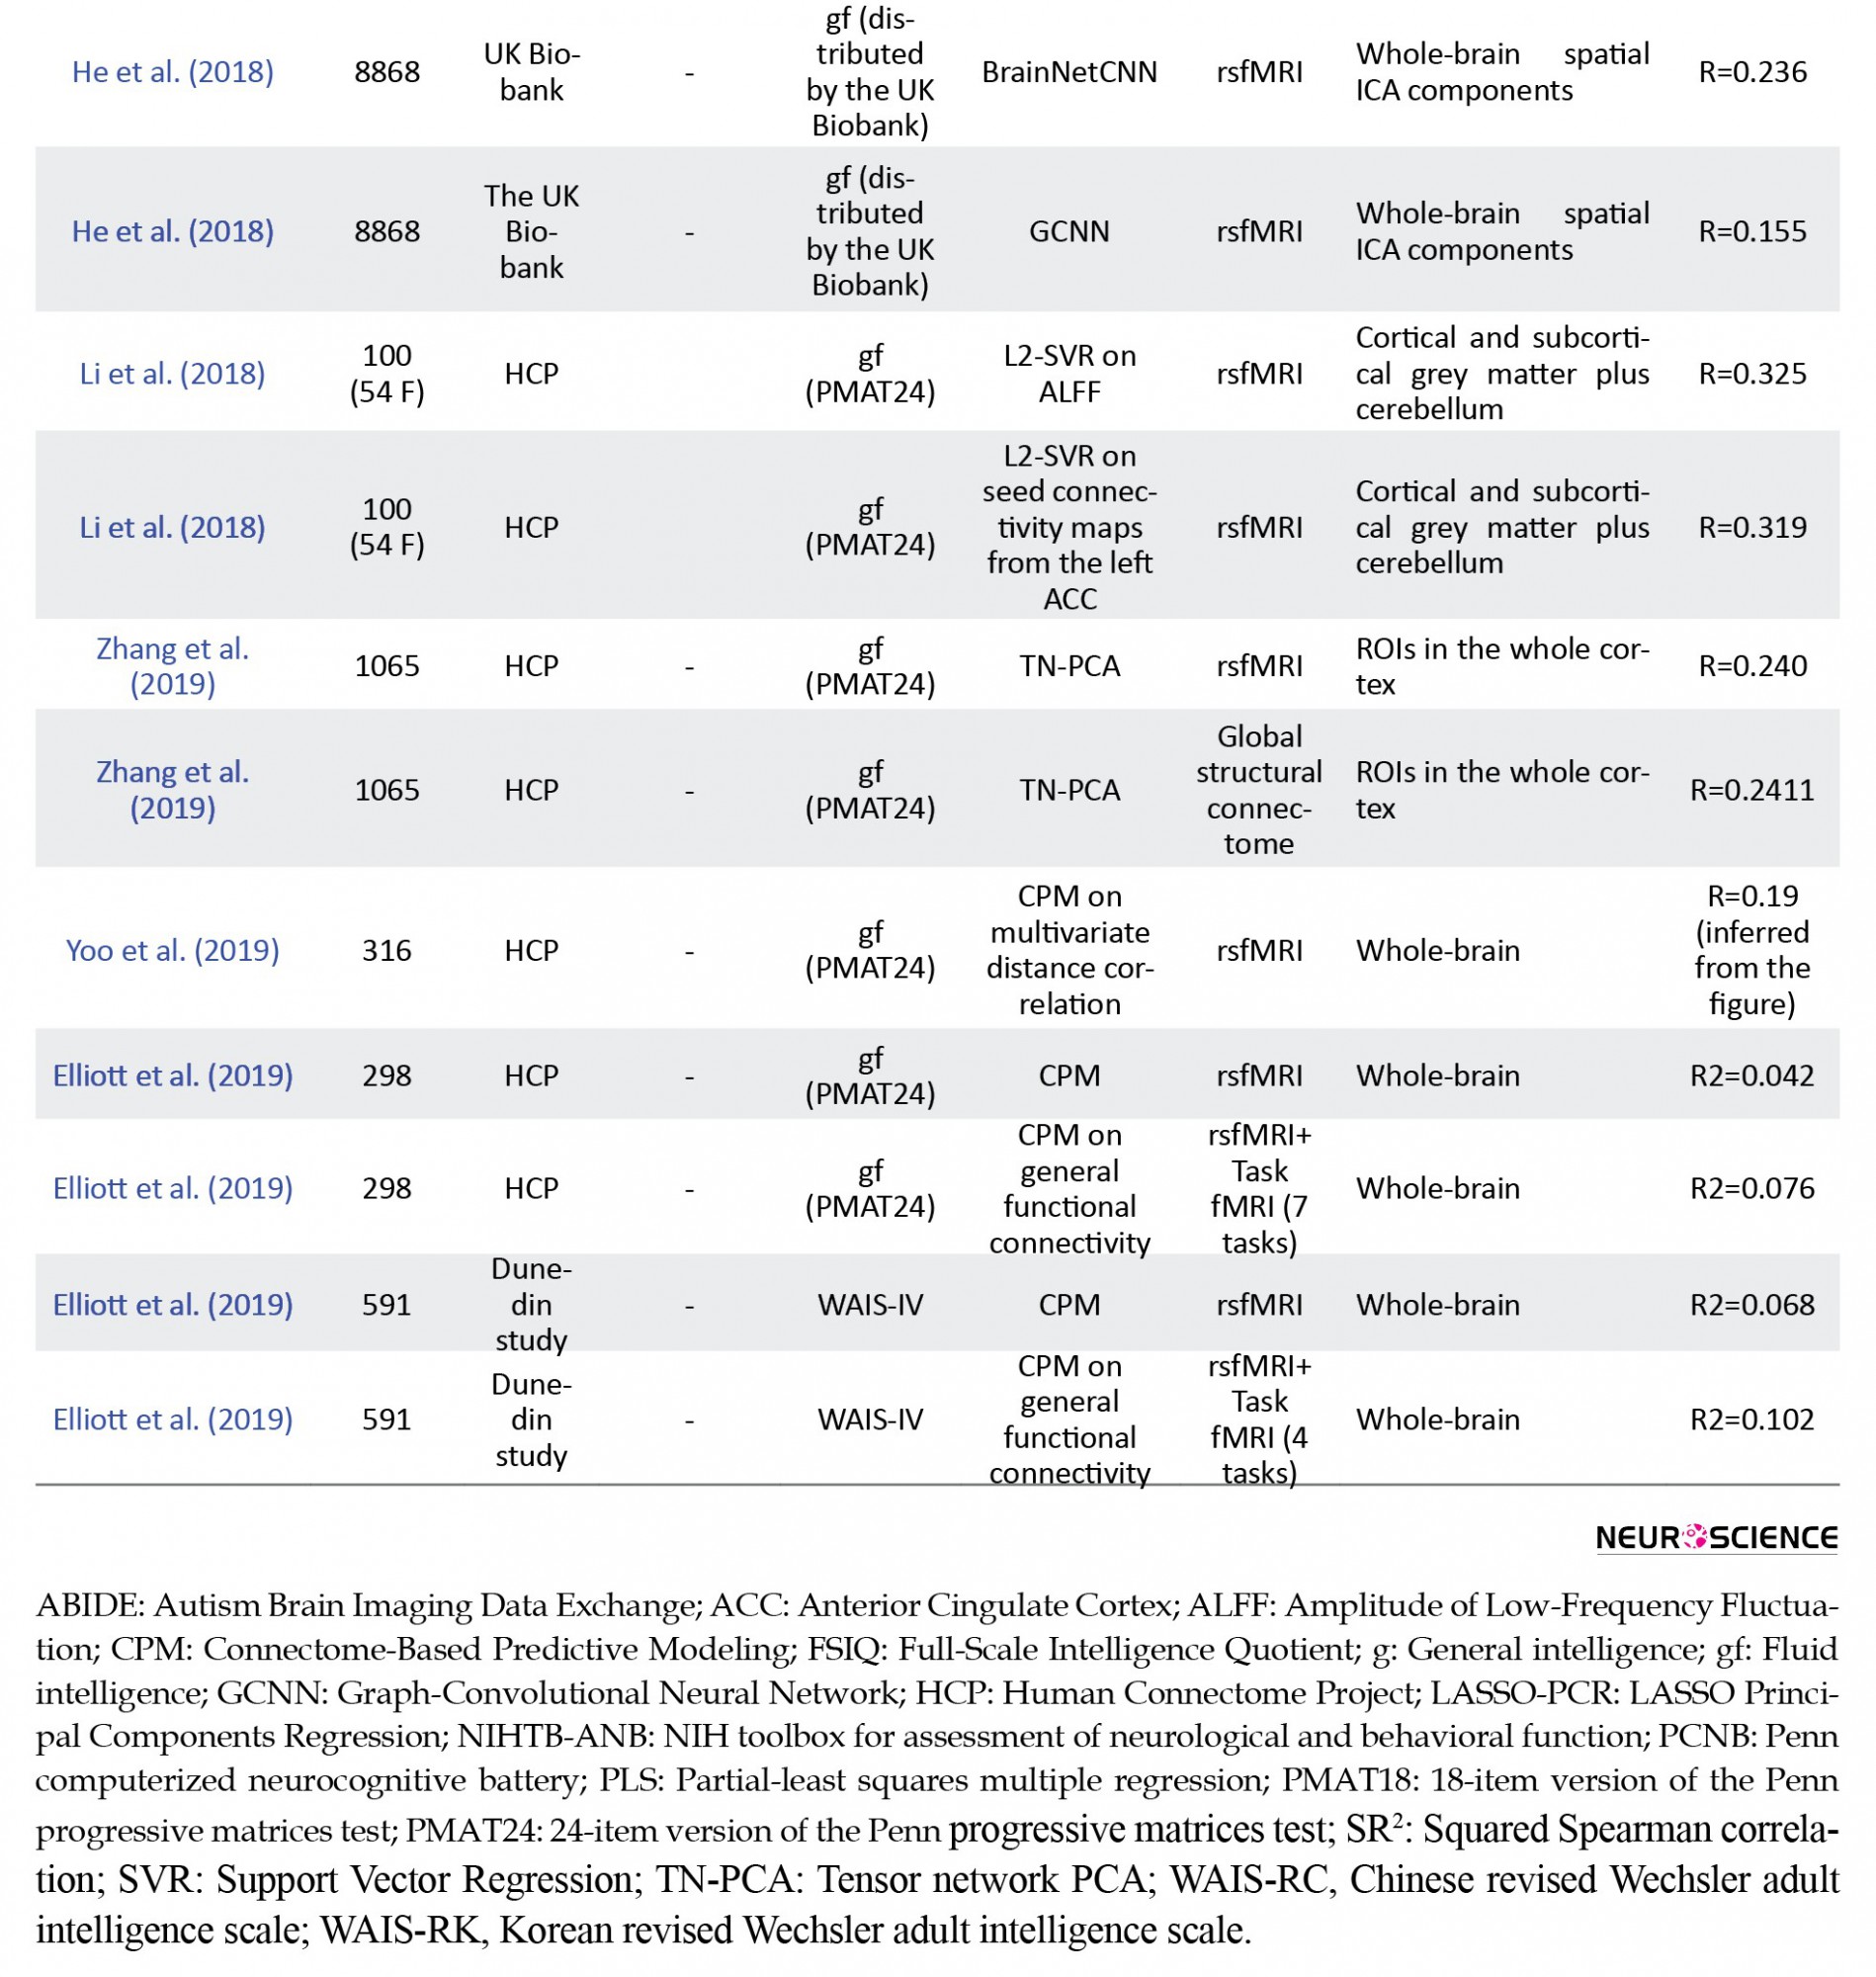
On the other hand, Elliott et al. (2019) used CPM to predict cognitive ability by both resting-state functional connectivity and general functional connectivity, a new measure that combines both task and resting-state functional connectivity information. In the HCP dataset, resting-state functional connectivity predicted 4.2%, while general functional connectivity explained 7.6% of cognitive ability, obtained from the Penn progressive matrices test. Results were reproduced in the Dunedin study dataset. Even though adding task connectivity information improves the reliability of functional connectivity estimates, performance in cognitive ability estimation is substantially small.
Yoo et al. (2019) compared univariate and multivariate functional connectivity estimates and how multivariate approaches based on multivariate distance correlation improve the prediction of individual behavior. Using CPM, their work showed that distance correlation explains no less variation than the Pearson correlation-based connectivity requiring less acquisition time. With just 160 time-points, they obtained a correlation of circa 0.19 between predictions and estimates of fluid intelligence received from the Penn progressive matrices test.
Comparing kernel regression and artificial neural networks in the prediction of behavior from functional connectivity from almost 10000 subjects in the UK Biobank and HCP, He et al. (2018) demonstrated that a relatively simple kernel regression, with the kernel defined as the Pearson correlation between subjects’ functional connectivity matrices, does not underperform compared to sophisticated models based on artificial neural networks. A correlation of circa 0.27 between predictions and fluid intelligence, defined as the Penn progressive matrices test results, was found for the HCP data, for kernel regression, a feed-forward neural network, and the BrainNetCNN, which is an architecture tailored to work on functional connectivity matrices (Kawahara et al., 2017). The correlation between predictions and fluid intelligence estimates in the UK Biobank dataset was estimated as 0.239 for both kernel regression and the feed-forward neural network, with the BrainNetCNN achieving a correlation of 0.236. In both datasets, the Graph-convolutional neural network (Parisot et al., 2018) underperformed. These experiments raise the possibility that fluid intelligence information lies in a linear manifold contained in resting-state functional connectivity matrices.
Li et al. (2018) employed L2-SVR to predict gf from regional estimates of the Amplitude of Low-Frequency Fluctuations (ALFF) and, separately, seed-based connectivity maps, including univariate filtering in the modeling procedures, from resting-state fMRI. They observed a correlation of R=0.325 between predictions and gf estimates when using ALFF as the input variable and identified clusters in the left Anterior Cingulate Cortex (ACC) and right Middle Occipital Gyrus (MOG) as mostly responsible for differences captured in the model. When predicting gf from seed-based connectivity maps from these clusters, though, only the connectivity from the ACC could predict gf significantly better than chance. The connectivity between the left ACC and the right prefrontal cortex was the most discriminative for the model performance.
Few articles approached the problem of predicting intellectual abilities from structural connectivity and diffusion-weighted imaging features in general. Powell, Garcia, Yeh, Vettel, and Verstynen (2017) provided results on the predictability of fluid intelligence from structural connectivity, among other traits. They investigated the local structural connectome, derived from measures particular to diffusion MRI in a voxelwise fashion. Using principal components regression with LASSO, they achieved a correlation of R=0.0849 between predictions and actual estimates of fluid intelligence. Zhang et al. (2019) investigated the global structural connectome properties, estimated in a region-to-region approach. They achieved R=0.240, employing the Tensor network PCA method over features extracted from the streamlines, such as fractional anisotropy, mean diffusivity, fiber count, and connected surface area. using the same parcellation and resting-state fMRI data, they achieved R=0.2411 to predict fluid intelligence from functional connectivity.
Albeit correlational studies often provide a measure of predictability of intelligence from neuroimaging, such as the percentage of the variance explained, this measure does not necessarily generalize to unseen subjects, mostly when the subjects were used to derive the features used to explain their variability, since the procedure maximizes performance for the data it has seen. A more accurate estimate should be obtained with proper validation. For this reason, in Table 5, we only included studies reporting the prediction of intellectual scores from neuroimaging with proper generalized performance estimation. We omit studies, such as Song et al. (2008), that asserts that functional connectivity estimates from the Dorsolateral Prefrontal Cortices (DLPFC) to other brain regions are strong predictors of FSIQ for a Chinese population, achieving R2=0.473 and R2=0.730 for two sets of 3 and 6 edges respectively, obtained with an a priori search heuristic.
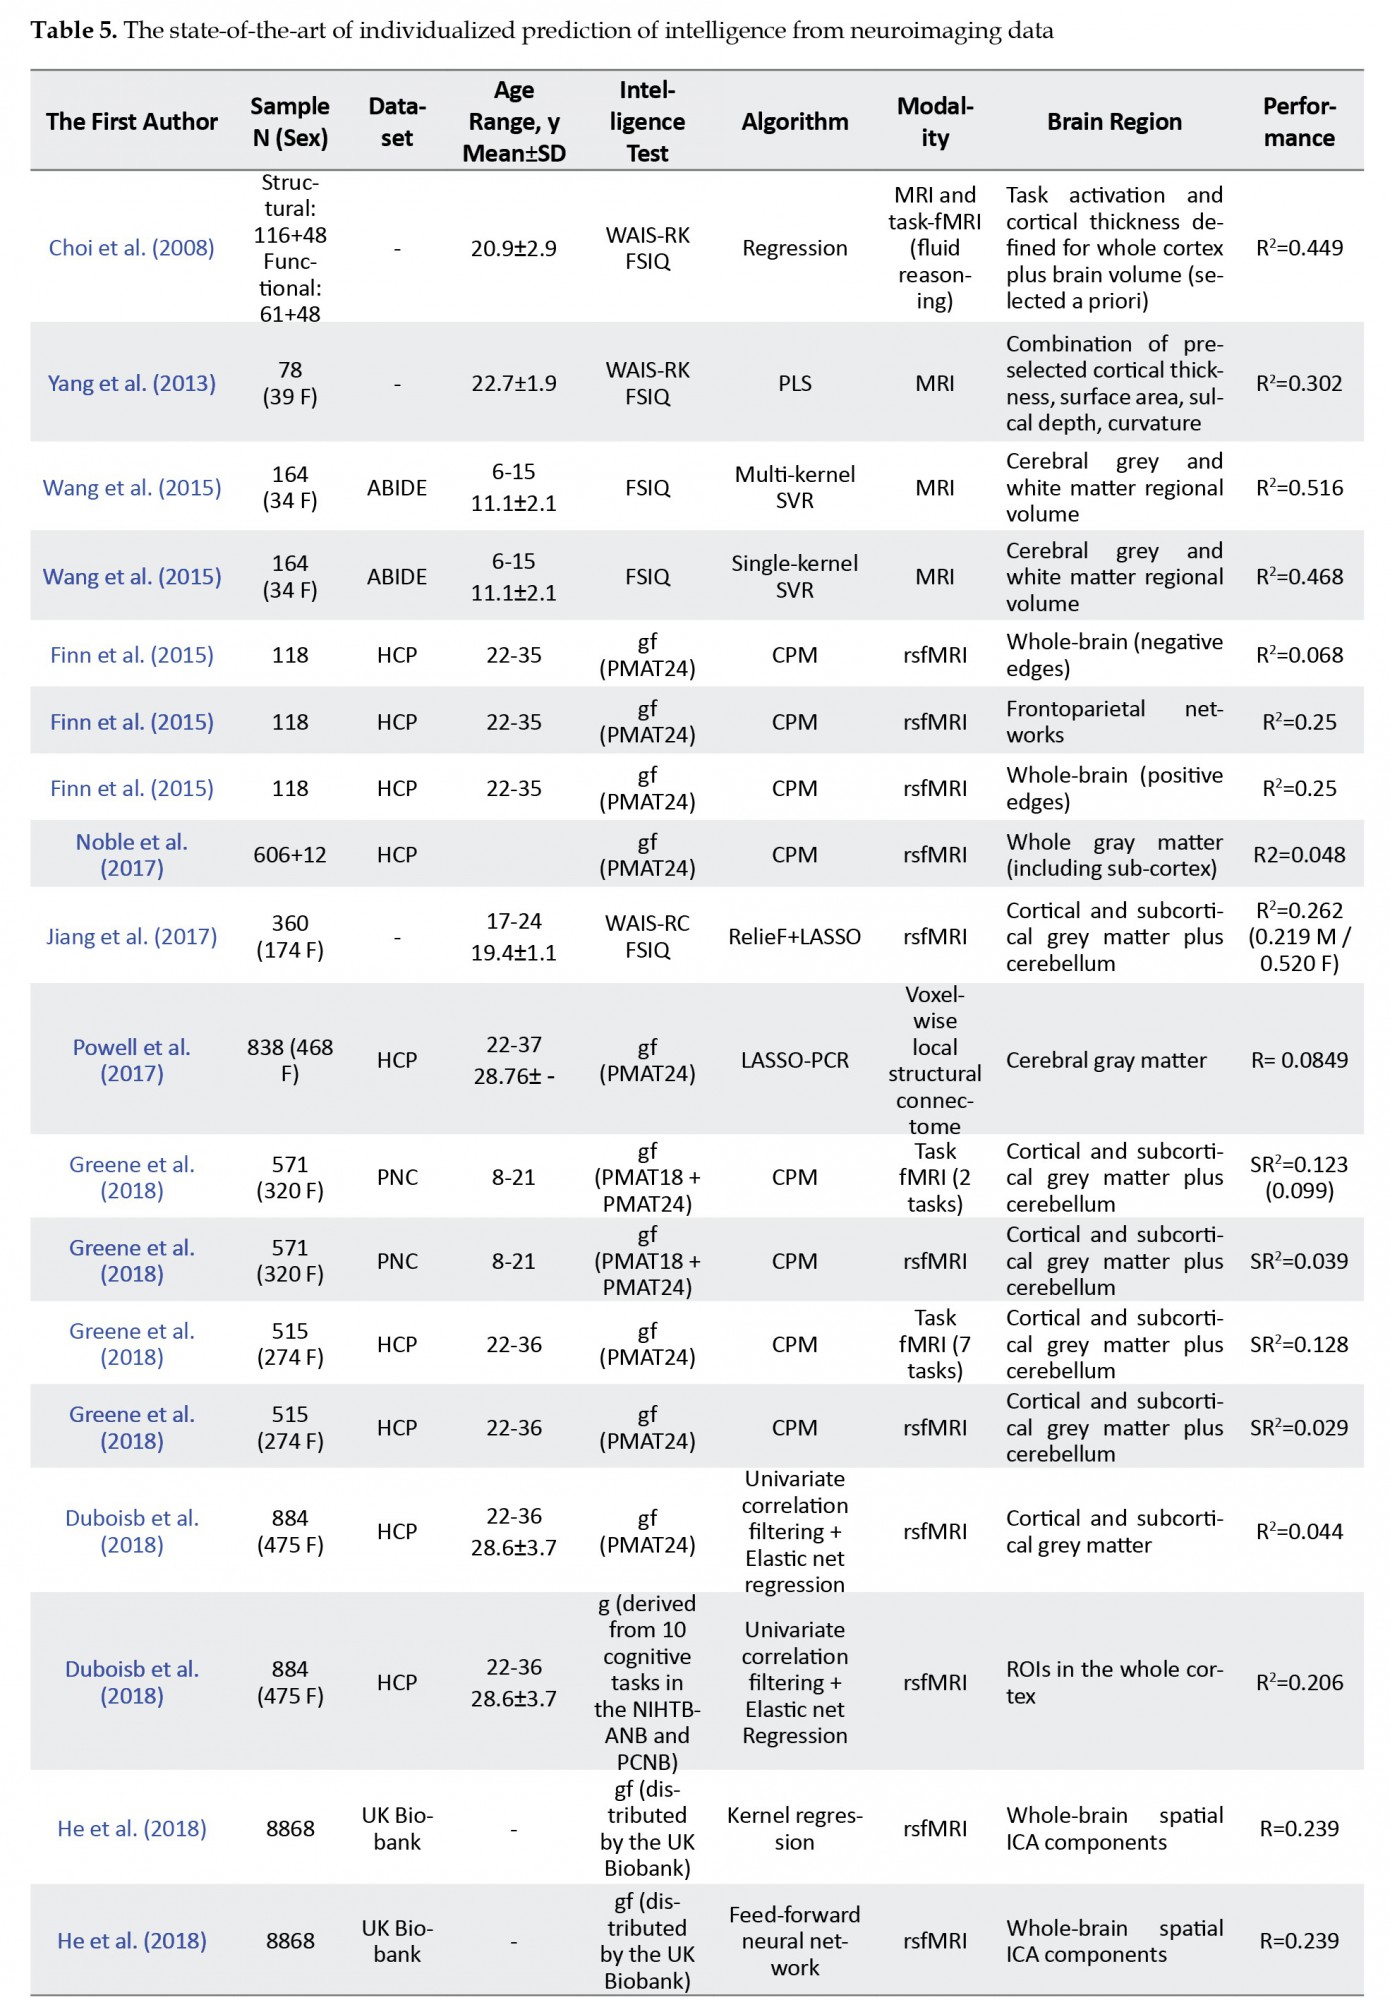
The literature suggests that intelligence can be predicted from neuroimaging data alone to some degree. According to previous theories of the neural bases of intelligence that accommodated single or multiple networks, such as the P-FIT (Jung & Haier, 2007) and NNT (Barbey, 2018), the most recent works imply that predictive information is dispersed across the brain. Accordingly, theories focusing on the high importance of a single cortex region, such as the LPFCT (Duncan & Owen, 2000), are not supported by these findings, which suggest redundancy, not dependency on single regions.
Some methodological issues must be considered in this specific prediction problem. Proper validation is required for the initial results obtained for the predictive modeling. For example, kinship must be in the HCP datasets (Dubois et al., 2018), something not common to other forms of analysis of neuroimaging data. Appropriate treatment of covariates is also necessary. It is required to account for differences in intracranial or brain volume, although subtler relations also exist. Sex, for example, is correlated with intracranial volume (Barnes et al., 2010) which is a strong predictor of intelligence. Movement is negatively correlated with intelligence (Dubois et al., 2018) and leaves a footprint in functional connectivity (van Dijk, Sabuncu, & Buckner, 2012) and morphometric estimates (Reuter et al., 2015). Development and aging cause phenotypical alterations associated with changes in measures obtained in neuroimaging. Development is also prominently associated with changes in intellectual scores. By lack of consensus and its complexity, special care must be taken with the metric of intelligence to be predicted.
Some new avenues can be explored in intelligence prediction from neuroimaging data. Dubois et al. (2018) suggest that naturalistic movie-watching fMRI might be an alternative to improve the Signal-to-Noise Ratio (SNR) by increasing variation in brain activity and retrieve more discriminative information. No study has yet been performed on this front. The use of diffusion-based MRI and dynamic functional connectivity to predict intelligence has also been neglected, with few studies reporting on the use of machine learning techniques to the estimation of intelligence from diffusion-tensor-based metrics or the structural connectome, which are the anatomical backbones that allow communication of distant regions of the brain. Dynamic functional connectivity relates to alternating brain states in short timespans (Calhoun, Miller, Pearlson, & Adali, 2014) and has been contemplated by a theory of intelligence (Barbey, 2018).
New datasets and computational tools from the whole scientific community should influence future steps to link brain biology and intellectual endowment. The advent of large-scale datasets on neuroimaging has furthered the search for the neural loci of intelligence. Examples include the Human Connectome Project (HCP) (Van Essen et al., 2013; Glasser et al., 2016), UK Biobank (Miller et al., 2016; Sudlow et al., 2015), Cambridge Centre for Aging and Neuroscience (Cam-CAN) (Shafto et al., 2014; Taylor et al., 2017), and Nathan Kline Institute’s Rockland Sample (NKI-RS) (Nooner et al., 2012). We expect future works use these datasets even more. In the spirit of CPM, the appearance of other toolboxes will also accelerate the widespread usage of machine learning in the study of human intelligence and other traits. Examples include the GraphVar (Brovkin et al., 2018) and PRoNTo (Schrouff et al., 2013; Schrouff et al., 2018) toolboxes.
The intelligence research area could also benefit from community challenges that proved productive to other fields of study in neuroscience and neuroimaging. Successful examples include the ADHD-200 Global Competition, Brain Tumor Segmentation, Radiomics Survival Prediction (BRATS) Challenges, and The Alzheimer's Disease Prediction Longitudinal Evolution (TADPOLE) Challenge. The ABCD Neurocognitive Prediction Challenge 2019, offered in conjugation with the 22nd International Conference on Medical Image Computing and Computer-Assisted Intervention, was a first and welcome competition aimed at deriving predictive models for fluid intelligence based on neuroimaging, and we expect the community to multiply these initiatives. With the increasing size of open neuroimaging databases, we believe it is time to employ more complex, possibly non-linear approaches. Even with the substantial negative results in He et al. (2018), deep learning and convolutional neural networks (LeCun, Bengio, & Hinton, 2015) have made inroads into neuroimaging with the increases in computational power and robustness of optimization methods and are a framework to be considered by any future studies. News venues of research are open to augment previous architectures with regularization specially tailored to the problem or create and deploy new less data-hungry architectures and training modalities.
Ethical Considerations
Compliance with ethical guidelines
Funding
Authors' contributions
Conflict of interest
Acknowledgments
Reference
Amin, M. F., Plis, S. M., Chekroud, A., Hjelm, D., Damaraju, E., & Lee, H. J., et al. (2018). Reading the (functional) writing on the (structural) wall: Multimodal fusion of brain structure and function via a deep neural network based translation approach reveals novel impairments in schizophrenia. NeuroImage, 181, 734-47. [DOI:10.1016/J.NEUROIMAGE.2018.07.047] [PMID] [PMCID]
Bajaj, S., Raikes, A., Smith, R., Dailey, N. S., Alkozei, A., & Vanuk, J. R., et al. (2018). The relationship between general intelligence and cortical structure in healthy individuals. Neuroscience, 388, 36-44. [DOI:10.1016/j.neuroscience.2018.07.008] [PMID]
Barbey, A. K. (2018). Network neuroscience theory of human intelligence. Trends in Cognitive Sciences, 22(1), 8-20. [DOI:10.1016/j.tics.2017.10.001] [PMID]
Barnes, J., Ridgway, G. R., Bartlett, J., Henley, S. M. D., Lehmann, M., & Hobbs, N., et al. (2010). Head size, age and gender adjustment in MRI studies: A necessary nuisance? NeuroImage, 53(4), 1244-1255. [DOI:10.1016/j.neuroimage.2010.06.025] [PMID]
Basten, U., Hilger, K., & Fiebach, C. J. (2015). Where smart brains are different: A quantitative meta-analysis of functional and structural brain imaging studies on intelligence. Intelligence, 51, 10-27. [DOI:10.1016/j.intell.2015.04.009]
Basten, U., Stelzel, C., & Fiebach, C. J. (2013). Intelligence is differentially related to neural effort in the task-positive and the task-negative brain network. Intelligence, 41(5), 517-528. [DOI:10.1016/j.intell.2013.07.006]
Beaujean, A. (2015). John Carroll’s views on intelligence: Bi-Factor vs. Higher-Order Models. Journal of Intelligence, 3(4), 121-36. [DOI:10.3390/jintelligence3040121]
Brovkin, A., Waller, L., Dorfschmidt, L., Bzdok, D., Walter, H., & Kruschwitz, J. D. (2018). GraphVar 2.0: A user-friendly toolbox for machine learning on functional connectivity measures. Journal of Neuroscience Methods, 308(March), 21-33. [DOI:10.1016/j.jneumeth.2018.07.001] [PMID]
Burgaleta, M., Macdonald, P. A., Martínez, K., Román, F. J., Álvarez-Linera, J., & González, A. R., et al. (2014). Subcortical regional morphology correlates with fluid and spatial intelligence. Human Brain Mapping, 35(5), 1957-68. [DOI:10.1002/hbm.22305] [PMID] [PMCID]
Byington, E., & Felps, W. (2010). Why do IQ scores predict job performance? An alternative, sociological explanation. Research in Organizational Behavior, 30(C), 175-202. [DOI:10.1016/j.riob.2010.08.003]
Bzdok, D. (2017). Classical statistics and statistical learning in imaging neuroscience. Frontiers in Neuroscience, 11(OCT), 1-23. [DOI:10.3389/fnins.2017.00543] [PMID] [PMCID]
Bzdok, D., Altman, N., & Krzywinski, M. (2018). Points of Significance: Statistics versus machine learning. Nature Methods, 15(4), 233-4. [DOI:10.1038/nmeth.4642] [PMID] [PMCID]
Calhoun, V. D., Miller, R., Pearlson, G., & Adali, T. (2014). The Chronnectome: Time-Varying Connectivity Networks as the Next Frontier in fMRI Data Discovery. Neuron, 84(2), 262-74. [DOI:10.1016/j.neuron.2014.10.015] [PMID] [PMCID]
Cattell, R. B. (1963). Theory of fluid and crystallized intelligence: A critical experiment. Journal of Educational Psychology, 54(1), 1-22. [DOI:10.1037/h0046743]
Charman, T., Pickles, A., Simonoff, E., Chandler, S., Loucas, T., & Baird, G. (2011). IQ in children with autism spectrum disorders: Data from the Special Needs and Autism Project (SNAP). Psychological Medicine, 41(3), 619-627. [DOI:10.1017/S0033291710000991] [PMID]
Chase, T. N., Fedio, P., Foster, N. L., Brooks, R., Di Chiro, G., & Mansi, L. (1984). Wechsler Adult Intelligence Scale Performance. Archives of Neurology, 41, 1244-7. [DOI:10.1001/archneur.1984.04050230026012] [PMID]
Choi, Y. Y., Shamosh, N. A., Cho, S. H., DeYoung, C. G., Lee, M. J., & Lee, J.M., et al. (2008). Multiple bases of human intelligence revealed by cortical thickness and neural activation. Journal of Neuroscience, 28(41), 10323-9. [DOI:10.1523/JNEUROSCI.3259-08.2008] [PMID] [PMCID]
Clayden, J. D., Jentschke, S., Muñoz, M., Cooper, J. M., Chadwick, M. J., & Banks, T., et al. (2012). Normative development of white matter tracts: Similarities and differences in relation to age, gender, and intelligence. Cerebral Cortex, 22(8), 1738-1747. [DOI:10.1093/cercor/bhr243] [PMID]
Cole, J. H., & Franke, K. (2017). Predicting age using neuroimaging: innovative brain ageing biomarkers. Trends in Neurosciences, 40(12), 681-90. [DOI:10.1016/j.tins.2017.10.001] [PMID]
Cole, M. W., Ito, T., & Braver, T. S. (2015). Lateral prefrontal cortex contributes to fluid intelligence through multinetwork connectivity. Brain Connectivity, 5(8), 497-504. [DOI:10.1089/brain.2015.0357] [PMID] [PMCID]
Cole, M. W., Yarkoni, T., Repovš, G., Anticevic, A., & Braver, T. S. (2012). Global Connectivity of Prefrontal Cortex Predicts Cognitive Control and Intelligence. The Journal of Neuroscience, 32(26), 8988-9. [DOI:10.1523/JNEUROSCI.0536-12.2012] [PMID] [PMCID]
Colom, R., Abad, F. J., García, L. F., & Juan-Espinosa, M. (2002). Education, Wechsler’s full scale IQ, and g. Intelligence, 30(5), 449-462. [DOI:10.1016/S0160-2896(02)00122-8]
Colom, R., Burgaleta, M., Román, F. J., Karama, S., Álvarez-Linera, J., & Abad, F. J., et al. (2013). Neuroanatomic overlap between intelligence and cognitive factors: Morphometry methods provide support for the key role of the frontal lobes. NeuroImage, 72, 143-152. [DOI:10.1016/j.neuroimage.2013.01.032] [PMID]
Deary, I. J., Yang, J., Davies, G., Harris, S. E., Tenesa, A., & Liewald, D., et al. (2012). Genetic contributions to stability and change in intelligence from childhood to old age. Nature, 482(7384), 212-5. [DOI:10.1038/nature10781] [PMID]
Douek, P., Turner, R., Pekar, J., Patronas, N., & Bihan, D. Le. (1991). MR color mapping of myelin fiber orientation. Journal of Computer Assisted Tomography, 15(6), 923-9. [DOI:10.1097/00004728-199111000-00003] [PMID]
Dubois, J., Galdi, P., Han, Y., Paul, L. K., & Adolphs, R. (2018). Resting-state functional brain connectivity best predicts the personality dimension of openness to experience. Personality Neuroscience, 1, e6. [DOI:10.1017/pen.2018.8] [PMID] [PMCID]
Dubois, J., Galdi, P., Paul, L. K., & Adolphs, R. (2018). A distributed brain network predicts general intelligence from resting-state human neuroimaging data. Philosophical Transactions of the Royal Society B: Biological Sciences, 373(1756), 20170284. [DOI:10.1098/rstb.2017.0284] [PMID] [PMCID]
Duncan, J. (2010). The Multiple-Demand (MD) system of the primate brain: mental programs for intelligent behaviour. Trends in Cognitive Sciences, 14(4), 172-9. [DOI:10.1016/j.tics.2010.01.004] [PMID]
Duncan, J., & Owen, A. M. (2000). Common regions of the human frontal lobe recruited by diverse cognitive demands. Trends in Neurosciences, 23(10), 475-83. [DOI:10.1016/S0166-2236(00)01633-7]
Dunst, B., Benedek, M., Koschutnig, K., Jauk, E., & Neubauer, A. C. (2014). Sex differences in the IQ-white matter microstructure relationship: A DTI study. Brain and Cognition, 91, 71-8. [DOI:10.1016/j.bandc.2014.08.006] [PMID] [PMCID]
Ebisch, S. J., Perrucci, M. G., Mercuri, P., Romanelli, R., Mantini, D., & Romani, G. L., et al. (2012). Common and unique neuro-functional basis of induction, visualization, and spatial relationships as cognitive components of fluid intelligence. NeuroImage, 62(1), 331-42. [DOI:10.1016/j.neuroimage.2012.04.053] [PMID]
Elliott, M. L., Knodt, A. R., Cooke, M., Kim, M. J., Melzer, T. R., & Keenan, R., et al. (2019). General functional connectivity: Shared features of resting-state and task fMRI drive reliable and heritable individual differences in functional brain networks. NeuroImage, 189(January), 516-32. [DOI:10.1016/j.neuroimage.2019.01.068] [PMID] [PMCID]
Van Essen, D. C., Smith, S. M., Barch, D. M., Behrens, T. E., Yacoub, E., & Ugurbil, K., & Wu-Minn HCP Consortium. (2013). The WU-Minn human connectome project: an overview. Neuroimage, 80, 62-79. [DOI:10.1016/j.neuroimage.2013.05.041] [PMID] [PMCID]
Finn, E. S., Shen, X., Scheinost, D., Rosenberg, M. D., Huang, J., & Chun, M. M., et al. (2015). Functional connectome fingerprinting: identifying individuals using patterns of brain connectivity. Nature Neuroscience, 18(11), 1664-71. [DOI:10.1038/nn.4135] [PMID] [PMCID]
Fischer, F. U., Wolf, D., Scheurich, A., & Fellgiebel, A. (2014). Association of structural global brain network properties with intelligence in normal aging. PLoS ONE, 9(1), e86258.[DOI:10.1371/journal.pone.0086258] [PMID] [PMCID]
Fjell, A. M., Westlye, L. T., Amlien, I. K., Tamnes, C. K., Grydeland, H., & Engvig, A., et al. (2015). High-expanding cortical regions in human development and evolution are related to higher intellectual abilities. Cerebral Cortex, 25(1), 26-34. [DOI:10.1093/cercor/bht201] [PMID]
Genç, E., Fraenz, C., Schlüter, C., Friedrich, P., Hossiep, R., & Voelkle, M. C., et al. (2018). Diffusion markers of dendritic density and arborization in gray matter predict differences in intelligence. Nature Communications, 9(1), 1-11. [DOI:10.1038/s41467-018-04268-8] [PMID] [PMCID]
Gignac, G. E. (2015). Raven’s is not a pure measure of general intelligence: Implications for g factor theory and the brief measurement of g. Intelligence, 52, 71-9. [DOI:10.1016/j.intell.2015.07.006]
Gignac, G. E., & Bates, T. C. (2017). Brain volume and intelligence: The moderating role of intelligence measurement quality. Intelligence, 64(May), 18-29. [DOI:10.1016/j.intell.2017.06.004]
Glasser, M. F., Smith, S. M., Marcus, D. S., Andersson, J. L. R., Auerbach, E. J., & Behrens, T. E. J., et al. (2016). The Human Connectome Project’s neuroimaging approach. Nature Neuroscience, 19(9), 1175-87. [DOI:10.1038/nn.4361] [PMID] [PMCID]
Gottfredson, L. S., & Deary, I. J. (2004). Intelligence Predicts Health and Longevity, but Why? Current Directions in Psychological Science, 13(1), 1-4. [DOI:10.1111/j.0963-7214.2004.01301001.x]
Graham, S., Jiang, J., Manning, V., Nejad, A. B., Zhisheng, K., & Salleh, S. R., et al. (2010). IQ-related fMRI differences during cognitive set shifting. Cerebral Cortex, 20(3), 641-9. [DOI:10.1093/cercor/bhp130] [PMID] [PMCID]
Grazioplene, R. G., G. Ryman, S., Gray, J. R., Rustichini, A., Jung, R. E., & DeYoung, C. G. (2015). Subcortical intelligence: caudate volume predicts IQ in healthy adults. Human Brain Mapping, 36(4), 1407-16. [DOI:10.1002/hbm.22710] [PMID] [PMCID]
Greene, A. S., Gao, S., Scheinost, D., & Constable, R. T. (2018). Task-induced brain state manipulation improves prediction of individual traits. Nature Communications, 9(1), 1-13. [DOI:10.1038/s41467-018-04920-3] [PMID] [PMCID]
Gregory, R. J. (2014). Psychological testing history, principles, and applications. New Jersey: Prentice Hall; 2008. https://books.google.com/books?id=HbMWogEACAAJ&source=gbs_book_other_versions
Haász, J., Westlye, E. T., Fjær, S., Espeseth, T., Lundervold, A., & Lundervold, A. J. (2013). General fluid-type intelligence is related to indices of white matter structure in middle-aged and old adults. NeuroImage, 83, 372-83. [DOI:10.1016/j.neuroimage.2013.06.040] [PMID]
Haier, R. J. (2015). What does a smart brain look like? Scientific American, 23(5), 18-25. [DOI:10.1038/scientificamericangenius0115-18]
Haier, R. J., Siegel, B. V., Nuechterlein, K. H., Hazlett, E., Wu, J. C., & Paek, J., et al. (1988). Cortical glucose metabolic rate correlates of abstract reasoning and attention studied with positron emission tomography. Intelligence, 12(2), 199-217. [DOI:10.1016/0160-2896(88)90016-5]
He, T., Kong, R., Holmes, A., Nguyen, M., Sabuncu, M. R., & Eickhoff, S. B., et al. (2018). Do deep neural networks outperform kernel regression for functional connectivity prediction of behavior? BioRxiv, 473603. [DOI:10.1101/473603]
Hearne, L. J., Mattingley, J. B., & Cocchi, L. (2016). Functional brain networks related to individual differences in human intelligence at rest. Scientific Reports, 6(August), 32328. [DOI:10.1038/srep32328] [PMID] [PMCID]
Hilger, K., Ekman, M., Fiebach, C. J., & Basten, U. (2017a). Efficient hubs in the intelligent brain: Nodal efficiency of hub regions in the salience network is associated with general intelligence. Intelligence, 60, 10-25. [DOI:10.1016/j.intell.2016.11.001]
Hilger, K., Ekman, M., Fiebach, C. J., & Basten, U. (2017b). Intelligence is associated with the modular structure of intrinsic brain networks. Scientific Reports, 7(1), 1-12. [DOI:10.1038/s41598-017-15795-7] [PMID] [PMCID]
Hunter, J. E. (1986). Cognitive ability, cognitive aptitudes, job knowledge, and job performance. Journal of Vocational Behavior, 29(3), 340-62. [DOI:10.1016/0001-8791(86)90013-8]
Jensen, A. R. (1973). Level I and level ii abilities in three ethnic groups. Source American Educational Research Journal, 10(4), 263-76. [DOI:10.3102/00028312010004263]
Jensen, A. R. (1980). Bias In Mental Testing. Behavioral and Brain Sciences, 3(3), 325-33. [DOI:10.1017/S0140525X00005161]
Jensen, A. R. (1992). Commentary: Vehicles of g. Psychological Science, 3(5), 275-8. [DOI:10.1111/j.1467-9280.1992.tb00671.x]
Jiang, R., Qi, S., Du, Y., Yan, W., Calhoun, V. D., & Jiang, T., et al. (2017). Predicting individualized intelligence quotient scores using brainnetome-atlas based functional connectivity. Paper presented at 2017 IEEE 27th International Workshop on Machine Learning for Signal Processing (MLSP), Tokyo, Japan, 25-28 September 2017. [DOI:10.1109/MLSP.2017.8168150]
Jung, R. E., & Haier, R. J. (2007). The Parieto-Frontal Integration Theory (P-FIT) of intelligence: converging neuroimaging evidence. Behavioral and Brain Sciences, 30(2), 135-54. [DOI:10.1017/S0140525X07001185] [PMID]
Karama, S., Colom, R., Johnson, W., Deary, I. J., Haier, R., & Waber, D. P., et al. (2011). Cortical thickness correlates of specific cognitive performance accounted for by the general factor of intelligence in healthy children aged 6 to 18. NeuroImage, 55(4), 1443-53. [DOI:10.1016/j.neuroimage.2011.01.016] [PMID] [PMCID]
Kawahara, J., Brown, C. J., Miller, S. P., Booth, B. G., Chau, V., & Grunau, R. E., et al. (2017). BrainNetCNN: Convolutional neural networks for brain networks towards predicting neurodevelopment. NeuroImage, 146(July 2016), 1038-49. [DOI:10.1016/j.neuroimage.2016.09.046] [PMID]
Kievit, R. A., van Rooijen, H., Wicherts, J. M., Waldorp, L. J., Kan, K. J., & Scholte, H. S., et al. (2012). Intelligence and the brain: A model-based approach. Cognitive Neuroscience, 3(2), 89-97. [DOI:10.1080/17588928.2011.628383] [PMID]
Konrad, A., Vucurevic, G., Musso, F., & Winterer, G. (2012). VBM-DTI Correlates of verbal intelligence: A potential link to Broca’s area. Journal of Cognitive Neuroscience, 24(4), 888-95. [DOI:10.1162/jocn_a_00187] [PMID]
Kovacs, K., & Conway, A. R. A. (2016). Process overlap theory: a unified account of the general factor of intelligence. Psychological Inquiry, 27(3), 151-77. [DOI:10.1080/1047840X.2016.1153946]
Koziol, L. F., Budding, D., Andreasen, N., D’Arrigo, S., Bulgheroni, S., & Imamizu, H., et al. (2014). Consensus paper: The cerebellum’s role in movement and cognition. The Cerebellum, 13(1), 151-77. [DOI:10.1007/s12311-013-0511-x] [PMID] [PMCID]
Kroger, J. K., Sabb, F. W., Fales, C. L., Bookheimer, S. Y., Cohen, M. S., & Holyoak, K. J. (2002). Recruitment of anterior dorsolateral prefrontal cortex in human reasoning: a parametric study of relational complexity. Cerebral Cortex (New York, N.Y. : 1991), 12(5), 477-85. [DOI:10.1093/cercor/12.5.477] [PMID]
Kruschwitz, J. D., Waller, L., Daedelow, L. S., Walter, H., & Veer, I. M. (2018). General, crystallized and fluid intelligence are not associated with functional global network efficiency: A replication study with the human connectome project 1200 data set. NeuroImage, 171(January), 323-331. [DOI:10.1016/j.neuroimage.2018.01.018] [PMID]
Lange, N., Froimowitz, M. P., Bigler, E. D., & Lainhart, J. E. (2010). Associations between IQ, total and regional brain volumes, and demography in a large normative sample of healthy children and adolescents. Developmental Neuropsychology, 35(3), 296-317. [DOI:10.1080/87565641003696833] [PMID] [PMCID]
Langeslag, S. J. E., Schmidt, M., Ghassabian, A., Jaddoe, V. W., Hofman, A., & van der Lugt, A., et al. (2013). Functional connectivity between parietal and frontal brain regions and intelligence in young children: The Generation R study. Human Brain Mapping, 34(12), 3299-307. [DOI:10.1002/hbm.22143] [PMID] [PMCID]
LeCun, Y., Bengio, Y., & Hinton, G. (2015). Deep learning. Nature, 521(7553), 436-444. [DOI:10.1038/nature14539] [PMID]
Li, C., Yang, G., Li, M., & Li, B. (2018). Fluid intelligence relates to the resting state amplitude of low-frequency fluctuation and functional connectivity. NeuroReport, 29(1), 8-12. [DOI:10.1097/WNR.0000000000000917] [PMID]
Luders, E., Narr, K. L., Thompson, P. M., & Toga, A. W. (2009). Neuroanatomical correlates of intelligence. Intelligence, 37(2), 156-63. [DOI:10.1016/j.intell.2008.07.002] [PMID] [PMCID]
Luders, E., Thompson, P. M., Narr, K. L., Zamanyan, A., Chou, Y. Y., & Gutman, B., et al. (2011). The link between callosal thickness and intelligence in healthy children and adolescents. NeuroImage, 54(3), 1823-30. [DOI:10.1016/j.neuroimage.2010.09.083] [PMID] [PMCID]
MacDonald, P. A., Ganjavi, H., Collins, D. L., Evans, A. C., & Karama, S. (2014). Investigating the relation between striatal volume and IQ. Brain Imaging and Behavior, 8(1), 52-59. [DOI:10.1007/s11682-013-9242-3] [PMID]
Malpas, C. B., Genc, S., Saling, M. M., Velakoulis, D., Desmond, P. M., & O’Brien, T. J. (2016). MRI correlates of general intelligence in neurotypical adults. Journal of Clinical Neuroscience, 24, 128-34. [DOI:10.1016/j.jocn.2015.07.012] [PMID]
Margolis, A., Bansal, R., Hao, X., Algermissen, M., Erickson, C., & Klahr, K. W., et al. (2013). Using IQ Discrepancy Scores To Examine the Neural Correlates of Specific Cognitive Abilities. Journal of Neuroscience, 33(35), 14135-45. [DOI:10.1523/jneurosci.0775-13.2013] [PMID] [PMCID]
McDaniel, M. A. (2005). Big-brained people are smarter: A meta-analysis of the relationship between in vivo brain volume and intelligence. Intelligence, 33(4), 337-346. [DOI:10.1016/j.intell.2004.11.005]
Menary, K., Collins, P. F., Porter, J. N., Muetzel, R., Olson, E. A., & Kumar, V., et al. (2013). Associations between cortical thickness and general intelligence in children, adolescents and young adults. Intelligence, 41(5), 597-606. [DOI:10.1016/j.intell.2013.07.010] [PMID] [PMCID]
Meng, X., Jiang, R., Zhang, Y., Jiang, T., Sui, J., & Lin, D., et al. (2017). Predicting individualized clinical measures by a generalized prediction framework and multimodal fusion of MRI data. NeuroImage, 145, 218-29. [DOI:10.1016/j.neuroimage.2016.05.026] [PMID] [PMCID]
Miller, E. K., & Cohen, J. D. (2001). An integrative theory of prefrontal cortex function - talk. Annual Review of Neuroscience, 24, 167-202. [DOI:10.1146/annurev.neuro.24.1.167] [PMID]
Miller, K. L., Alfaro-Almagro, F., Bangerter, N. K., Thomas, D. L., Yacoub, E., & Xu, J., et al. (2016). Multimodal population brain imaging in the UK Biobank prospective epidemiological study. Nature Neuroscience, 19(11), 1523-36. [DOI:10.1038/nn.4393] [PMID] [PMCID]
Navas-Sánchez, F. J., Alemán-Gómez, Y., Sánchez-Gonzalez, J., Guzmán-De-Villoria, J. A., Franco, C., & Robles, O., et al. (2014). White matter microstructure correlates of mathematical giftedness and intelligence quotient. Human Brain Mapping, 35(6), 2619-31. [DOI:10.1002/hbm.22355] [PMID] [PMCID]
Nave, G., Jung, W. H., Karlsson Linnér, R., Kable, J. W., & Koellinger, P. D. (2019). Are Bigger Brains Smarter? Evidence From a Large-Scale Preregistered Study. Psychological Science, 30(1), 43-54. [DOI:10.1177/0956797618808470] [PMID]
Nestor, P. G., Ohtani, T., Bouix, S., Hosokawa, T., Saito, Y., & Newell, D. T., et al. (2015). Dissociating prefrontal circuitry in intelligence and memory: Neuropsychological correlates of magnetic resonance and diffusion tensor imaging. Brain Imaging and Behavior, 9(4), 839-47. https://link.springer.com/article/10.1007%2Fs11682-014-9344-6
Neubauer, A. C., & Fink, A. (2009). Intelligence and neural efficiency. Neuroscience and Biobehavioral Reviews, 33(7), 1004-23. [DOI:10.1016/j.neubiorev.2009.04.001] [PMID]
Nielsen, A. N., Greene, D. J., Gratton, C., Dosenbach, N. U. F., Petersen, S. E., & Schlaggar, B. L. (2018). Evaluating the prediction of brain maturity from functional connectivity after motion artifact denoising. Cerebral Cortex, 29(6), 2455-69. [DOI:10.1093/cercor/bhy117] [PMID] [PMCID]
Noble, S., Spann, M. N., Tokoglu, F., Shen, X., Constable, R. T., & Scheinost, D. (2017). Influences on the test-retest reliability of functional connectivity MRI and its relationship with behavioral utility. Cerebral Cortex, 27(11), 5415-429. [DOI:10.1093/cercor/bhx230] [PMID] [PMCID]
Nooner, K. B., Colcombe, S. J., Tobe, R. H., Mennes, M., Benedict, M. M., & Moreno, A. L., et al. (2012). The NKI-Rockland Sample: a model for accelerating the pace of discovery science in psychiatry. Frontiers in Neuroscience, 6(Oct), 152. [DOI:10.3389/fnins.2012.00152] [PMID] [PMCID]
Nusbaum, F., Hannoun, S., Kocevar, G., Stamile, C., Fourneret, P., & Revol, O., et al. (2017). Hemispheric differences in white matter microstructure between two profiles of children with high intelligence quotient vs. controls: a tract-based spatial statistics study. Frontiers in Neuroscience, 11, 173. [DOI:10.3389/fnins.2017.00173]
Kenett, Y. N., Medaglia, J. D., Beaty, R. E., Chen, Q., Betzel, R. F., & Thompson-Schill, S. L., et al. (2018). Driving the brain towards creativity and intelligence: A network control theory analysis. Neuropsychologia, 118, 79-90. https://www.sciencedirect.com/science/article/abs/pii/S0028393218300010
Koenis, M. M., Brouwer, R. M., Swagerman, S. C., van Soelen, I. L., Boomsma, D. I., & Hulshoff Pol, H. E. (2018). Association between structural brain network efficiency and intelligence increases during adolescence. Human Brain Mapping, 39(2), 822-36. [DOI:10.1002/hbm.23885]
Kocevar, G., Suprano, I., Stamile, C., Hannoun, S., Fourneret, P., & Revol, O., et al. (2019). Brain structural connectivity correlates with fluid intelligence in children: a DTI graph analysis. Intelligence, 72, 67-75. https://www.sciencedirect.com/science/article/abs/pii/S0160289618300898
Ohtani, T., Nestor, P. G., Bouix, S., Newell, D., Melonakos, E. D., & McCarley, R. W., et al. (2017). Exploring the neural substrates of attentional control and human intelligence: Diffusion tensor imaging of prefrontal white matter tractography in healthy cognition. Neuroscience, 341, 52-60. [DOI:10.1016/j.neuroscience.2016.11.002] [PMID]
Pamplona, G. S. P., Santos Neto, G. S., Rosset, S. R. E., Rogers, B. P., & Salmon, C. E. G. (2015). Analyzing the association between functional connectivity of the brain and intellectual performance. Frontiers in Human Neuroscience, 9(February), 61. [DOI:10.3389/fnhum.2015.00061] [PMID] [PMCID]
Panizzon, M. S., Vuoksimaa, E., Spoon, K. M., Jacobson, K. C., Lyons, M. J., & Franz, C. E., et al. (2014). Genetic and environmental influences on general cognitive ability: Is g a valid latent construct? Intelligence, 43, 65-76 [DOI:10.1016/j.intell.2014.01.008] [PMID] [PMCID]
Parisot, S., Ktena, S. I., Ferrante, E., Lee, M., Guerrero, R., & Glocker, B., et al. (2018). Disease prediction using graph convolutional networks: Application to Autism Spectrum Disorder and Alzheimer’s disease. Medical Image Analysis, 48, 117-30. [DOI:10.1016/j.media.2018.06.001] [PMID]
Penke, L., Maniega, S. M., Bastin, M. E., Hernández, M. V., Murray, C., & Royle, N. A., et al. (2012). Brain white matter tract integrity as a neural foundation for general intelligence. Molecular Psychiatry, 17(10), 1026-30. https://www.nature.com/articles/mp201266
Pezoulas, V. C., Zervakis, M., Michelogiannis, S., & Klados, M. A. (2017). Resting-State Functional Connectivity and Network Analysis of Cerebellum with Respect to Crystallized IQ and Gender. Frontiers in Human Neuroscience, 11(April), 1-14. [DOI:10.3389/fnhum.2017.00189] [PMID] [PMCID]
Pisner, D. A., Smith, R., Alkozei, A., Klimova, A., & Killgore, W. D. S. (2017). Highways of the emotional intellect: white matter microstructural correlates of an ability-based measure of emotional intelligence. Social Neuroscience, 12(3), 253-67. [DOI:10.1080/17470919.2016.1176600] [PMID]
Plomin, R., & Deary, I. J. (2015). Genetics and intelligence differences: Five special findings. Molecular Psychiatry, 20(1), 98-108. [DOI:10.1038/mp.2014.105] [PMID] [PMCID]
Ponsoda, V., Martínez, K., Pineda-Pardo, J. A., Abad, F. J., Olea, J., & Román, F. J., et al. (2017). Structural brain connectivity and cognitive ability differences: A multivariate distance matrix regression analysis. Human Brain Mapping, 38(2), 803-16. [DOI:10.1002/hbm.23419] [PMID] [PMCID]
Powell, M. A., Garcia, J. O., Yeh, F. C., Vettel, J. M., & Verstynen, T. (2017). Local connectome phenotypes predict social, health, and cognitive factors. Network Neuroscience, 2(1), 86-105. [DOI:10.1162/NETN_a_00031] [PMID] [PMCID]
Prabhakaran, V., Smith, J. A. L., Desmond, J. E., Glover, G. H., & Gabrieli, J. D. E. (1997). Neural substrates of fluid reasoning: an fMRI study of neocortical activation during performance of the Raven’s Progressive Matrices Test. Cognitive Psychology, 33(1), 43-63. [DOI:10.1006/cogp.1997.0659] [PMID]
Raven, J. C. (1941). Standardization of progressive matrices. British Journal of Medical Psychology, 19(1), 137-50. [DOI:10.1111/j.2044-8341.1941.tb00316.x]
Reuter, M., Tisdall, M. D., Qureshi, A., Buckner, R. L., van der Kouwe, A. J. W., & Fischl, B. (2015). Head motion during MRI acquisition reduces gray matter volume and thickness estimates. NeuroImage, 107, 107-15. [DOI:10.1016/j.neuroimage.2014.12.006] [PMID] [PMCID]
Ritchie, S. J., Booth, T., Hernández, M. D. C. V., Corley, J., Maniega, S. M., & Gow, A. J., et al. (2015). Beyond a bigger brain: Multivariable structural brain imaging and intelligence. Intelligence, 51, 47-56. [DOI:10.1016/j.intell.2015.05.001] [PMID] [PMCID]
Saggar, M., Sporns, O., Gonzalez-Castillo, J., Bandettini, P. A., Carlsson, G., & Glover, G., et al. (2018). Towards a new approach to reveal dynamical organization of the brain using topological data analysis. Nature Communications, 9(1), 1-14. [DOI:10.1038/s41467-018-03664-4] [PMID] [PMCID]
Santarnecchi, E., Emmendorfer, A., & Pascual-Leone, A. (2017). Dissecting the parieto-frontal correlates of fluid intelligence: A comprehensive ALE meta-analysis study. Intelligence, 63, 9-28. [DOI:10.1016/j.intell.2017.04.008]
Santarnecchi, E., Emmendorfer, A., Tadayon, S., Rossi, S., Rossi, A., & Pascual-Leone, A. (2017). Network connectivity correlates of variability in fluid intelligence performance. Intelligence, 65(October), 35-47. [DOI:10.1016/j.intell.2017.10.002]
Satterthwaite, T. D., Connolly, J. J., Ruparel, K., Calkins, M. E., Jackson, C., & Elliott, M. A., et al. (2016). The Philadelphia Neurodevelopmental Cohort: A publicly available resource for the study of normal and abnormal brain development in youth. NeuroImage, 124, 1115-9. [DOI:10.1016/j.neuroimage.2015.03.056] [PMID] [PMCID]
Satterthwaite, T. D., Elliott, M. A., Ruparel, K., Loughead, J., Prabhakaran, K., & Calkins, M. E., et al. (2014). Neuroimaging of the Philadelphia Neurodevelopmental Cohort. NeuroImage, 86, 544-53. [DOI:10.1016/j.neuroimage.2013.07.064] [PMID] [PMCID]
Schnack, H. G., Van Haren, N. E. M., Brouwer, R. M., Evans, A., Durston, S., & Boomsma, D. I., et al. (2015). Changes in thickness and surface area of the human cortex and their relationship with intelligence. Cerebral Cortex, 25(6), 1608-17. [DOI:10.1093/cercor/bht357] [PMID]
Schrouff, J., Rosa, M. J., Rondina, J. M., Marquand, A. F., Chu, C., & Ashburner, J., et al. (2013). PRoNTo: Pattern recognition for neuroimaging toolbox. Neuroinformatics, 11(3), 319-37. [DOI:10.1007/s12021-013-9178-1] [PMID] [PMCID]
Schrouff, J., Monteiro, J. M., Portugal, L., Rosa, M. J., Phillips, C., & Mourão-Miranda, J. (2018). Embedding anatomical or functional knowledge in whole-brain multiple kernel learning models. Neuroinformatics, 16(1), 117-43. [DOI:10.1007/s12021-017-9347-8] [PMID] [PMCID]
Schultz, D. H., & Cole, M. W. (2016). Higher intelligence is associated with less task-related brain network reconfiguration. The Journal of Neuroscience : The Official Journal of the Society for Neuroscience, 36(33), 8551-61. [DOI:10.1523/JNEUROSCI.0358-16.2016] [PMID] [PMCID]
Shafto, M. A., Tyler, L. K., Dixon, M., Taylor, J. R., Rowe, J. B., & Cusack, R., et al. (2014). The Cambridge Centre for Ageing and Neuroscience (Cam-CAN) study protocol: a cross-sectional, lifespan, multidisciplinary examination of healthy cognitive ageing. BMC Neurology, 14(1), 204. [DOI:10.1186/s12883-014-0204-1] [PMID] [PMCID]
Song, M., Zhou, Y., Li, J., Liu, Y., Tian, L., & Yu, C., et al. (2008). Brain spontaneous functional connectivity and intelligence. NeuroImage, 41(3), 1168-76. [DOI:10.1016/j.neuroimage.2008.02.036] [PMID]
Spearman, C. (1904). “General Intelligence,” objectively determined and measured. The American Journal of Psychology, 15(2), 201. [DOI:10.2307/1412107]
Styliadis, C., Ioannides, A. A., Bamidis, P. D., & Papadelis, C. (2015). Distinct cerebellar lobules process arousal, valence and their interaction in parallel following a temporal hierarchy. NeuroImage, 110, 149-61. [DOI:10.1016/j.neuroimage.2015.02.006] [PMID]
Sudlow, C., Gallacher, J., Allen, N., Beral, V., Burton, P., & Danesh, J., et al. (2015). UK Biobank: An Open Access Resource for Identifying the Causes of a Wide Range of Complex Diseases of Middle and Old Age. PLoS Medicine, 12(3), 1-10. [DOI:10.1371/journal.pmed.1001779] [PMID] [PMCID]
Tang, C. Y., Eaves, E. L., Ng, J. C., Carpenter, D. M., Mai, X., & Schroeder, D. H., et al. (2010). Brain networks for working memory and factors of intelligence assessed in males and females with fMRI and DTI. Intelligence, 38(3), 293-303. [DOI:10.1016/j.intell.2010.03.003]
Taylor, J. R., Williams, N., Cusack, R., Auer, T., Shafto, M. A., & Dixon, M., et al. (2017). The Cambridge Centre for Ageing and Neuroscience (Cam-CAN) data repository: Structural and functional MRI, MEG, and cognitive data from a cross-sectional adult lifespan sample. NeuroImage, 144(Pt B), 262-9. [DOI:10.1016/j.neuroimage.2015.09.018] [PMID] [PMCID]
Tschentscher, N., Mitchell, D., & Duncan, J. (2017). Fluid intelligence predicts novel rule implementation in a distributed frontoparietal control network. The Journal of Neuroscience, 37(18), 4841-7. [DOI:10.1523/jneurosci.2478-16.2017] [PMID] [PMCID]
Tulsky, D., Saklofske, D. H., & Zhu, J. (2003). Revising a standard: An evaluation of the origin and development of the WAIS-III. Clinical Interpretations of the WAIS-III and WMS-III, 43-92. [DOI:10.1016/B978-012703570-3/50006-7]
Vakhtin, A. A., Ryman, S. G., Flores, R. A., & Jung, R. E. (2014). Functional brain networks contributing to the parieto-frontal integration theory of intelligence. NeuroImage, 103, 349-54. [DOI:10.1016/j.neuroimage.2014.09.055] [PMID]
van Dijk, K. R. A., Sabuncu, M. R., & Buckner, R. L. (2012). The influence of head motion on intrinsic functional connectivity MRI. NeuroImage, 59(1), 431-438. [DOI:10.1016/j.neuroimage.2011.07.044] [PMID] [PMCID]
Wang, Leiqiong, Song, M., Jiang, T., Zhang, Y., & Yu, C. (2011). Regional homogeneity of the resting-state brain activity correlates with individual intelligence. Neuroscience Letters, 488(3), 275-8. [DOI:10.1016/j.neulet.2010.11.046] [PMID]
Wang, L., Wee, C. Y., Suk, H. I., Tang, X., & Shen, D. (2015). MRI-based intelligence quotient (IQ) estimation with sparse learning. PloS one, 10(3), e0117295. [DOI:10.1371/journal.pone.0117295] [PMID] [PMCID]
Wang, Y., Adamson, C., Yuan, W., Altaye, M., Rajagopal, A., & Byars, A. W., et al. (2012). Sex differences in white matter development during adolescence: ADTI study. Brain Research, 1478, 1-15. [DOI:10.1016/j.brainres.2012.08.038] [PMID] [PMCID]
Wechsler, D. (2008). Wechsler Adult Intelligence Scale-Fourth Edition (WAIS-IV). San Antonio: Pearson. [DOI:10.1037/t15169-000]
Wechsler, D. (1944). The measurement of adult intelligence. Philadelphia: Williams & Wilkins Co. https://content.apa.org/PsycBOOKS/toc/11329
Westerhausen, R., Friesen, C.-M., Rohani, D. A., Krogsrud, S. K., Tamnes, C. K., & Skranes, J. S., et al. (2017). The corpus callosum as anatomical marker of intelligence? A critical examination in a large-scale developmental study. Brain Structure and Function, 223(1), 285-96. [DOI:10.1007/s00429-017-1493-0] [PMID] [PMCID]
Yang, J. J., Yoon, U., Yun, H. J., Im, K., Choi, Y. Y., & Lee, K. H., et al. (2013). Prediction for human intelligence using morphometric characteristics of cortical surface: Partial least square analysis. Neuroscience, 246, 351-61. [DOI:10.1016/j.neuroscience.2013.04.051] [PMID]
Yoo, K., Rosenberg, M. D., Noble, S., Scheinost, D., Constable, R. T., & Chun, M. M. (2019). Multivariate approaches improve the reliability and validity of functional connectivity and prediction of individual behaviors. NeuroImage, 197(November 2018), 212-23. [DOI:10.1016/j.neuroimage.2019.04.060] [PMID] [PMCID]
Received: 2020/04/26 | Accepted: 2020/10/28 | Published: 2021/01/1
| Rights and permissions | |
 |
This work is licensed under a Creative Commons Attribution-NonCommercial 4.0 International License. |
![]()
Copyright © The Author(s);
This is an open access article distributed under the terms of the Creative Commons Attribution License (CC-By-NC), which permits use, distribution, and reproduction in any medium, provided the original work is properly cited and is not used for commercial purposes.
Contact Information
